

In-depth trading ideas

ACCESS IS ABOUT TO SENDAccess, similarly to XCN a few months ago, had a massive uptick in volume last week. Approximately 52million per Trading View. The outcome lead to the rally we had to .00180.
This was not a wash of buys/sells in my humble unprofessional opinion.
I’ve seen this many times.
I surmise this to be an OTC trade.
Access is in a triangle formation, a flag if you will, on the four hour.
This is about to breakout to the upside. I estimate conservatively, .00350 in the short, with a bullish shot at .0
Long
ACSUSD ABOUT TO MOVE FAST UPWARDSACSUSD 1H just broke a downtrend. Looks like it's on a fast upward track. This is likely to reach somewhere around 0.028 or 0.03 before the candle burns down, but we'll have to keep an eye on it. #ACSUSD #CRYPTO
Long
$ACS Analysis ACS Analysis 🚨
ACS is currently testing the red resistance zone. If a successful breakout occurs:
🎯 First Target: Green line level
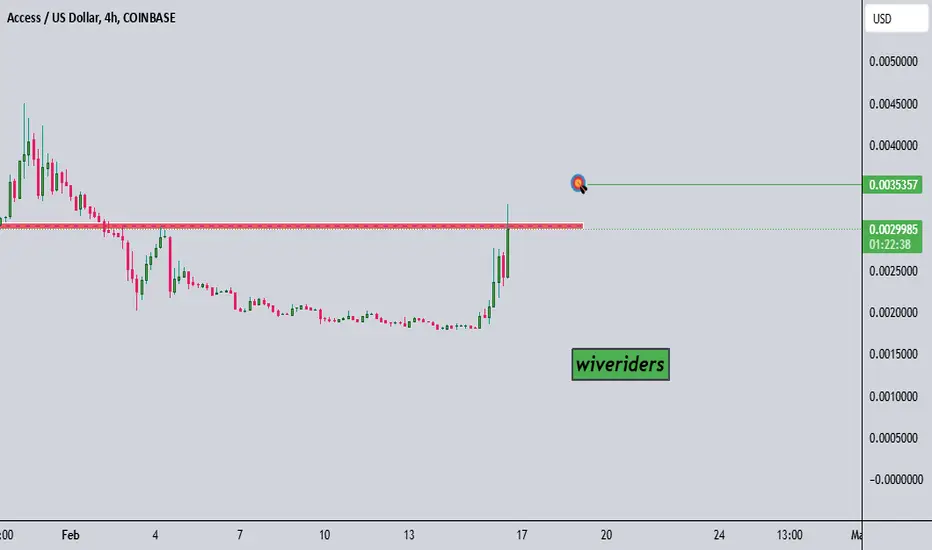
ACS USD Get in now! FIbs don't lie. This got listed on coinbase few months back. Low volume coin at the moment. This a community coin where nft's and such are rewarded by subscribing to an artists nft collection. They also air drop NFT to their subscribers. Around 33% staking rewards. Has potential
Long
Access Protocol: Potential for 100-130% Gains?Technical (Chart) Factors:
- Attempting a Breakout: ACS is showing signs of breaking out from its extended downtrend, which could signal the start of a new upward movement.
-Stochastic RSI Crossover: A recent stochastic crossover from the oversold area adds support to this potential bullish reversal *settings of 15, 15, 4, 4 at a 3x time frame resolution* (Personal preference, works well for me)
-Buying Zone: A buying zone is marked on the chart, highlighting a possible support level where ACS
Long
ACS Bullish weekly...lets goLike this weekly chart. Hold a few hundred ga-zillion or about $100 last year. LOL. Its inevitable!
Long
Fakeouts and Breakouts to look out for right NOW in $ACSUSDLadies and gentlemen, probably the most important thing to look out for to confirm a bullish trend continuation is not just the breakout of the range, but surpassing the previous relative high, and then confirmation with a test of support located at that high.
Here on the one hour chart be immediately wary of any price action approaching the lower boundaries of the Bollinger bands, though that could lead to a very bullish bounce, just keep your eyes peeled in case it snowballs very quickly.
Th

$ACSUSD 56% Train departing nowLadies and gentlemen, the train is leaving station $0.00201 with our first stop at $0.00315, time en-route one to two weeks. Be ready to disembark as we approach the station, especially if we make great time of less than one week, because we may change tracks and head back to pick up any remaining passengers who missed the ride, but likely to fly through to destinations further down the line after that.
All aboard for 56%
Long
ACSUSD 12/6/2024ACSUSD Daily Chart Analysis
Overview:
After topping out between March and April 2024, ACSUSD experienced a steep downtrend, respecting the 50-day and 200-day EMAs until late October 2024. However, a reversal began in early November with strong signals pointing to bullish momentum.
________________________________________
Key Observations:
1. Reversal Pattern:
o On November 4th and 5th, a Tweezer Bottom pattern formed, signaling a potential trend reversal.
o Confirmation came the follow
Long
Breakout from Symmetrical Triangle Pattern - ACSAUSD Trade SetupThis chart shows a symmetrical triangle breakout on the ACSAUSD 30-minute timeframe. The price has broken above the resistance line of the triangle, confirming a potential upward trend. Key levels include:
Entry Point: Near the breakout level marked by the yellow zone.
Stop Loss: Below the triangle at 0.0017974 to manage risk.
Take Profit: Target set at 0.0019953, aligning with the next resistance zone.
The trade setup has a favorable risk-to-reward ratio and is backed by trendline support and
Long
ACS/USD IF YOU HAVE ENOUGH PATIENCE LONG TERM SPECULATIONAfter the recent market activity its not impossible that we will have the following scenario on the long run. We have a lot of speculative activity on the market, picking up low market cap coins pushing them into unrealistic valuations. I also see a lot of thing happening with ACS, but do not consider this analysis as an investment advice. I will give a try on my own risk.
Long
$ACSUSDNot financial advice.
COINBASE:ACSUSD
It's trying to break this downtrend and long base. Will see if it does breaks and retest for confirmation so far is doing a lot of consolidation.
Like and subscribe .
Thanks.

Classic Cup & Handle Breakout & Re-testVery simple - a classic cup and handle formation, already confirmed and re-testing a breakout:
- has already broken out of the handle forming a 2nd smaller cup
- and since broken above and held above the weekly cup's neckline
It has held above for several weeks and is now re-testing that neckline.
Targets are TP 1 and 2, measured from the length of the bottom of cup to its neckline, from its neckline up (TP 1) and then a half length above that (TP 2).
Conditions for hitting take profit t
Long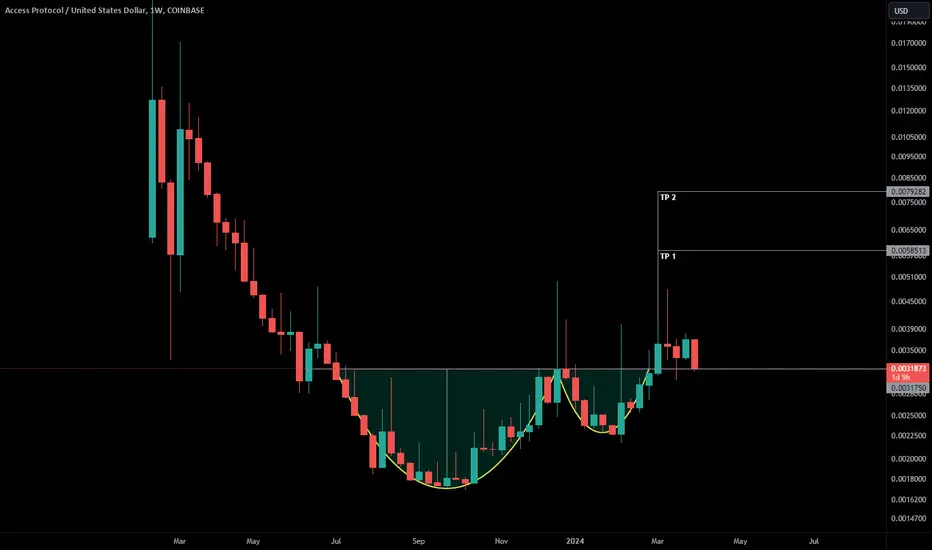
$ACSI like ACS for the long-term, the chart is surprisingly clean.
Once PA get's past EQ, ACS will take off another zero fairly easy,
there's little to no resistance above 0.006. ACS is one of those projects
you buy a bag of and just let it ride. Should make ppl a lot of money. Good Luck everyone!
Long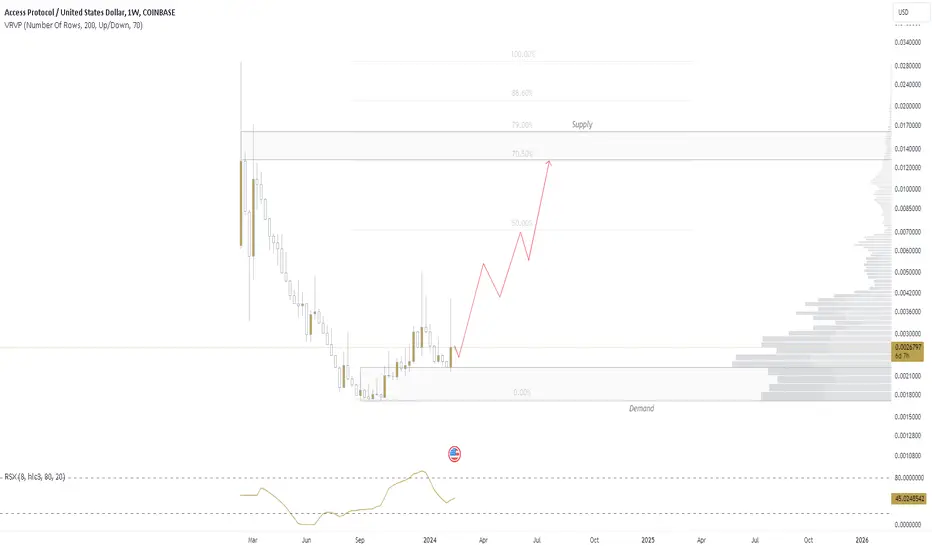
ACS- SECRET MOONBAGIf you are looking for a new moonbag in solana ecosystem,check out Access protocol..
Have some sort of partnership in creating and distributing the coingecko pass Nft.
I have a strong pre,omition that if CG decides to launch their platform token anytime in the future, ACS might have a big roll to play on it..
Its kind of token you buy and forget you did but wake up one day to see the sweel in your wallet.
Also content creators and artists friendly Nft platform
NFA..so DYOR!
FYI- If you EP in
 Long
Long Long
Long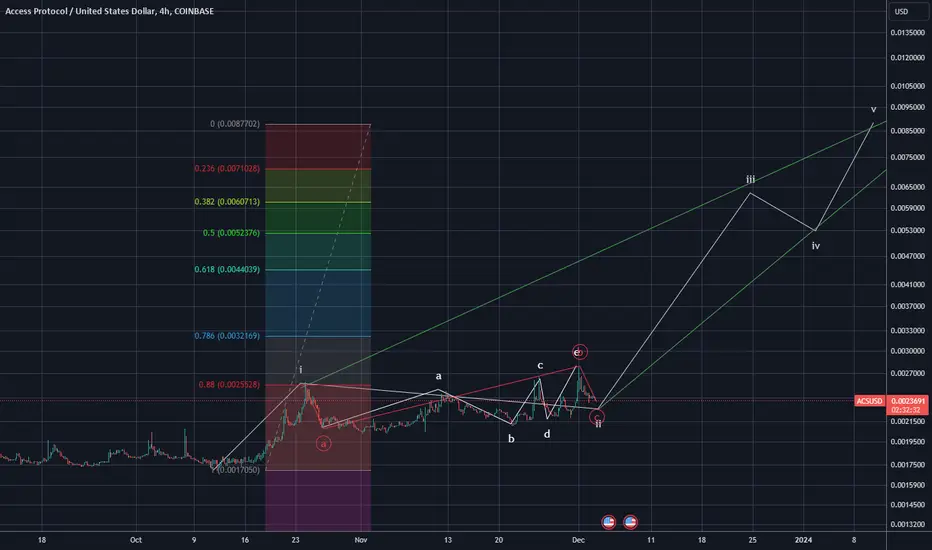
Access Price Analysis (On Phone)As you can see I used the bar pattern tool, to basically make my chart look really cool.
Besides that, I usually just allow price to react off my levels and drink a cold smoothie along the way.
Warm, warm summer, how now’s a good time for some Seltzer Martinis on an Refrigerated beach.
Nice.
Chart n Dart baby.
Chart and Dart (Race Car Emoji * Smoke Emoji* City Night Skyline Emoji)
Long
wave 3 protocol 600% extension gotta put some text in here for trading view's fascist gab police so i will keep typing till it lets me
post a simple impulse followed by a abc correction to be followed by another impulse buy low sell high
and ring the bell eat some tacos are these enough words or should i keep typing
Long
$ACS LONGACS is pushing too much for a breakout not to be coming. Flip those arrows to the bottom if the wrong breakout happens. Lol.
Long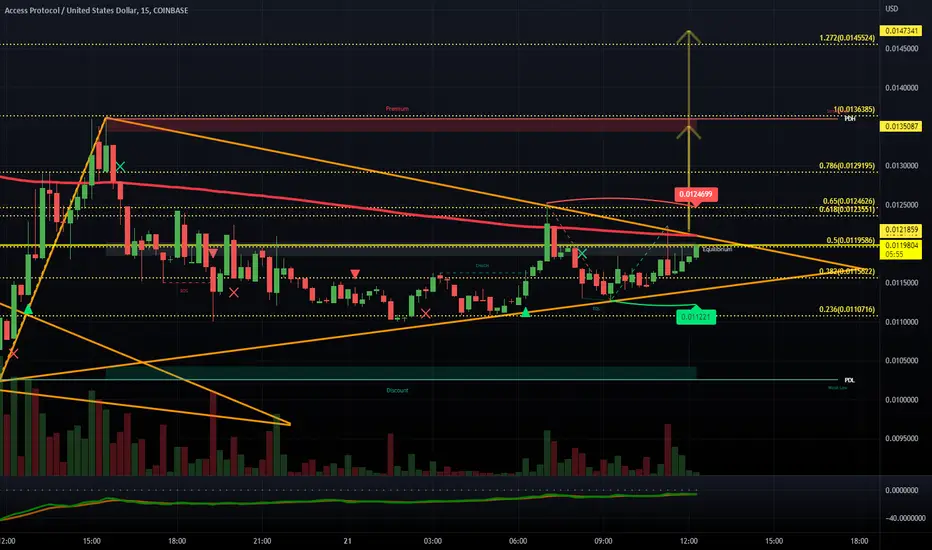
$ACS Full bart or will we find bottom? $ACS in full retreat. Is there a bottom or we going back to the start?
Short
ACS Long on BounceI do not give much value to the blue triangle. However, I do to the channel it is in. It should bounce the bottom trendline. If not, expect a big drop. Not much history to go on with this coin.
Long