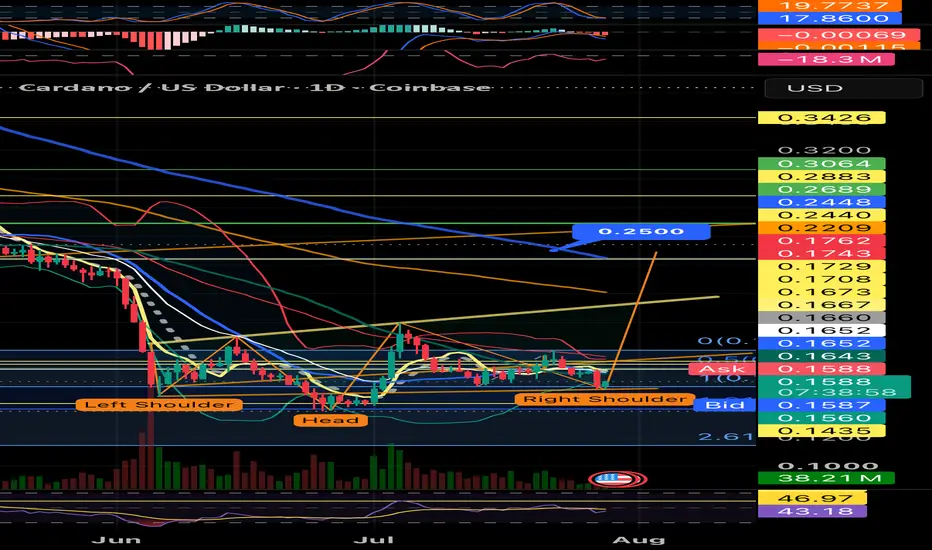
Trend reversal Inverse Head and Shoulders Elliot Wave 1?Could the bottom be in for ADA USD? It’s a high probability setup that needs confirmation by a daily close above the neckline of the Inverse Head and Shoulders. It coincides with an Elliot Wave 1 and ABC correction leading into wave 3. The RSI supports the price action.
Key stats
Details
Cardano is a proof-of-stake blockchain network which can run smart contracts and dApps on its ecosystem. Arguably the beginning of the third generation of cryptocurrency, founder Charles Hoskinson broke away from his position at Ethereum in 2015 to create what is now considered one of the more peer-assessed projects in the game. Its native token ADA (named after English mathematician Ada Lovelace) was launched in 2017 and is designed to oversee governance and encourage participation in its ecosystem.
Open interest
Liquidations
Long
Short
Price
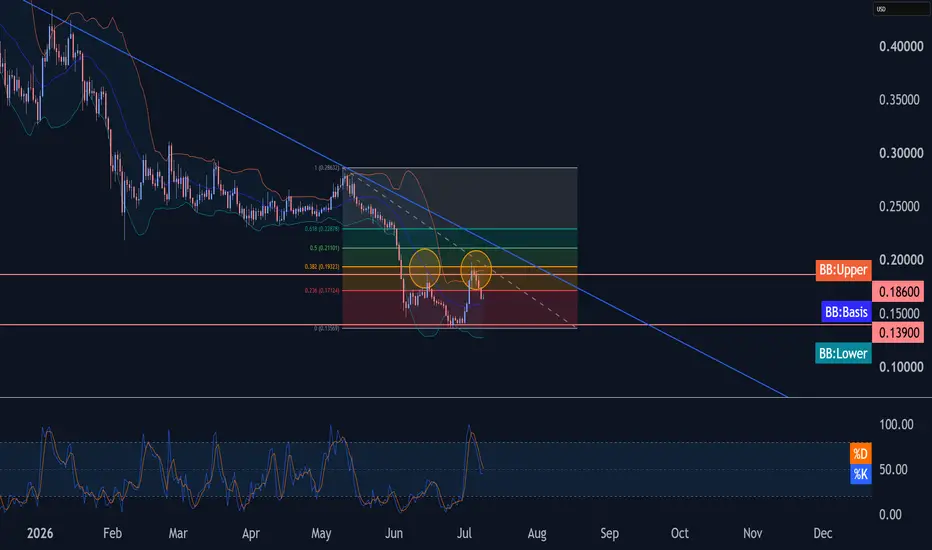
Cardano Wave Analysis – 9 July 2026- Cardano reversed from resistance zone
- Likely to fall to support level 0.139
Cardano cryptocurrency recently reversed from the resistance zone between the key resistance level 0.186 (which stopped earlier wave a), upper daily Bollinger B and 50% Fibonacci correction of the downward impulse from
CARDANO This 1D MA50 rejection can lead to $0.10Cardano (ADAUSD) has been trading within a 10-month Channel Down rejection and on Saturday it hit and got rejected on its 1D MA50 (blue trend-line) for the first time since May 17.
The main long-term Resistance is the 1W MA20 (red trend-line), which did the May 10 rejection but given the nearly ove
CARDANO DEAD OR LOST YEARS?CRYPTOCAP:ADA is not confirmed dead.
But it is clearly in the survival test. There is a big difference. Fundamentals, community, decentralization and tokenomics can help a project survive the lost years. But the chart still has to confirm that the market agrees.
And right now, the ADA chart is sh
Cardano (ADA) Testing a Multi-Year Support ZoneCardano has declined nearly 99% from its all-time high and is now trading around a major historical support zone near $0.14–0.15. This area has acted as a long-term accumulation level in previous market cycles, making it one of the most important price regions on the weekly chart.
Short-Term Outlo
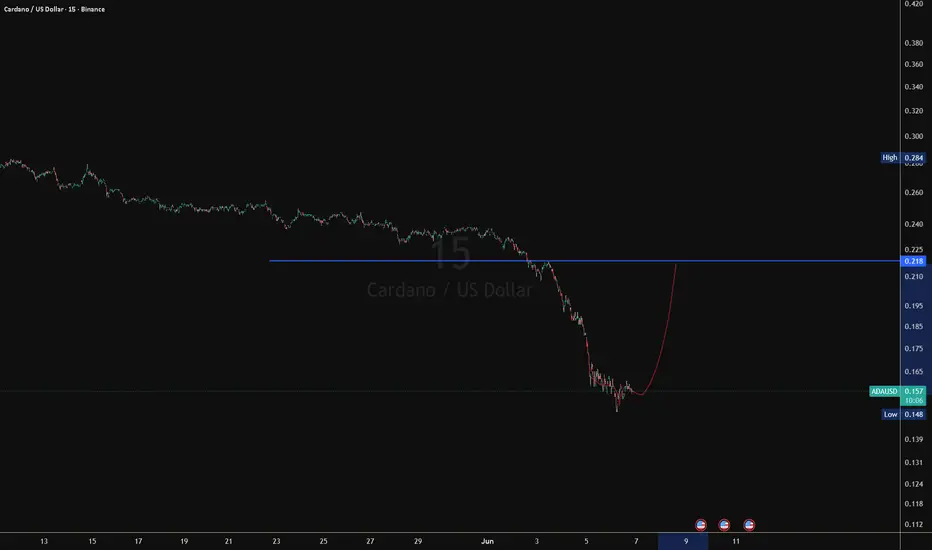
Inverse Head and ShouldersHere is what stands out on the 15-minute ADA/USDT chart
Chart Analysis: Potential Inverse Head and ShouldersFollowing a sharp, aggressive downward trend, the price is currently attempting to bottom out by forming a classic bullish reversal setup: an Inverse Head and Shoulders pattern.Breakdown of
Cardano: Target Zone Reached!ADA recently continued to pull back and, in doing so, reached our green Target Zone ($0.19–$0.12). In theory, we may even have already seen the expected low. At any rate, our primary view, is that ADA should form an interim low within our green Target Zone. After that, a rebound to the upside should
See all ideas
Displays a symbol's price movements over previous years to identify recurring trends.
Frequently asked questions
Cardano (ADA) reached its highest price on Sep 2, 2021 — it amounted to 3.0991 USD. Find more insights on the ADA price chart.
See the list of crypto gainers and choose what best fits your strategy.
Cardano (ADA) reached the lowest price of 0.1352 USD on Jun 25, 2026. View more Cardano dynamics on the price chart.
See the list of crypto losers to find unexpected opportunities.
The safest choice when buying ADA is to go to a well-known crypto exchange. Some of the popular names are Binance, Coinbase, Kraken. But you'll have to find a reliable broker and create an account first. You can trade ADA right from TradingView charts — just choose a broker and connect to your account.
You can discuss Cardano (ADA) with other users in our public chats, Minds or in the comments to Ideas.