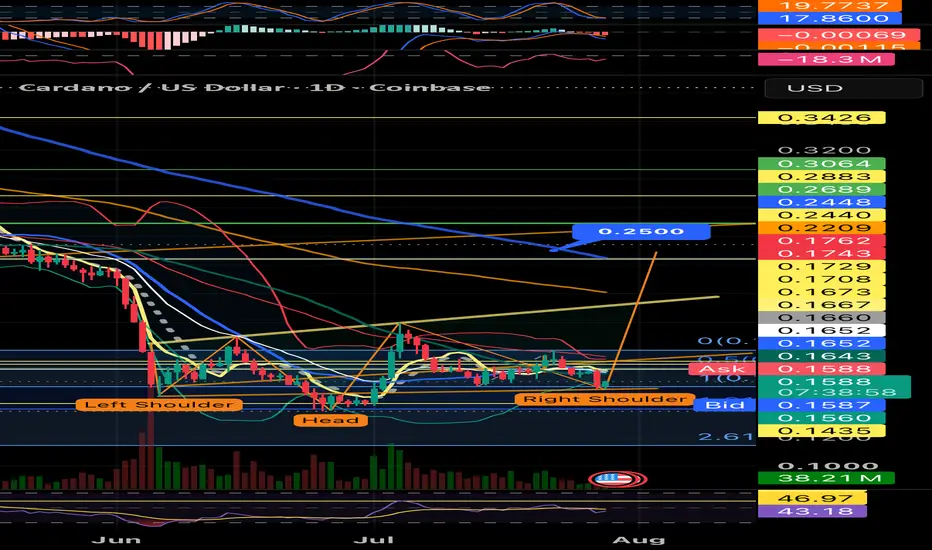
Trend reversal Inverse Head and Shoulders Elliot Wave 1?Could the bottom be in for ADA USD? It’s a high probability setup that needs confirmation by a daily close above the neckline of the Inverse Head and Shoulders. It coincides with an Elliot Wave 1 and ABC correction leading into wave 3. The RSI supports the price action.
In-depth trading ideas
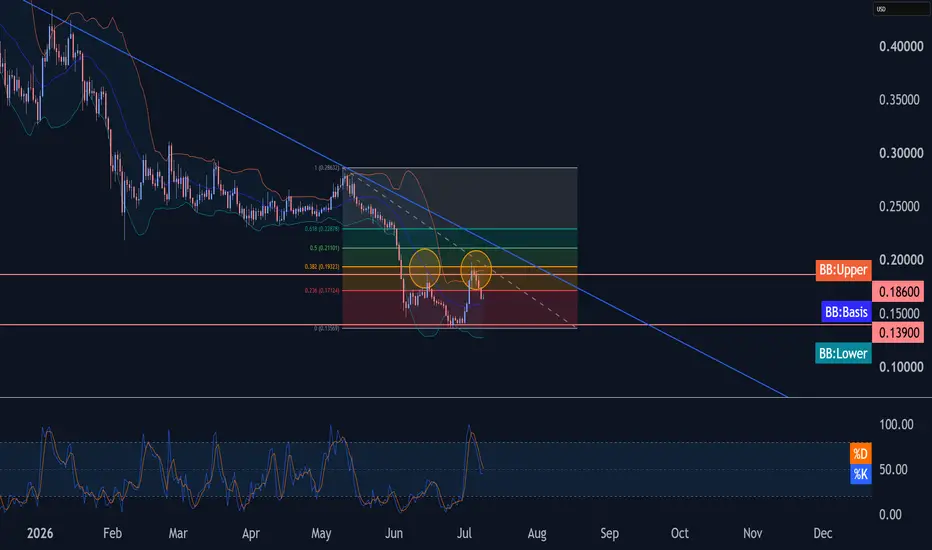
Cardano Wave Analysis – 9 July 2026- Cardano reversed from resistance zone
- Likely to fall to support level 0.139
Cardano cryptocurrency recently reversed from the resistance zone between the key resistance level 0.186 (which stopped earlier wave a), upper daily Bollinger B and 50% Fibonacci correction of the downward impulse from May.
The downward reversal from this resistance zone stopped the previous short-term ABC correction 2 from the start of June.
Given the overriding daily downtrend, Cardano cryptocurrency can be expected to fall further to the next support level 0.139 (which stopped earlier waves (3) and 1).
CARDANO This 1D MA50 rejection can lead to $0.10Cardano (ADAUSD) has been trading within a 10-month Channel Down rejection and on Saturday it hit and got rejected on its 1D MA50 (blue trend-line) for the first time since May 17.
The main long-term Resistance is the 1W MA20 (red trend-line), which did the May 10 rejection but given the nearly overbought 1D RSI, the current one may be strong enough to initiate a new Bearish Leg.
The minimum such Bearish Leg within this pattern has been -45.72%, which can pull ADA down to $0.11. Given however the increasing rate on every single Bearish Leg since the start, we expect a new decline of more then -52.27%, which leads us to assume that $0.10 will get hit on the current drop.
---
** Please LIKE 👍, FOLLOW ✅, SHARE 🙌 and COMMENT ✍ if you enjoy this idea! Also share your ideas and charts in the comments section below! This is best way to keep it relevant, support us, keep the content here free and allow the idea to reach as many people as possible. **
---
💸💸💸💸💸💸
👇 👇 👇 👇 👇 👇
CARDANO DEAD OR LOST YEARS?CRYPTOCAP:ADA is not confirmed dead.
But it is clearly in the survival test. There is a big difference. Fundamentals, community, decentralization and tokenomics can help a project survive the lost years. But the chart still has to confirm that the market agrees.
And right now, the ADA chart is showing both damage and opportunity. The damage is clear: ADA lost the 2022–2026 support zone around the red level. That was not a small event. That level had acted as an important base for years. Losing it means the old range has failed, at least temporarily.
This is why the chart looks so weak.
But the opportunity is also clear: after losing the 2022 base, ADA has now returned to the 2020 breakout / pre-2021 expansion zone. This is the same type of area where the market previously said “dead” before the asset later repriced aggressively.
That does not mean the same move must repeat.
It means the chart is now back at a historical survival zone.
This is exactly where the lost-years framework matters.
A technology asset can spend years looking finished while the underlying community, network and narrative continue to exist. But price must eventually prove survival. Belief alone is not enough.
For ADA, the current structure is simple: Below the 2022 support, the chart is damaged. At the 2020 support, the chart is testing survival. reclaim of the red zone would be the first serious sign that ADA is not only bouncing, but repairing structure. Until then, this is not a confirmed recovery. It is a historical support test. bullish case begins if ADA can hold the 2020 base and reclaim the lost 2022 range. That would suggest the market has rejected the “dead” thesis again and is trying to rebuild from an older cycle floor.
The bearish case is also simple. If ADA loses the 2020 support area and fails to reclaim it, then the structure weakens significantly. At that point, the chart would look less like lost-years survival and more like long-term breakdown. So the answer is not emotional. It is structural. Cardano may still be one of the strongest communities in crypto. It may still have long-term believers. may still have a decentralization narrative. But the chart is asking a different question:
Can ADA survive the lost years and reclaim structure? Right now, ADA is not dead. But it is at the level where survival has to be proven.
Cardano (ADA) Testing a Multi-Year Support ZoneCardano has declined nearly 99% from its all-time high and is now trading around a major historical support zone near $0.14–0.15. This area has acted as a long-term accumulation level in previous market cycles, making it one of the most important price regions on the weekly chart.
Short-Term Outlook
As long as price remains above $0.14, buyers still have an opportunity to defend the trend.
Targets: $0.20 → $0.30 → $0.45
Stop-loss: Below $0.13
Long-Term Outlook
ADA is trading near a multi-year cycle low after an extended bear market.
The current price action suggests a potential accumulation phase rather than continued aggressive selling.
If this historical support holds, Cardano could begin building the foundation for the next market cycle.
Targets: $0.60 → $1.00 → $1.50
Stop-loss: Weekly close below $0.12
Bullish Scenario 🟢
Buyers successfully defend the $0.14–0.15 support zone.
Price establishes a higher low and begins recovering.
Breaking above $0.30 would be the first major confirmation that a new bullish trend is developing.
A move above $0.60 could open the path toward the psychological $1.00 level.
Bearish Scenario 🔴
A decisive weekly breakdown below $0.14 would invalidate the current support.
Sellers could extend the decline toward $0.10 or even lower before a meaningful bottom is formed.
Losing this multi-year support would significantly weaken the long-term bullish structure.
📌 Summary
Cardano is trading at one of the most significant long-term support zones on its entire chart after losing nearly 99% from its peak. If buyers continue defending $0.14–0.15, the current area could become the foundation for a new bullish cycle with upside potential toward $0.60–1.50 over time. However, a weekly close below this support would invalidate the bullish setup and increase the risk of another leg lower before a sustainable recovery begins.
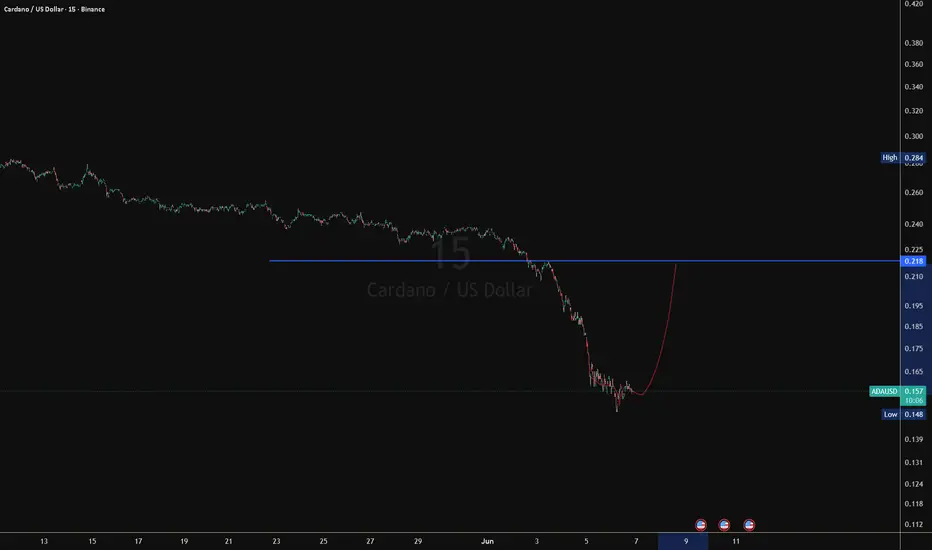
Inverse Head and ShouldersHere is what stands out on the 15-minute ADA/USDT chart
Chart Analysis: Potential Inverse Head and ShouldersFollowing a sharp, aggressive downward trend, the price is currently attempting to bottom out by forming a classic bullish reversal setup: an Inverse Head and Shoulders pattern.Breakdown of the StructureLeft Shoulder: A brief pause and stabilization point that formed in the $0.1510 - 0.1520$ zone before one final flush down.Head: The absolute capitulation low of the move, marked precisely by the blue label at 0.1486.
This drop was met with an immediate, sharp bounce back up.Right Shoulder: The price action we are seeing right now. At 0.1574, the market is carving out a vital Higher Low. This signals that sellers are losing momentum and buyers are stepping in much higher than they did at the head.
Key Levels and TargetsThe Neckline (0.1620): This is the most critical horizontal level on the chart right now. The pattern is not officially triggered until we get a clean candle close above this blue line.First Target (0.1771): A successful breakout above the neckline points directly toward the next major overhead resistance line visible at 0.1771.Major Structural Target (0.2400): If the reversal gains macro strength, the ultimate target is the 0.2400 zone, which acted as a heavy structural floor earlier on the chart before the massive sell-off.
⚠️ Quick Reality Check: Because this is an M15 (15-minute) chart, local market noise is high. It is usually safer to wait for an explicit breakout and retest of the 0.1620 level on solid volume rather than trying to front-run the right shoulder, as a drop below 0.1486 completely invalidates the pattern.
Cardano: Target Zone Reached!ADA recently continued to pull back and, in doing so, reached our green Target Zone ($0.19–$0.12). In theory, we may even have already seen the expected low. At any rate, our primary view, is that ADA should form an interim low within our green Target Zone. After that, a rebound to the upside should provide some relief before the final pullback of the ongoing downward move unfolds, still below the resistance at $0.44.
ADA | 4hr Chart
** T.A explained **
Multiple Time-Frame Analysis; Color Code | Strength favors the higher timeframe.
Yearly timeframe = black
Monthly timeframe = pink
weekly = grey
daily = red
4hr = orange
1hr = yellow
15min = blue
5min = green if they are shown. (Level visibility on intervals is set to timeframe the level was found on and below to keep chart view organized.)
Ranges defined
A Range = two or more consecutive color candles (2+ in a row, same color creates a range)
There are two types of ranges - Accumulation Ranges &
Distribution Ranges.
*A single candle is a range on a lower timeframe. Mark the candle and then find the range / level on a lower timeframe aka "Range Finding".
Some people use boxes and call this boxing finding the zone - supply & demand zones - and marking the entire range top to bottom. This is acceptable but introduces risk by increasing probability of orders getting filled.
Candle Science further defines the zone / range into levels. So. after finding a range, identify and label the first and last candle of the range.
This is Candle Science. Everything has a default expectation and users thinking is guided by IF/THEN statements.
Below are the default expectations for each range and the first and last candle within the range.
DISTRIBUTION RANGES:
When price is above a distribution range its default expectation is to support price accumulation.
The first distribution candle in a distribution range is labeled as the BackSide Candle (BS).
Expectation = strong reaction to price. Look for price action to create long wicks reaching to or away from level. A steep angle trend is expected to form so Fair Value Gaps are expected to form on the timeframe of the level and lower timeframes.
If a steep angle trend is not forming, and long wicks are not being created then the idea is that liquidity is not there, confidence in the level is low. Price Action may then be looking for more liquidity to and seek it out at the FrontSide Candle.
FrontSide (FS) Candle = The last distribution candle in a distribution range.
Expectation = create a low angle accumulation trend reversal.
3 bar reversal patterns laddering up
like the distribution candles are the rungs of an accumulation ladder. price uses the top side of the BackSide Candle or the top side of the FrontSide Candle as support. They are used in bull flags to break distribution trends.
IF price fails to gain a BackSide or FrontSide level THEN they act as RESISTANCE. But we will then train our eyes to look at the bottom side of Accumulation Ranges because they have a default expectation as Resistance.
When Price is below an accumulation candle, the bottom side of the accumulation candle is the level of resistance.
ACCUMULATION RANGES DEFINED:
Inverse BackSide Candle (Inv.BS) = the first accumulation candle in an accumulation range.
Expectation. = strong reaction to price. long wicks reaching to or away from level. Creates a steep angle distribution trend. Usually create F.V.G's and impulsive, volatile moves like the BackSide Candle.
Inverse FrontSide Candle (Inv.FS) = The last accumulation candle in an accumulation range.
Expectation = reversal, create a low angle distribution trend. The bottom side of the accumulation candles are used as resistance levels.
TOOLS USED:
Boxes - used to define a zone by marking the entire range (if its small) or just one entire candle or just the wick of the candle to define the zone.
Horizontal Ray tool - used to define the level.
levels when dashed lines are untested, active level where buyers or sellers are waiting to create a level of interest.
Tested levels are dotted lines. If used, they reference the range and could become Origin levels or R.a.t.s in the future (levels where new trends originate or where traders are using Rejection as A Target to scalp and reverse position - aka stoploss hunters; like the rats they are.
Again the color code:
Yearly timeframe color is Black
Monthly timeframe is color pink
weekly grey
daily is red
4hr is orange
1hr is yellow
15min is blue
5min is green if they are shown.
strength favors the higher timeframe.
Cardano - A Test of True Decentralization🔥 Cardano’s Drama 🔥
A Test of True Decentralization
👉 There’s been some drama surrounding Cardano lately, dApps shutting down, community unrest, and questions about leadership. But here’s the truth: I think this could actually work out in Cardano’s favor.
Charles Hoskinson himself has admitted he lacks control over the ecosystem. Projects like Minswap, SundaeSwap, and others are closing or pivoting, and the community is divided. But to me, this isn’t a sign of weakness, it’s proof of Cardano’s unmatched decentralization.
Unlike Bitcoin, where a handful of miners and whales hold disproportionate influence, Cardano’s lack of central control means no single entity, not even its founder, can dictate its future. Hoskinson’s hands-off approach, his loss of keys, and the ecosystem’s ability to self-regulate show that ADA is truly in the hands of its community.
Bitcoin will never be this decentralized. While BTC relies on a concentrated mining oligarchy, Cardano is built to evolve without a single point of failure.
So, while the short-term noise might spook some, I see this as a stress test, and Cardano is passing with flying colors. The weak projects fall, the strong adapt, and the network grows more resilient. Stay sharp, stay frosty ☃️
BITSTAMP:BTCUSD BITSTAMP:ETHUSD TVC:DXY SP:SPX TVC:GOLD TVC:SILVER NASDAQ:TLT COINBASE:ADAUSD BBG:CARDANO
Chuck's coin teetering on the brink of a dramatic plunge to 9cCardano, along with many other high market cap tokens, certainly stands out.
As we find ourselves in the crypto bear market,
I would argue that we have actually been in one for quite some time now.
The rapid declines can catch newcomers off guard.
Meanwhile, those who have weathered several cycles tend to quietly withdraw and wait for BTC to undergo its usual year-long downturn.
Will BTC hit a bottom again next November, similar to the previous four-year cycles?
The odds still seem to favor a yes.
Even with the influx of institutional capital.
This situation simply means that the OGs finally have the liquidity to cash out completely.
And they have been doing so with great intensity since the summer.
Unfortunately, altcoins do not benefit from this liquidity, and there are hardly any profitable wallets aside from those of founders and VCs who essentially created the coins or acquired them for a pittance.
Retail investors will likely bear the brunt of falling for the hype once more.
ADA/USDPrice has reached a supply zone (the orange zone) and is forming a range. On the RSI, we are also seeing divergence, and the RSI trendline has broken earlier than the price trendline — which is a good sign to confirm a drop. Now, by breaking the trendline, we can enter a sell position. The target zones are the red lines.
cardano on a spot from 2 side , long on see what technical says, this crypto ison a spotlf trendline as it is on a top side , clone of same angel , in channel going upside ,
channel going downside it it on a order block zone and now in acculation zone based on these 2 trendline spot, right now it is on a strong trendline spot , if breaks add more positions for long side ,but i think wont break
prise have also reached on nearly same sweep last time
ADAUSD support retest?ADAUSD continues to trade within the broader prevailing trend, with recent price action showing signs of a corrective pullback phase.
Key Level: 2610
This area previously acted as a consolidation zone and is currently being monitored as a notable resistance level.
Scenario Below 2610
If price remains below 2610, market structure may continue to reflect near-term downside pressure. In this context, the following levels may act as reference support areas:
2400 – Near-term support
2350 – Intermediate support
2300 – Broader support zone
Scenario Above 2610
A sustained move and daily close above 2610 would indicate a shift in the current short-term structure. In that scenario, the following levels may become relevant on the upside:
2670 – Initial resistance
2735 – Higher resistance zone
Conclusion
ADAUSD remains near an important technical area, with 2610 acting as a key reference level for the current price structure. Price behaviour around this zone may help determine whether the market continues within the recent corrective phase or transitions toward further upside continuation.
This communication is for informational purposes only and should not be viewed as any form of recommendation as to a particular course of action or as investment advice. It is not intended as an offer or solicitation for the purchase or sale of any financial instrument or as an official confirmation of any transaction. Opinions, estimates and assumptions expressed herein are made as of the date of this communication and are subject to change without notice. This communication has been prepared based upon information, including market prices, data and other information, believed to be reliable; however, Trade Nation does not warrant its completeness or accuracy. All market prices and market data contained in or attached to this communication are indicative and subject to change without notice.
ADAUSDT 4H Trading PlanADAUSDT 4H Trading Plan
Timeframe: 4-Hour
Trading Pair: ADAUSDT
Trade Direction: Long, wait for pullback to enter
Entry Zone: 0.24260
Stop Loss: 0.23676
First Target: 0.26010
Cut half position and move stop loss to protect profits.
Second Target: 0.27600
Reduce half remaining positions and adjust stop loss level.
Third Target: 0.30000
Make further position reduction and trail stop loss.
Hold the last position and follow the trend with dynamic protection.
Crypto Trading Risk Warning
Cryptocurrency trading has high volatility and huge investment risks. Market swings, liquidity differences and unexpected news may cause capital losses. Leverage will greatly enlarge risks and earnings. All plans are merely technical references, not investment suggestions. Please keep strict risk control and trade at your own discretion.
ADAUSD Bearish continuation, resistance at 2840The ADAUSD pair continues to display a bearish outlook, in line with the prevailing downward trend. Recent price action suggests an oversold bounce back, potentially setting up for another move lower if resistance holds.
Key Level: 2840
This zone, previously a consolidation area, now acts as a significant resistance level.
A failed test and rejection at 2840 would likely resume the bearish momentum.
Downside targets include:
2545 – Initial support
2460 – Intermediate support
2375 – Longer-term support level
Bullish Scenario (breakout above 2840):
A confirmed breakout and daily close above 2840 would invalidate the bearish setup.
In that case, potential upside resistance levels are:
2907 – First resistance
2960 – Further upside target
Conclusion
ADAUSD remains under bearish pressure, with the 2840 level acting as a key inflection point. As long as the price remains below this level, the bias favours further downside. Traders should watch for price confirmation around that level to assess the next move.
This communication is for informational purposes only and should not be viewed as any form of recommendation as to a particular course of action or as investment advice. It is not intended as an offer or solicitation for the purchase or sale of any financial instrument or as an official confirmation of any transaction. Opinions, estimates and assumptions expressed herein are made as of the date of this communication and are subject to change without notice. This communication has been prepared based upon information, including market prices, data and other information, believed to be reliable; however, Trade Nation does not warrant its completeness or accuracy. All market prices and market data contained in or attached to this communication are indicative and subject to change without notice.
Cardano (ADA) Long looking extremely bullish on the monthlyCardano is at heavy support zone looking for a pop to the upside CAPITALCOM:ADAUSD
I can see a retirement to the .5 and .786 retracement if Bitcoin pushes higher.
Im going to spot hold ADA at the least a pop too the downward trend line incoming.
ADA | Week 20 | 1hr chart ** T.A explained **
Multiple Time-Frame Analysis; Color Code:
Strength favors the higher timeframe.
Yearly timeframe = black
Monthly timeframe = pink
weekly = grey
daily = red
4hr = orange
1hr = yellow
15min = blue
5min = green if they are shown. (Level visibility on intervals is set to timeframe the level was found on and below to keep chart view organized.)
Ranges defined
A Range = two or more consecutive color candles (2+ in a row, same color creates a range)
There are two types of ranges - Accumulation Ranges &
Distribution Ranges.
*A single candle is a range on a lower timeframe. Mark the candle and then find the range / level on a lower timeframe aka "Range Finding".
Some people use boxes and call this boxing finding the zone - supply & demand zones - and marking the entire range top to bottom. This is acceptable but introduces risk by increasing probability of orders getting filled.
Candle Science further defines the zone / range into levels. So. after finding a range, identify and label the first and last candle of the range.
This is Candle Science. Everything has a default expectation and users thinking is guided by IF/THEN statements.
Below are the default expectations for each range and the first and last candle within the range.
DISTRIBUTION RANGES:
When price is above a distribution range its default expectation is to support price accumulation.
The first distribution candle in a distribution range is labeled as the BackSide Candle (BS).
Expectation = strong reaction to price. Look for price action to create long wicks reaching to or away from level. A steep angle trend is expected to form so Fair Value Gaps are expected to form on the timeframe of the level and lower timeframes.
If a steep angle trend is not forming, and long wicks are not being created then the idea is that liquidity is not there, confidence in the level is low. Price Action may then be looking for more liquidity to and seek it out at the FrontSide Candle.
FrontSide (FS) Candle = The last distribution candle in a distribution range.
Expectation = create a low angle accumulation trend reversal.
3 bar reversal patterns laddering up
like the distribution candles are the rungs of an accumulation ladder. price uses the top side of the BackSide Candle or the top side of the FrontSide Candle as support. They are used in bull flags to break distribution trends.
IF price fails to gain a BackSide or FrontSide level THEN they act as RESISTANCE. But we will then train our eyes to look at the bottom side of Accumulation Ranges because they have a default expectation as Resistance.
When Price is below an accumulation candle, the bottom side of the accumulation candle is the level of resistance.
ACCUMULATION RANGES DEFINED:
Inverse BackSide Candle (Inv.BS) = the first accumulation candle in an accumulation range.
Expectation. = strong reaction to price. long wicks reaching to or away from level. Creates a steep angle distribution trend. Usually create F.V.G's and impulsive, volatile moves like the BackSide Candle.
Inverse FrontSide Candle (Inv.FS) = The last accumulation candle in an accumulation range.
Expectation = reversal, create a low angle distribution trend. The bottom side of the accumulation candles are used as resistance levels.
TOOLS USED:
Boxes - used to define a zone by marking the entire range (if its small) or just one entire candle or just the wick of the candle to define the zone.
Horizontal Ray tool - used to define the level.
levels when dashed lines are untested, active level where buyers or sellers are waiting to create a level of interest.
Tested levels are dotted lines. If used, they reference the range and could become Origin levels or R.a.t.s in the future (levels where new trends originate or where traders are using Rejection as A Target to scalp and reverse position - aka stoploss hunters; like the rats they are.
Again the color code:
Yearly timeframe color is Black
Monthly timeframe is color pink
weekly grey
daily is red
4hr is orange
1hr is yellow
15min is blue
5min is green if they are shown.
strength favors the higher timeframe.
ADAUSD oversold bounce back resistance at 2840The ADAUSD pair continues to display a bearish outlook, in line with the prevailing downward trend. Recent price action suggests an oversold bounce back, potentially setting up for another move lower if resistance holds.
Key Level: 2840
This zone, previously a consolidation area, now acts as a significant resistance level.
A failed test and rejection at 2840 would likely resume the bearish momentum.
Downside targets include:
2545 – Initial support
2460 – Intermediate support
2375 – Longer-term support level
Bullish Scenario (breakout above 2840):
A confirmed breakout and daily close above 2840 would invalidate the bearish setup.
In that case, potential upside resistance levels are:
2907 – First resistance
2960 – Further upside target
Conclusion
ADAUSD remains under bearish pressure, with the 2840 level acting as a key inflection point. As long as the price remains below this level, the bias favours further downside. Traders should watch for price confirmation around that level to assess the next move.
This communication is for informational purposes only and should not be viewed as any form of recommendation as to a particular course of action or as investment advice. It is not intended as an offer or solicitation for the purchase or sale of any financial instrument or as an official confirmation of any transaction. Opinions, estimates and assumptions expressed herein are made as of the date of this communication and are subject to change without notice. This communication has been prepared based upon information, including market prices, data and other information, believed to be reliable; however, Trade Nation does not warrant its completeness or accuracy. All market prices and market data contained in or attached to this communication are indicative and subject to change without notice.
ADAUSD; Heikin Ashi Trade Idea📈 Hey Traders!
Here’s a fresh outlook from my trading desk. If you’ve been following me for a while, you already know my approach:
🧩 I trade Supply & Demand zones using Heikin Ashi chart on the 4H timeframe.
🧠 I keep it mechanical and clean — no messy charts, no guessing games.
❌ No trendlines, no fixed sessions, no patterns, no indicator overload.
❌ No overanalyzing the market
❌ No scalping, and no need to be glued to the screen.
✅ I trade exclusively with limit orders, so it’s more of a set-and-forget style.
✅ This means more freedom, less screen time, and a focus on quality setups.
✅ Just a simplified, structured plan and a calm mindset.
💬 Let’s Talk:
💡Do you trade supply & demand too ?
💡What’s your go-to timeframe ?
💡Ever tried Heikin Ashi ?
📩 Got questions about my strategy or setup? Drop them below — ask me anything, I’m here to share.
Let’s grow together and keep it simple. 👊