Cardano Bullish RetestCardano is currently trading around a key daily support level after briefly deviating below the established range low. This type of price action is often viewed as a bullish deviation, where liquidity is swept beneath support before buyers step back into the market. The strong reaction from this reg
Compare with ADA/UST
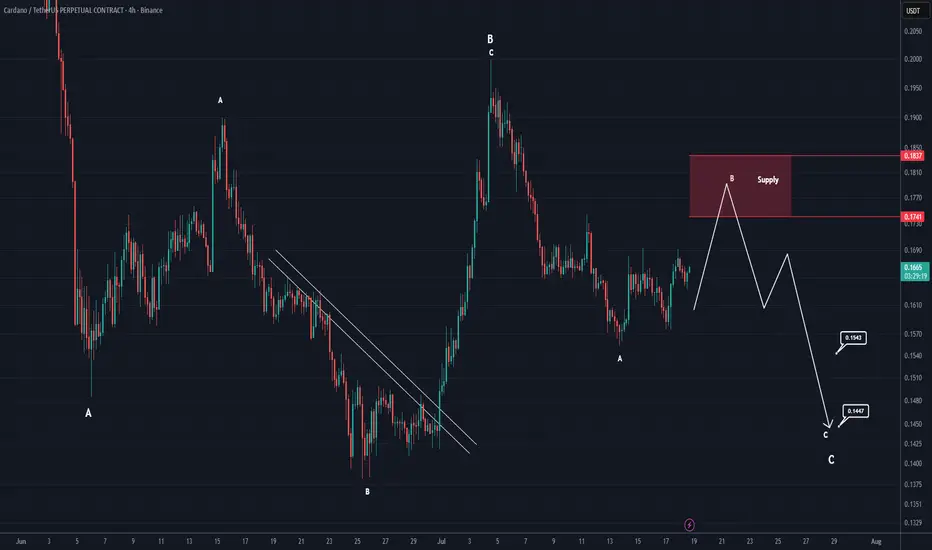
ADA is still trading within a complex corrective pattern (4H)Cardano is still trading within a complex corrective pattern. The recent decline appears to have formed Wave A, followed by the completion of Wave B. The price now seems to be developing the lower-degree Wave C, which is expected to be bearish.
It is worth noting that the higher time frame trend re
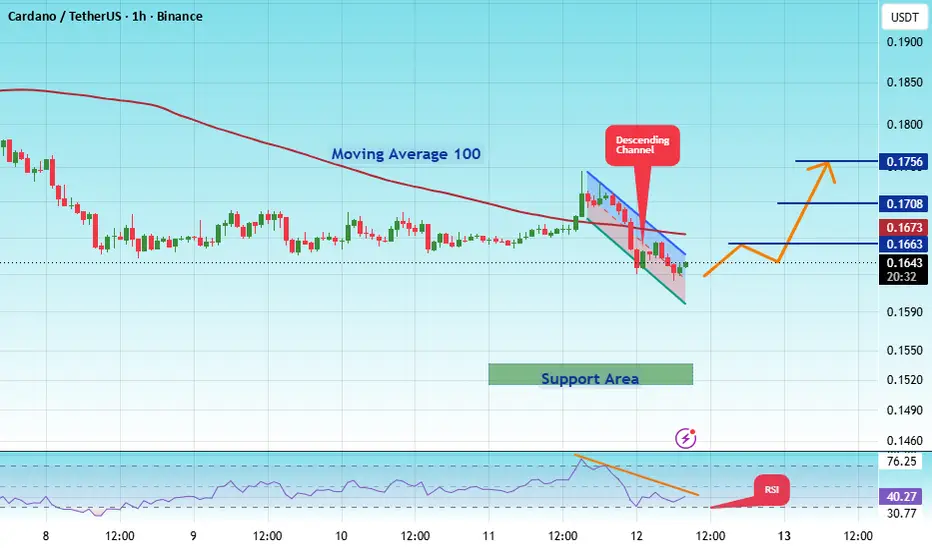
#ADAUSDT 1 H Spot LONG#ADA
The price is moving within a descending channel on the 1-hour timeframe and has reached the lower boundary. It is now poised for a bounce and is expected to retest this boundary.
The Relative Strength Index (RSI) indicates a downward trend, which is likely to continue given the overbought con
NeuPortal | ADA - dip below the core, then a three-week climbThe view: a drop through the lower edge of the measured zone first, then a sustained climb that runs well past the horizon this band actually covers. Both halves of that sentence matter.
MEASURED, 24-bar horizon (about four days on this 4H chart):
Median 0.1551
Core 50% 0.1486 - 0.1625
Wide
ADA: Buying the FOMC PullbackToday's FOMC decision injected volatility across both traditional and crypto markets, triggering a broad pullback shortly after the announcement.
Rather than viewing this reaction as a reason to panic, I saw it as an opportunity.
I decided to initiate a long position in **Cardano (ADA)**, not beca
ADA Analyses-13, [July 21, 2026]Welcome to my page! I share daily technical analyses of crypto assets and other charts here.
BINANCE:ADAUSDT
💡Market Analysis:
ADA has broken above the descending trendline and key resistance level with a strong bullish momentum candle. A successful retest of this key level will confirm the co
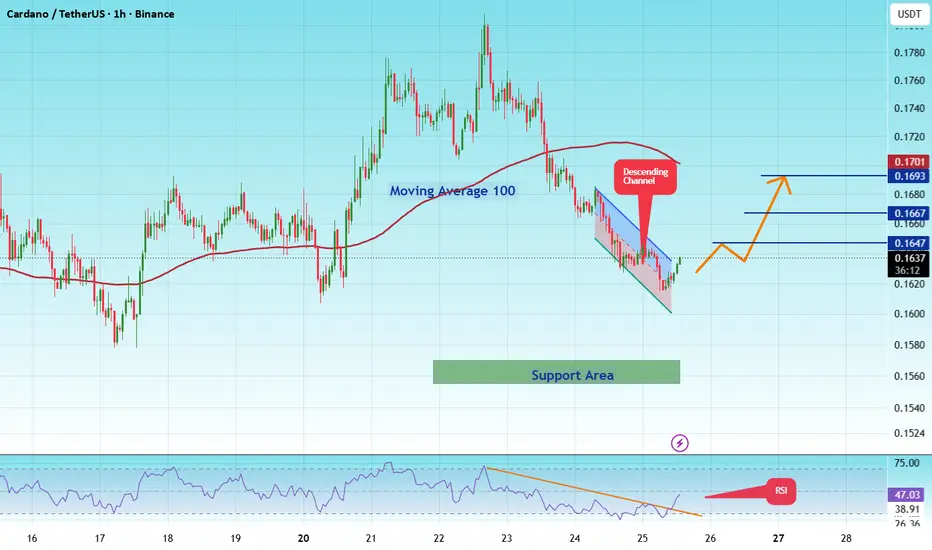
#ADAUSDT 1 H Spot LONG#ADA
The price is moving within a descending channel on the 1-hour timeframe and has reached the lower boundary. It is now poised for a bounce and is expected to retest this boundary.
The Relative Strength Index (RSI) indicates a downward trend, which is likely to continue given the overbought con
#ADAUSDT 1 H Spot LONG#ADA
The price is moving within a descending channel on the 1-hour timeframe and has reached the lower boundary. It is now poised for a bounce and is expected to retest this boundary.
The Relative Strength Index (RSI) indicates a downward trend, which is likely to continue given the overbought con
FOX Journal #13 | ADAUSDT.PAnother trade added to the FOX Journal.
Every position documented here reflects the same approach: patience, discipline, and consistent execution based on objective market structure.
The goal of this journal isn't to showcase individual winners or losers. It's to document the journey, refine the m
ADA: local squeeze with $0.2109 destinationThe Macro Picture 🗺️
ADA unwound from the $0.2886 macro ceiling into a summer base and has reclaimed $0.1743, holding above the $0.1484 local low. Price is rotating in the middle of the range with the floor intact — a base rebuilding, not a breakdown.
The Setup ⚙️
The Range Floor 🟢
$0.1484 (Local
See all ideas
Summarizing what the indicators are suggesting.
Oscillators
Neutral
SellBuy
Strong sellStrong buy
Strong sellSellNeutralBuyStrong buy
Oscillators
Neutral
SellBuy
Strong sellStrong buy
Strong sellSellNeutralBuyStrong buy
Summary
Neutral
SellBuy
Strong sellStrong buy
Strong sellSellNeutralBuyStrong buy
Summary
Neutral
SellBuy
Strong sellStrong buy
Strong sellSellNeutralBuyStrong buy
Summary
Neutral
SellBuy
Strong sellStrong buy
Strong sellSellNeutralBuyStrong buy
Moving Averages
Neutral
SellBuy
Strong sellStrong buy
Strong sellSellNeutralBuyStrong buy
Moving Averages
Neutral
SellBuy
Strong sellStrong buy
Strong sellSellNeutralBuyStrong buy
Displays a symbol's price movements over previous years to identify recurring trends.
Frequently asked questions
The current price of ADA / UST (ADA) is 0.16870000 USDT — it has risen 2.25% in the past 24 hours. Try placing this info into the context by checking out what coins are also gaining and losing at the moment and seeing ADA price chart.
ADA / UST price has fallen by −4.82% over the last week, its month performance shows a 14.02% increase, and as for the last year, ADA / UST has decreased by −77.86%. See more dynamics on ADA price chart.
Keep track of coins' changes with our Crypto Coins Heatmap.
ADA / UST (ADA) reached its highest price on Sep 2, 2021 — it amounted to 3.09890000 USDT. Find more insights on the ADA price chart.
See the list of crypto gainers and choose what best fits your strategy.
ADA / UST (ADA) reached the lowest price of 0.07578100 USDT on Sep 23, 2020. View more ADA / UST dynamics on the price chart.
See the list of crypto losers to find unexpected opportunities.
The safest choice when buying ADA is to go to a well-known crypto exchange. Some of the popular names are Binance, Coinbase, Kraken. But you'll have to find a reliable broker and create an account first. You can trade ADA right from TradingView charts — just choose a broker and connect to your account.
Crypto markets are famous for their volatility, so one should study all the available stats before adding crypto assets to their portfolio. Very often it's technical analysis that comes in handy. We prepared technical ratings for ADA / UST (ADA): today its technical analysis shows the neutral signal, and according to the 1 week rating ADA shows the sell signal. And you'd better dig deeper and study 1 month rating too — it's sell. Find inspiration in ADA / UST trading ideas and keep track of what's moving crypto markets with our crypto news feed.
ADA / UST (ADA) is just as reliable as any other crypto asset — this corner of the world market is highly volatile. Today, for instance, ADA / UST is estimated as 1.64% volatile. The only thing it means is that you must prepare and examine all available information before making a decision.
You can discuss ADA / UST (ADA) with other users in our public chats, Minds or in the comments to Ideas.