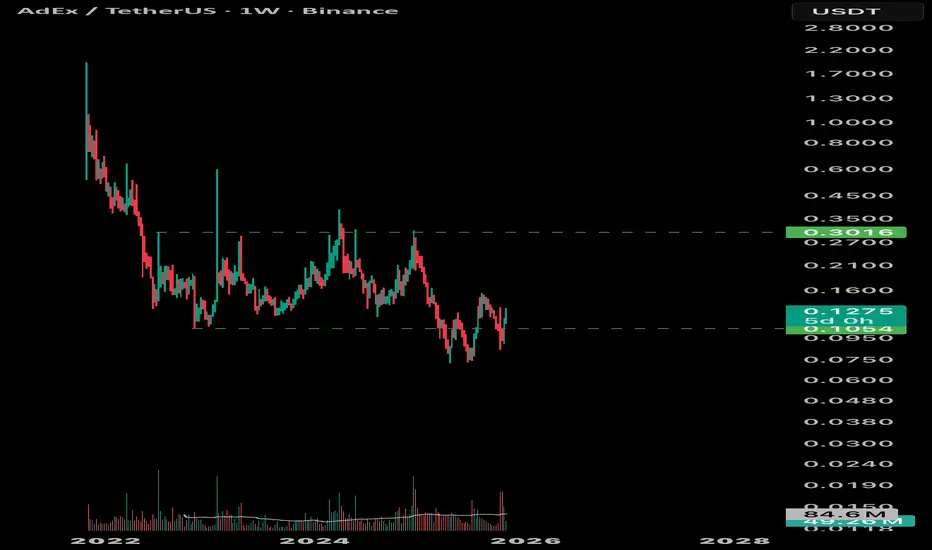
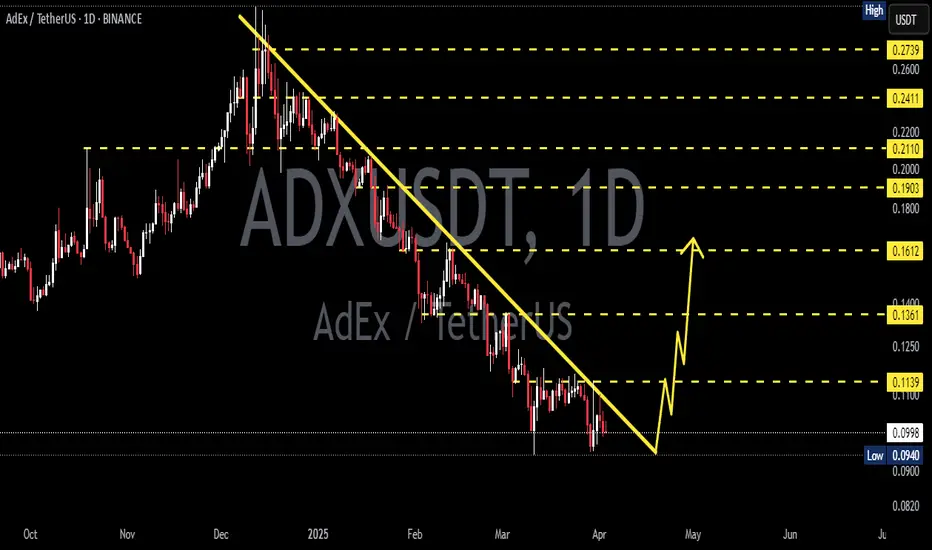
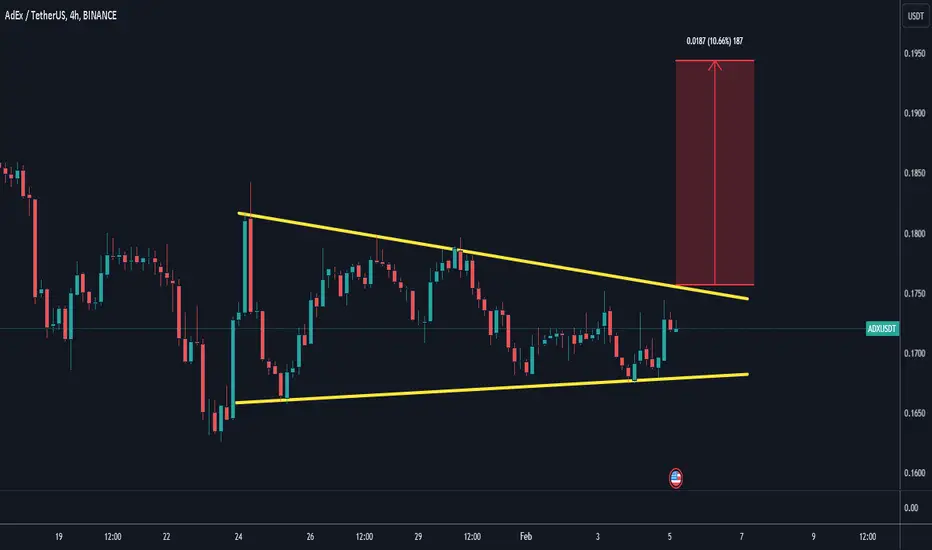
adx on verge of solid breakout ADX/USDT is showing a strong technical setup as price attempts to break above the descending trendline and key horizontal resistance zone. At the same time, the Quarterly Pivot Point is being broken, creating a strong confluence of bullish signals. If ADX confirms and sustains this breakout, it could trigger fresh buying pressure and a strong recovery in the coming days. Overall, this is a high-confluence breakout setup that could lead to a significant bullish move if successfully confirmed.
Ambire AdEx / Tether US
No trades
No trades
In-depth trading ideas
AdEx (ADX) · Experience leads to success · The daily grindAnybody that has been around long enough knows the potential of the market, you've seen it in action, and it happens over and over and over.
There is always a new sector that is growing, there is always a different sector that is growing; there is always growth.
I know opportunities are always present, here and there. Several times per year, opportunities are available everywhere.
How you approach the market can never be the same way in which I approach it. We have different backgrounds, different cultures, different lives, different likings, trading style, risk tolerance, access to certain pairs, etc.
A strategy needs to be developed to match my own individual circumstances.
I see all these opportunities and I make a plan that will work for me. It might work for you, but as soon as you implement it you will find things that you better not do, or aspects of the plan that can be improved and so on. As you do this, you end up with your own strategy.
The strategy can be something as simple as buying $2,000 of any an all projects with huge potential for growth, even if this means holding 100 coins long-term. Each time one moves, I get paid.
A strategy can be one single project, tracking the waves. Whenever support is reached, I buy also placing a long. Whenever resistance hits, I take profits and sell-short and so on.
The strategy can be mixed, can be done with bots, automated, live, long-term, short-term and so on. It all depends on you...
When the market is trending, it makes it that much easier to enter the market and trade. When the market isn't trending, we can focus on other areas of life, like personal growth, health, meditation and education. Between these we move back and forth.
The most important part is to read daily in order to grasp the market pulse. Not taking action, reading every single day. When you know everything that is happening always by looking at hundreds of projects, the opportunity and perfect timing will present itself.
You can never go wrong. There can be mistakes or a streak of sustained losses, but never a wrong approach.
Whatever we are doing, is the preparation for future success. If results are not good now, we will undoubtedly learn from everything that has taken place. Once the experiences are processed and digested, we perform better on the next trade.
Little by little, step by step, that's the way to win. Instead of one big win, a jackpot; daily improvements long-term.
In this way there is no way to crash. Wherever you are, that's where you belong. You got there through effort and hard work, not a lucky jump.
Namaste.
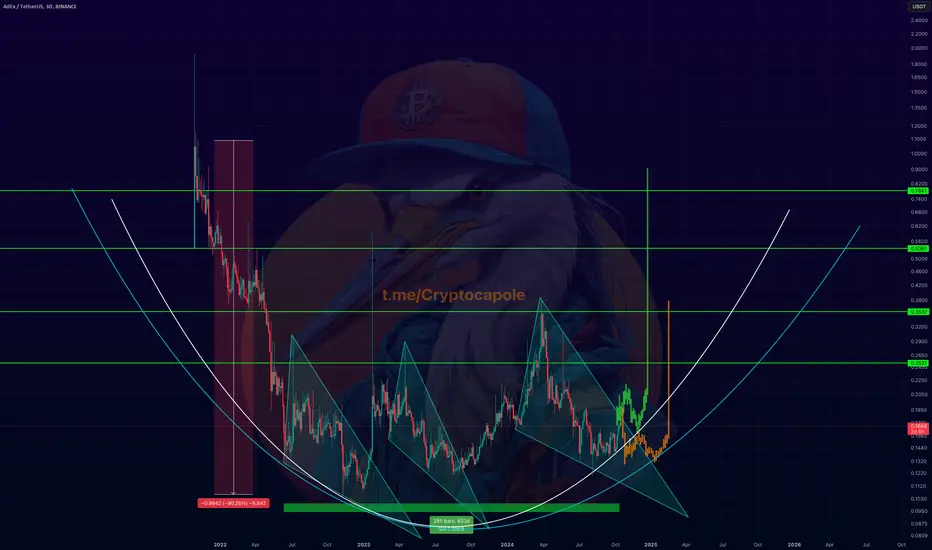
AdEx is ready to take off AdEx (ADX) has completed its Wyckoff accumulation phase, confirming a fully developed Spring (false breakout). The move was validated by the formation of a double-bottom pattern, highlighting the strength of the underlying base.
The structure suggests a strong upside breakout is imminent, with a potential rally exceeding +200% as buying momentum and liquidity expansion continue to build.
ADXUSDT 1D#ADX is moving inside a symmetrical triangle on the daily chart. In case of a breakout above the triangle resistance and the SMA100, the potential targets are:
🎯 $0.1230
🎯 $0.1386
🎯 $0.1542
🎯 $0.1764
🎯 $0.2047
⚠️ Always remember to use a tight stop-loss and maintain proper risk management.
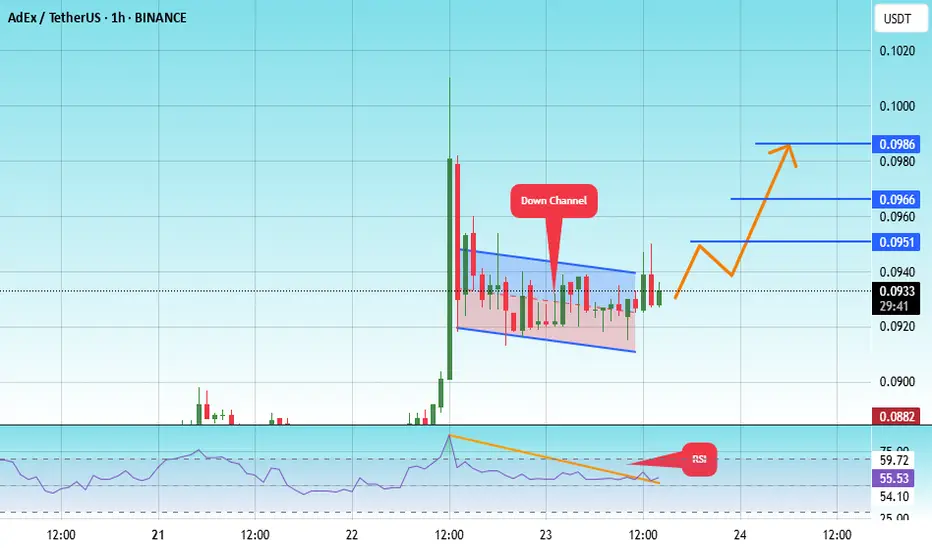
#ADX/USDT#ADX
The price is moving within a descending channel on the 1-hour frame, adhering well to it, and is heading for a strong breakout and retest.
We are seeing a bounce from the lower boundary of the descending channel, which is support at 0.0914.
We have a downtrend on the RSI indicator that is about to break and retest, supporting the upward trend.
We are looking for stability above the 100 moving average.
Entry price: 0.0935
First target: 0.0951
Second target: 0.0966
Third target: 0.0986
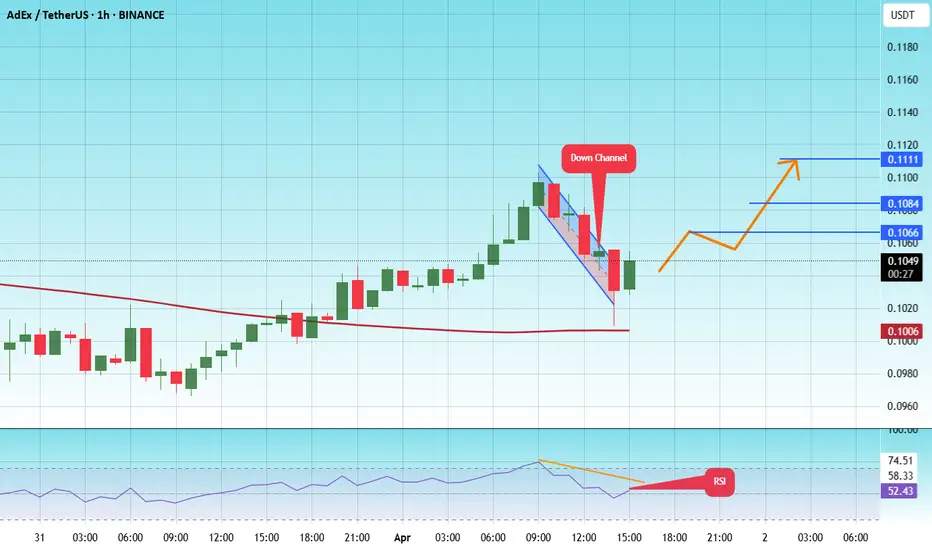
#ADEX/USDT#ADEX
The price is moving in a descending channel on the 1-hour frame and is expected to continue upward.
We have a trend to stabilize above the 100 moving average once again.
We have a downtrend on the RSI indicator that supports the upward move with a breakout.
We have a support area at the lower boundary of the channel at 0.1006.
Entry price: 0.1050
First target: 0.1066
Second target: 0.1084
Third target: 0.1111
ADXUSDT UPDATE
Pattern: Falling Wedge Breakout
Current Price: \$0.0971
Target Price: \$0.1300
Target % Gain: 55.44%
Technical Analysis: ADX has broken out of a falling wedge pattern on the 12H chart with strong bullish momentum and a clear breakout candle. Volume surge confirms the breakout.
Time Frame: 12H
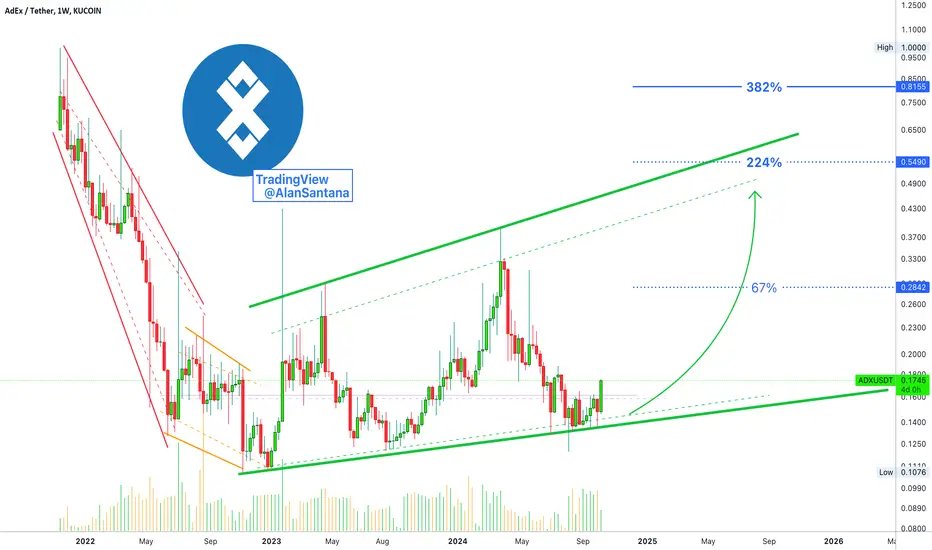
AdEx Is Ready To Grow (Long-Term Bullish, Since 2022)AdEx (ADXUSDT) bottomed November 2022, almost two years ago. We've been seeing bullish action within a widening ascending channel. When the upper boundary of the channel is challenged we get a correction; when the lower boundary of the channel is tested we get a bullish wave. There is reason to belief that this pattern will continue to repeat and it is repeating now as ADXUSDT goes bullish.
We have a very strong higher low in August 2024 compared to late 2022. The session that produced the higher low closed as hammer, which signals the end of a tend and thus a reversal. This signal is being confirmed with a full green candle now and a move above local resistance as well as a long-term resistance line.
So the doors are open for growth. The chart is bullish and pointing up. We follow the chart.
Of course, you can find ADXBTC by looking at the 'Related publications' below.
Thank you for reading.
Namaste.
ADXThe chart displays AdEx (ADX) paired with USDT on a 1-hour timeframe. The price has experienced a recent breakout from a consolidation range and is currently trading at 0.1818 USDT, just above a previous resistance level. The breakout suggests potential bullish momentum, and if the price sustains above 0.1820, it could signal further upside. A target around 0.2000 USDT is reasonable, while a stop-loss could be placed below 0.1730 USDT to manage downside risk. This setup suggests a favorable risk-to-reward ratio for a long position, but confirmation of momentum is key for entry
AdEx (ADX)After a significant correction of approximately 50%, price action has now confirmed support on past resistance as shown on the above weekly chart. This development suggests a potential reversal is underway, offering an attractive buying opportunity.
In addition to the confirmation of support you will notice price action prints a higher low in tandem with lower low in stochastic RSI. This is hidden bullish divergence. There is no chart pattern to indicate a target.
Is it possible price action may correct further? Sure.
Is it probable? No.
Ww
Type: trade
Risk: <= 2%
Timeframe to act: Days
Return: N/A
✴️ AdEx Classic Price Action (Low + Consolidation = Bullish)This is a repeating pattern across the market and between cycles, let's see what we have here.
(1) AdEx (ADXUSDT) goes on to produce a "bottom low" in November 2022 leading to the formation of a consolidation pattern. Afterward a bullish wave develops.
(2) AdEx goes again and hits a correction low ("higher low" on the chart) which starts the formation of a new consolidation pattern.
We can expect a bullish break of this pattern; Once the consolidation is over growth follows, like clockwork.
Namaste.
ADX Lights the Path: Get In on the Buy Action Today## ADX Coin: Short Fundamentals, Recent News, and Disclaimer
**Fundamentals:**
* **AdEx (ADX):** A decentralized advertising protocol aiming to improve transparency and efficiency in online advertising.
* **Launched:** December 2017.
* **Market Cap:** ~$33 million (as of Mar 3, 2024).
* **Rank:** #724 on CoinMarketCap.
* **Unique Features:**
* **Focuses on Web3 advertising:** Connects Web3 projects with potential crypto users.
* **Reduces fees:** Offers lower fees compared to traditional ad platforms.
* **Utilizes blockchain:** Enables transparent and fraud-protected advertising.
**Recent News:**
* **Feb 23, 2024:** AdEx announces integration with fiat and stablecoin deposits for campaign budgets.
* **Feb 15, 2024:** AdEx releases update on its staking program, offering rewards for token holders.
* **Jan 31, 2024:** AdEx participates in industry conferences, raising awareness of its Web3 advertising solutions.
**Disclaimer:**
* This information is for educational purposes only and should not be considered financial advice.
* Cryptocurrency investments are highly volatile and carry significant risks.
* Do your own research before making any investment decisions.
**Additional Notes:**
* ADX price has shown moderate growth in recent weeks, potentially reflecting growing interest in Web3 advertising.
* The recent news highlights AdEx's focus on expanding its user base and functionalities.
* It's crucial to understand the risks involved in cryptocurrency investments before making any decisions.
I hope this information is helpful! Please let me know if you have any other questions.
ADXUSDT - BULLISH OUTLOOKADXUSDT is currently exhibiting a bullish divergence on the 1-hour (1H) time frame, signaling a potential reversal in the prevailing trend. The price has successfully broken above the last lower high and is now establishing higher highs and higher lows, indicative of a likely continuation of the bullish trend.
Here's a concise technical analysis with a suggested trading strategy:
Entry: Consider initiating a long position on a retracement at key Fibonacci levels, specifically targeting the 0.382 or 0.50 Fibonacci retracement levels, with an entry price of around 0.1770.
Stop Loss (SL): Place a stop loss order at 0.1680 to effectively manage risk.
Take Profit (TP): Set take-profit levels to achieve a 1:1 and 1:2 risk-reward ratio:
TP1 = 0.1860
TP2 = 0.1950
This trading strategy is designed to capitalize on the anticipated continuation of the bullish trend, utilizing Fibonacci retracement levels as potential entry points. It's essential to closely monitor the market for any shifts in price dynamics and be prepared to adjust the strategy accordingly