#AEVO/USDT — Accumulation at Key Zone: Breakout or Breakdown?#AEVO
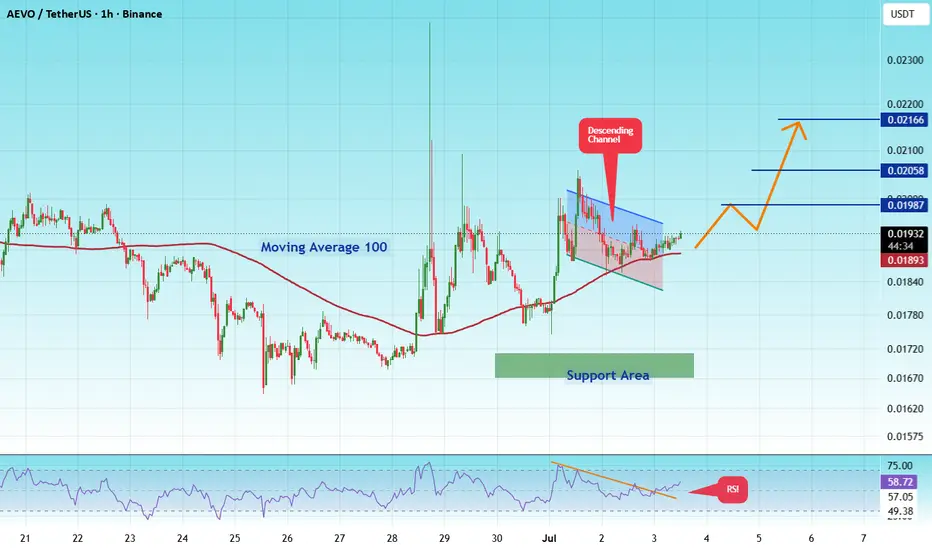
The price is moving within a descending channel on the 1-hour timeframe and has reached the lower boundary. It is now poised for a bounce and is expected to retest this boundary.
The Relative Strength Index (RSI) indicates a downward trend, which is likely to continue given the overbought conditions.
A key support zone has been identified in green at 0.01680. The price has bounced off this zone several times, making it a strong support level.
The price is trending towards the 100-period moving average, which we are approaching. This trend supports an upward move.
Entry Price: 0.01934
Target 1: 0.01987
Target 2: 0.02058
Target 3: 0.02166
You can close at the second target or wait for the third target to be reached. The choice is yours.
Stop Loss: At the resistance zone in green.
Remember this simple rule: Money Management.
Any questions? Please leave a comment.
Thank you.
In-depth trading ideas
AEVOUSDT 1D#AEVO is moving inside a falling wedge pattern on the daily chart. It has bounced off the wedge support, and volume has picked up, making the structure look promising.
In case of a breakout above the wedge resistance, the potential upside targets are:
🎯 $0.02310
🎯 $0.02603
🎯 $0.02887
🎯 $0.03171
🎯 $0.03575
🎯 $0.04090
⚠️ Always remember to use a tight stop-loss and maintain proper risk management.
AEVOUSDT Forming Falling WedgeAEVOUSDT is forming a clear falling wedge pattern, a classic bullish wave signal that often indicates an upcoming breakout. The price has been consolidating within a narrowing range, suggesting that selling pressure is weakening while buyers are beginning to regain control. With consistent volume confirming accumulation at lower levels, the setup hints at a potential bullish breakout soon. The projected move could lead to an impressive gain of around 90% to 100% once the price breaks above the wedge resistance.
This falling wedge pattern is typically seen at the end of downtrends or corrective phases, and it represents a potential shift in market sentiment from bearish to bullish. Traders closely watching AEVOUSDT are noting the strengthening momentum as it nears a breakout zone. Strong trading volume adds confidence to this pattern, showing that market participants are positioning early in anticipation of a reversal.
Investors’ growing interest in AEVOUSDT reflects rising confidence in the project's long-term fundamentals and current technical strength. If the breakout confirms with sustained volume, this could mark the start of a fresh bullish leg. The ongoing accumulation phase suggests that buyers are steadily gaining control, while weakening selling pressure creates favorable conditions for a sustained upward move.
Traders might find this a valuable setup for medium-term gains, especially as the falling wedge pattern approaches completion and buying momentum accelerates. A confirmed breakout above resistance could attract additional buying interest and potentially drive the price toward its projected upside target over the coming weeks.
✅ Show your support by hitting the like button!
✅ Leave a comment below! (What is your opinion about this coin?)
Your feedback and engagement keep me inspired to share more insightful market analysis with you!
AEVOUSDT — Early Reversal or Just a Relief Rally?AEVO/USDT on the 3D timeframe is currently showing a very interesting structure after experiencing a long-term downtrend since its initial listing. 📉➡️📈🔥
Price has continuously moved below the major bearish trendline, but now it is starting to approach a critical breakout area that could become the beginning of a major trend reversal. 🚀🔑
From the chart structure, AEVO appears to be attempting to escape long-term bearish pressure by forming a base accumulation zone near the lows. 🧩📊 Buyer activity around the demand zone is starting to become visible, suggesting increasing interest from bulls. 🐂💪
━━━━━━━━━━━━━━━
📉🧠 Structure & Pattern Analysis
🔻📏 Descending Trendline Resistance
The long yellow trendline represents the major resistance that has been suppressing price movement for months. 🚧📉
Every previous rally failed to break above this trendline. ❌📈
Now price is once again testing this key resistance area, making it a decisive point for the next major move. ⚠️🔥
━━━━━━━━━━━━━━━
🧩📦 Base Accumulation / Bottoming Structure
Over the past several months, price action has started forming an accumulation structure near the bottom area. 🐂📊
✨ Key characteristics include:
✅ Volatility is decreasing 📉
✅ Selling pressure is slowing down 🛑🐻
✅ Small higher lows are beginning to form 📈
✅ Bullish reactions are appearing from support zones 🚀💥
This kind of structure often becomes the early phase of a major reversal if resistance is successfully broken. 🔥📈🚀
━━━━━━━━━━━━━━━
🟢🚀 Bullish Scenario
If AEVO manages to break out and close strongly above the bearish trendline and nearby resistance zones, the probability of a medium-term reversal will increase significantly. 📈🔥🐂
🎯 Bullish targets shown on the chart:
🎯 Resistance 1 → 0.03450 📍
🎯 Resistance 2 → 0.04450 📍
🎯 Resistance 3 → 0.05950 📍
🎯 Resistance 4 → 0.07670 📍
🎯 Major Target → 0.12350 🚀💎
A valid breakout accompanied by strong volume could trigger short covering and accelerate bullish momentum aggressively. ⚡📈🔥
As long as price can maintain position above the breakout area, a new higher low structure may develop. 🧠📊🐂
━━━━━━━━━━━━━━━
🔴🐻 Bearish Scenario
However, until the breakout is fully confirmed, AEVO still remains inside a long-term bearish structure. ❗📉⚠️
If price fails to break the trendline and gets rejected again:
⚠️ Price could revisit lower support zones 📉
⚠️ Previous lows may be retested 🔄
⚠️ A support breakdown could continue the major downtrend 💥🐻
The low area around 0.01713 remains a crucial support zone that bulls must defend. 🛡️🐂
Losing this level could significantly increase selling pressure again. 📉💣
━━━━━━━━━━━━━━━
📌🧠 Conclusion
AEVO is currently sitting at a critical area after an extended downtrend. 📉➡️📈
The chart is showing early signs of a potential reversal, but the main confirmation still depends on price successfully breaking the descending trendline resistance. 🔑🚀
As long as the breakout has not happened, the market still remains in a recovery phase within a larger bearish structure. ⚠️📊
However, if breakout confirmation occurs, AEVO could have substantial upside potential toward the next resistance levels. 🚀💥📈
━━━━━━━━━━━━━━━
#AEVO 🚀 #AEVOUSDT 📈 #Crypto 💎 #Altcoin 🔥 #TradingView 📊 #TechnicalAnalysis 🧠 #CryptoTrading 💰 #Breakout 🚀 #Bullish 🐂 #Bearish 🐻 #SupportResistance 📍 #Trendline 📉 #Altseason 🌕 #PriceAction ⚡ #CryptoMarket 💥 #Trader 📊 #OKX 🪙 #ChartAnalysis 📈 #SwingTrading 🚀
AEVOUSDT Deep Bull Stack + Active Cascade.... Clean Floor Setup
AEVOUSDT prints 0.02757 spot against 0.02760 futures with F/S ratio 3.22x↓ at 23.4% percentile — Floor territory. Volumes pair 63.15M spot / 1.74M USDT versus 203.08M futures / 5.6M USDT — premium 0.11% Cont at Z 1.1σ, yield Bear 119% APY at 1.1σ.
Signal board stacks 49 bull to 10 bear out of 112 — heavy bull dominance reading Deep BULL 69.76% at 5.61x edge. Candle 12:0 pure bull, Ichi TK 10:4, EMA 7:1, C>T 9:5, Engulf 7:0 all bull-dominant. Only DD/SS 1:9 drags bear. Star 4:0 bullish. Spread 69.8% Deep. Squeeze FIRED with BW 24.53% Normal — fresh fire. Momentum Bull↑ at 314.6% Loosening — coil releasing into normalization. Cascade reads Bull Cascade (1) at 7 bars 19.1% intensity — cascade progressing from (0) to (1), active bull structure building.
Volume reads quiet — Spot Z -0.32 Steady, Fut Z -0.49 Steady, F+S Z -0.45 Steady. SpotZ sequence -0.32:-0.38:0.06 Rising — recent bar turned positive. Spot:Fut Normal. Bull:Bear Z -0.03:-0.73 prints Bullish — bear side genuinely suppressed at -0.73σ while bull sits neutral at -0.03σ.
OBV Z sequence 0.09:-0.03:0.12 reads Inflow with OBV Divergence Normal — modest but consistent positive inflow. Liq Clear.
Price sits 9.3% Floor in 0.1209/0.018 range — bottom decile. Retrace -2.7% shallow tagged Para at 11.7x bounce — parabolic tag on a small retrace means recent bounce has been steep. AT Max 12.51x was 28 bars back.
The honest read: AEVO has the cleanest bull signal stack in today's scans — 5.61x edge, 49:10 signal ratio, Candle 12:0, active Bull Cascade progressing from (0) to (1). Floor leverage at 23.4%, price at 9.3% floor, Bull:Bear Z genuinely bullish, OBV turning positive, Squeeze fresh-fired with BW in Normal zone meaning fuel still available. Only caution flags: Para tag means recent bounce is vertical (risk of retracement), DD/SS 1:9 still bear-weighted (one structural lag), and volume is Steady not yet activated. Contango at 1.1σ is mild — not extreme either direction. This is a patient bull setup, not a chase — the structure says accumulation continuation but the Para bounce warns against buying the immediate spike. Better entry profile on any pullback that holds above 0.026 (prior POI zone) without breaking the cascade count. If volume activates from Steady into Elevated while cascade continues building, this extends hard.
Is That Crypto Pump Real? Data Says No. Here's Why.
Stop Losing Money to Fake Volume. Find Real Moves Now.
Trade the REAL Crypto Volume. Stop Getting Faked Out.
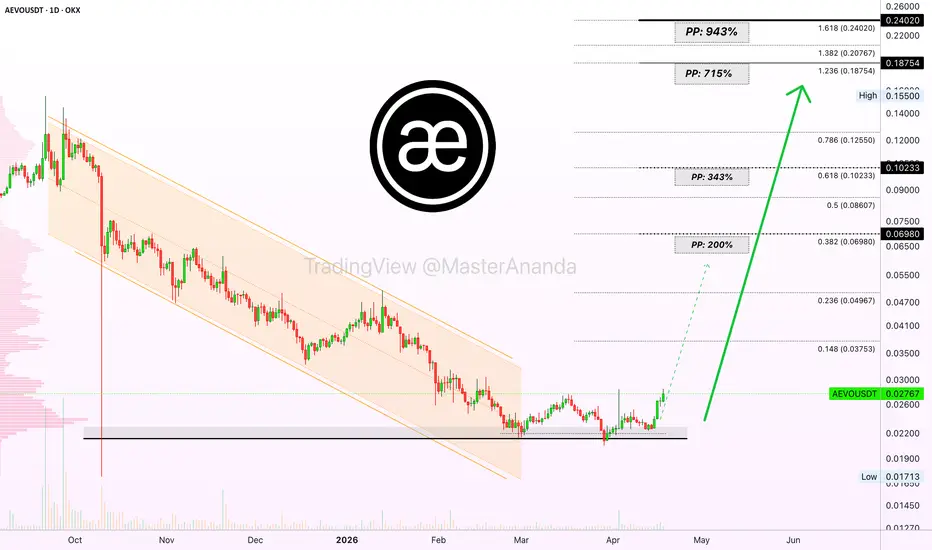
Aevo can grow 943%... The altcoins market bull market is here!AEVOUSDT did recently the highest volume since September 2025, 9 months ago. A bullish breakout is present on the chart based on the daily timeframe.
The move that I am describing gets quickly erased, this is a repeating pattern. I am seeing many breakouts and the next minute all buying gets nullified, prices move back to the starting point. This is a sort of automated market suppression and it can't continue for long.
While it is true that the breakout has been deleted, the bullish signal still remains. Here we have an awesome opportunity for fast, high profits with a very small wait. The best possible ever when it comes to timing and entry prices.
A hyper-easy target is set at $0.0698 for a nice 200%. $0.10 is still very easy opening 343%. The higher targets can take longer and these are good also, we know they will hit. The bullish cycle we are about to experience will be something big, bigger than anything you can imagine. It will be great.
AEVOUSDT is on track to hit the highest prices in years, also on track to perform the strongest bullish wave ever in its history. This will repeat across hundreds if not thousands of altcoins. The best is right around the corner—very close.
The next target that I am highlighting sits at $0.187 for 715%, and, $0.24 for a nice 943%. The entire move can result in much, much higher prices. These targets are shared for guidance only and as an example as to what is possible, the market tends to break all resistance levels, fill all sell orders, on the way up.
It is wise to set the sell orders on target before-hand, because the bots perform certain calculations and only buy as much as it is needed to fill all those orders that have been sitting on the exchanges for months. It is a business, it is all calculated. The market gives, the market takes.
There is nothing special about a bullish wave, it is an impersonal event.
The market has no idea about big or small, high or low. The market moves based on its rhythm and nature. We study it, try to learn about it to predict what might happens next, regardless of our efforts, the market remains a mystery... Some moves are impossible to explain.
The market though is a baby when it comes to its most basic cycle, night and day, down and up. We know that a bearish period is followed by growth. This cannot be avoided. Prepare for the altcoins market bull market—Bitcoin will also grow.
Namaste.
Aevo can grow 943%... The altcoins market bull market is here! AEVOUSDT today is doing the highest volume since September 2025, 9 months ago. A bullish breakout is present on the chart based on the daily timeframe.
The move that I am describing gets quickly erased, this is a repeating pattern. I am seeing many breakouts and the next minute all buying gets nullified, prices move back to the starting point. This is a sort of automated market suppression and it can't continue for long.
While it is true that the breakout has been deleted, the bullish signal still remains. Here we have an awesome opportunity for fast, high profits with a very small wait. The best possible ever when it comes to timing and entry prices.
A hyper-easy target is set at $0.0698 for a nice 200%. $0.10 is still very easy opening 343%. The higher targets can take longer and these are good also, we know they will hit. The bullish cycle we are about to experience will be something big, bigger than anything you can imagine. It will be great.
AEVOUSDT is on track to hit the highest prices in years, also on track to perform the strongest bullish wave ever in its history. This will repeat across hundreds if not thousands of altcoins. The best is right around the corner—very close.
The next target that I am highlighting sits at $0.187 for 715%, and, $0.24 for a nice 943%. The entire move can result in much, much higher prices. These targets are shared for guidance only and as an example as to what is possible, the market tends to break all resistance levels, fill all sell orders, on the way up.
It is wise to set the sell orders on target before-hand, because the bots perform certain calculations and only buy as much as it is needed to fill all those orders that have been sitting on the exchanges for months. It is a business, it is all calculated. The market gives, the market takes.
There is nothing special about a bullish wave, it is an impersonal event.
The market has no idea about big or small, high or low. The market moves based on its rhythm and nature. We study it, try to learn about it to predict what might happens next, regardless of our efforts, the market remains a mystery... Some moves are impossible to explain.
The market though is a baby when it comes to its most basic cycle, night and day, down and up. We know that a bearish period is followed by growth. This cannot be avoided. Prepare for the altcoins market bull market—Bitcoin will also grow.
Namaste.
$AEVO Potential Reversal Zone FormingBINANCE:AEVOUSDT
CRYPTOCAP:AEVO Buyers Fair Value Gap #64 Activated: Potential Reversal Zone Forming on 4H Chart 🚀
🧐 Bearish Correction Reaching Major Demand Area
AEVO has completed a strong impulsive uptrend followed by a sharp corrective decline. Price has now entered the Buyers Fair Value Gap #64 (0.0247 – 0.0254), currently trading near 0.0257 — a high-probability demand zone where buyers have historically stepped in.
📉 Current Market Structure*
- Clear impulsive bullish wave earlier, now followed by a corrective move
- Multiple red candles showing selling pressure, but momentum appears to be slowing
- Price interacting directly with the unfilled Buyers FVG after breaking recent swing lows
💡 Possible Scenarios:
1. Bullish Reversal Setup → If price stabilizes inside the gap and forms a higher low with bullish candle confirmation, we could see a relief rally targeting 0.0265 – 0.0275 first, then potentially pushing toward 0.0280 – 0.0290.
2. Bearish Continuation → If the gap fails to hold and we get a decisive close below 0.0247, the downtrend may extend toward 0.0221 – 0.0217 as the next support zone.
⚠️ Key Levels to Watch:
- Support: 0.0247 – 0.0254 (Buyers FVG – critical zone)
- Resistance: 0.0265 then 0.0275 – 0.0285
- Invalidation of bullish scenario: sustained close below 0.0247
This is another classic “money is made by sitting, not trading” setup. Patience while price tests this demand imbalance will be key. Let the candles and volume confirm the direction before committing.
#AEVO #AEVOUSDT #Aevo #Crypto #Altcoins #FairValueGap #BuyersFVG #SmartWedgeTrader #TradingView #CryptoTrading #ReversalZone
AEVOUSDT.PPrice is currently approaching a significant supply zone, in alignment with the overall market structure remaining in a confirmed downtrend. This condition reflects prevailing selling pressure, thereby increasing the probability of a bearish rejection at the supply area, which may result in a continuation of downward price movement.
Disclaimer: This analysis is provided solely for educational and informational purposes and does not constitute financial advice or an invitation to buy or sell any asset. The author is not a professional analyst, and any trading decisions made are entirely at the individual’s own risk.
Aevousdt trading ideaAevo exhibit clear downtrend with a descending trendline acting as resistance. Price is currently reacting to a local resistance zone, where a breakout could lead to a test of the critical resistance at 0.6112, while rejection could send it towards the projected bearish target around 0.0580. Price action suggests consolidation within a tight range, indicating indecision. A break above the local resistance could trigger bullish momentum, while failure may extend the downtrend. The next major move depends on price reaction at the current resistance zone.
AEVO/USDT — At Demand Zone: End of the Bearish Phase?📊 Technical Overview:
AEVO/USDT is showing signs of structural stabilization after a prolonged downtrend since early 2024.
The major descending trendline (yellow) that had been acting as dynamic resistance has now been broken to the upside, indicating early weakness in bearish momentum.
Currently, price is consolidating within the 0.10–0.08 USDT demand zone, which has repeatedly absorbed selling pressure — marking it as a key area of institutional interest and potential accumulation.
This area represents a critical accumulation base, typically seen before large directional moves or macro reversals in higher timeframes.
---
🔶 Structural and Technical Insights:
Downtrend Line Breakout: The long-term descending trendline has been breached, suggesting a potential shift in the macro market structure.
Active Demand Zone (0.10–0.08): Price continues to defend this zone strongly, reflecting buyer absorption and accumulation behavior.
Base Formation / Range Consolidation: The sideways structure indicates a phase of market reaccumulation or base building — often the precursor to a new trend.
Key Levels to Watch:
Major Support: 0.10 – 0.08 USDT
Immediate Resistance: 0.1219 – 0.1449 USDT
Upside Targets: 0.3046 → 0.4416 → 0.6132 → 0.9947 USDT
---
🟩 Bullish Scenario (Potential Macro Reversal):
1. Main Confirmation: A 3D candle close above 0.145 USDT with strong buying volume.
2. Technical Validation: Such a breakout would confirm AEVO’s exit from the accumulation range, signaling the beginning of a mid-term uptrend.
3. Upside Targets:
Target 1: 0.3046 USDT
Target 2: 0.4416 USDT
Extended Targets: 0.6132 – 0.9947 USDT
4. Risk Management: Stop-loss below 0.0800 USDT, or apply a trailing stop after a confirmed breakout to protect profits.
> Note: Volume-backed breakouts on the 3D timeframe often serve as early confirmations of trend shifts from bearish to bullish.
---
🟥 Bearish Scenario (Breakdown from the Accumulation Base):
1. Confirmation: A confirmed 3D candle close below 0.080 USDT.
2. Implication: This would signal the failure of the demand zone, potentially extending the downtrend.
3. Targets: Immediate support lies at 0.0670 USDT (the previous structural low).
A breakdown below this level could expose AEVO to further markdowns with limited structural support below.
---
AEVO currently sits within a decision zone where the next directional move will be defined.
The 0.10–0.08 USDT demand area is the key battleground — if buyers maintain control, a structural reversal could unfold.
A confirmed breakout above 0.145 USDT would mark a macro trend reversal, while a close below 0.08 USDT would validate a continuation of the bearish trend.
---
Conclusion:
AEVO/USDT is building a large-scale accumulation structure around the 0.10–0.08 zone, indicating that the market may be nearing the end of its distribution phase.
A confirmed breakout above 0.145 USDT could trigger a major bullish reversal, targeting mid-term resistance levels.
However, failure to hold the 0.08 support would reintroduce strong bearish pressure and potentially test the previous low at 0.0670 USDT.
This remains a critical inflection point for AEVO’s broader trend direction.
---
#AEVO #AEVOUSDT #CryptoAnalysis #TechnicalOutlook #MarketStructure #PriceAction #SwingTrading #TrendReversal #CryptoSetup #AltcoinAnalysis
#AEVO/USDT — Accumulation at Key Zone: Breakout or Breakdown?#AEVO
The price is moving within a descending channel on the 1-hour frame, adhering well to it, and heading for a strong breakout and retest.
We have a bearish trend on the RSI indicator that is about to be broken and retested, which supports the upward breakout.
There is a major support area in green at 0.1060, which represents a strong support point.
We are heading for consolidation above the 100 moving average.
Entry price: 0.1120
First target: 0.1210
Second target: 0.1329
Third target: 0.1488
Don't forget a simple matter: capital management.
When you reach the first target, save some money and then change your stop-loss order to an entry order.
For inquiries, please leave a comment.
Thank you.
AEVO/USDT — A Classic Altcoin Bottom Structure🧠 Context:
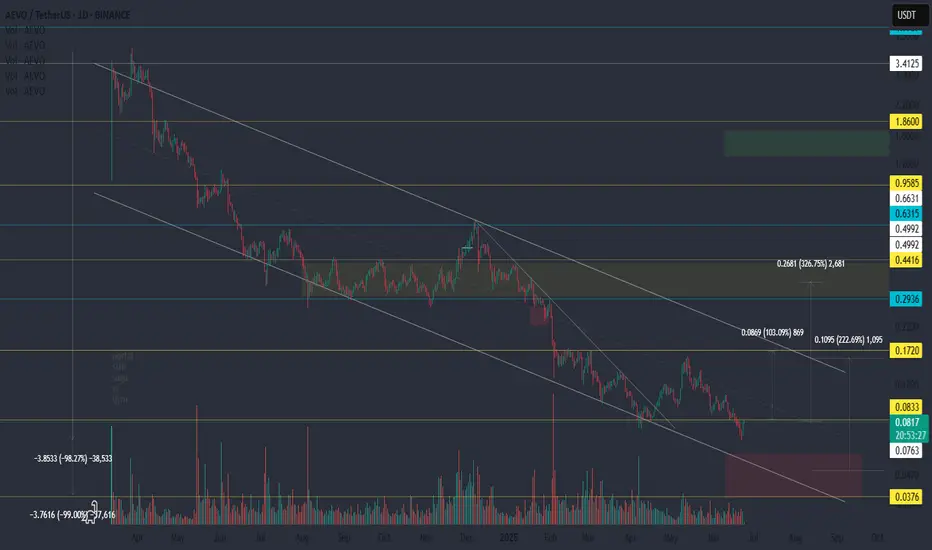
Another chart showing a typical altcoin structure near the bottom. Price has dropped over 98% from the all-time high. The concept of a "bottom" here is highly abstract — risk remains elevated, and liquidity is thin.
📉 Chart Highlights:
▪️ Price is still moving within a descending channel
▪️ A potential double bottom or dragon pattern is forming
▪️ The 0.0833 level is a key zone to watch
📈 Potential Move:
If the 0.0833 area holds, we may see a push toward the upper boundary of the channel.
Due to thin order books, any move could be impulsive and fast.
⚠️ Note:
This is still a weak market structure.
The idea is speculative — focus on price reaction rather than prediction.
AEVO — 230 Days of Accumulation, Breakout AheadAEVO has been consolidating for the past 230 days in what looks like a Wyckoff accumulation between the 100M–150M market cap range. AEVO is now on the verge of breaking its long-term bear trend.
🟢 Long Setup Idea
Entry Zone: $0.13–$0.12
Stop-Loss: Below $0.11
Target: ~$0.35
Key Resistance Levels
Yearly Dynamic VWAP → $0.1384 → current resistance / key S/R zone
Anchored VWAP (Dec 7, 2024 high at $0.6549) → ~$0.17 → key resistance in confluence with the key highs → A clean break above this = bullish
150M Market Cap → $0.164 → major breakout level
Once cleared, significant upside potential opens up.
Higher Timeframe Targets
$0.35 Zone → Primary long target (POC of the 2024 trading range, yearly Open at $0.3614, 0.5 Fib retracement of the downtrend at $0.359)
$0.43 Zone → 0.618 Fib retracement of the downtrend, in confluence with the 400M market cap
$0.50 Zone → Anchored VWAP resistance + psychological level
$0.53 Zone → 0.786 Fib retracement
$0.55 Zone → 500M market cap resistance
Key Levels
Support → $0.12–$0.13
Resistance → $0.1606–$0.17 → $0.35 → $0.43–$0.55
🔍 Indicators used
DriftLine — Pivot Open Zones → For identifying key yearly/monthly/weekly/daily opens that act as major S/R reference points
➡️ Available for free. You can find it on my profile under “Scripts” and apply it directly to your charts for extra confluence when planning your trades.
_________________________________
💬 If you found this helpful, drop a like and comment!
AEVOUSDT UPDATE#AEVO
UPDATE
AEVO Technical Setup
Pattern: Bullish Pennant Pattern
Current Price: $0.1379
Target Price: $0.213
Target % Gain: 70.21%
ASX:AEVO has broken out of a Bullish Pennant on the 1D timeframe. Current price is $0.1379 with a target near $0.213, offering over 70% upside potential. The breakout confirms strong bullish momentum with structure favoring continuation. Always use proper risk management.
Time Frame: 1D
Risk Management Tip: Always use proper risk management.
AEVO/USDT — Accumulation at Key Zone: Breakout or Breakdown?📖 Full Analysis
Since its listing, AEVO has been in a heavy downtrend, consistently forming lower highs under the dominant descending trendline (yellow). However, for the past several months, the price has been holding in the same range: 0.067 – 0.12 (yellow box).
This zone is highly significant:
Consistent demand: buyers are stepping in every time price approaches 0.067.
Weakening sell pressure: sellers fail to push price to new lows.
Pattern formation: the structure resembles a descending triangle — typically bearish, but a confirmed breakout can flip the script into a major reversal.
In short, AEVO is now at a critical crossroads: Will this accumulation become the foundation for a bullish reversal, or a trap before another leg down?
---
📈 Bullish Scenario
1. Main triggers:
Breakout above the descending trendline
3D candle close above 0.1219 with strong volume
2. Upside targets after breakout:
TP1: 0.1449 (minor resistance)
TP2: 0.3046 (major resistance zone)
TP3: 0.4416 – 0.6132 (key Fibonacci levels)
3. Bullish strength:
A confirmed breakout would turn this entire range into a long-term bottom structure, potentially attracting mid-term investors.
---
📉 Bearish Scenario
1. Main triggers:
Rejection at the trendline or failure to close above 0.1219
Breakdown below 0.0670 with a confirmed 3D close + volume spike
2. Downside targets after breakdown:
0.04 – 0.05 (next psychological zone, no strong supports below)
Potential deeper continuation if demand fails to hold
3. Bearish bias:
Historically, descending triangles break to the downside more often than not, so this risk must be respected.
---
🎯 Key Levels to Watch
Support: 0.0670 – 0.12
Immediate resistance: 0.1219 – 0.1449
Extended targets: 0.3046 → 0.4416 → 0.6132 → 0.9947
---
⚖️ Conclusion
AEVO is consolidating in a long-term accumulation zone that will define its next big move.
Bullish case: Breakout above trendline + close > 0.1219 → reversal potential toward higher levels.
Bearish case: Breakdown below 0.067 → continuation of the macro downtrend.
On the 3D timeframe, signals carry heavier weight. Patience and strict risk management are key.
This is not financial advice — purely a technical outlook.
---
AEVO is consolidating in a critical zone (0.067–0.12). A breakout above the downtrend + close > 0.1219 could target 0.1449 → 0.30+. A breakdown below 0.067 risks further bearish continuation toward 0.04–0.05. AEVO is at a major decision point.
---
#AEVO #AEVOUSDT #CryptoAnalysis #Altcoins #Breakout #DescendingTriangle #Accumulation #SupportResistance #SwingTrade
AEVOUSDT Forming Falling WedgeAEVOUSDT is displaying a strong technical setup with the formation of a classic falling wedge pattern. This is widely recognized as a bullish reversal signal, especially when combined with healthy trading volume. The price action has been consolidating within this structure, gradually squeezing and preparing for an upward breakout. With volume confirming investor interest, the conditions appear favorable for a significant move to the upside. Based on current technicals, the pair has the potential to deliver gains in the range of 60% to 70%+.
The falling wedge pattern often marks the end of a corrective phase, paving the way for a fresh bullish rally. AEVOUSDT is showing signs of strength as it approaches a breakout zone, supported by growing market participation. Such setups are typically followed by strong rallies as trapped sellers exit positions and new buyers step in, creating momentum-driven surges.
Investor sentiment is also improving around AEVO, adding confidence to the technical picture. If the breakout sustains, AEVOUSDT could quickly climb toward higher resistance levels, providing a lucrative opportunity for short- to medium-term traders. This setup places AEVOUSDT on the radar as one of the promising coins to watch in the coming weeks.
✅ Show your support by hitting the like button and
✅ Leaving a comment below! (What is You opinion about this Coin)
AEVO Main Trend DEX L2 Listing 212 X !) Decrease -98% 06 25Logarithm. Term 3 days.
Asset super hype in the past, listing with overly positive and aggressive marketing at 212X!
1️⃣Q1 2023 Private Seed $0.0185 / $1.85 million
2️⃣10 05 2023 Private Series A $0.13 / $6.01 million
3️⃣Q4 2023 Private Series A+ $0.25 / $8.75 million
4️⃣13 03 2024 Listing on the Binance exchange on the day of the secondary market trend reversal (I missed it, and it happens).
26 06 2025 now -98% decline after listing, which is 4.2X from the last prices of scammers, who gradually distributed, maintaining liquidity and the news background all this time their huge profit. Most of the coins are redistributed. You can think about collecting in this sideways, on a breakout of a local wedge (local trend), or on a breakout of a descending channel (reversal of the main trend).
Those who are far from trading can buy in equal parts (3 parts). From the position of the main trend and potential, the prices are now acceptable (you can buy the first part), so to speak (former "hype investors" are in wild horror).
Exit zones will be zones of previous consolidation, that is, those who previously bought on the hype will not be able to make a profit. In fact, it is always like this ... There are no “passengers”, then they will pump up well. As a rule, +800-1000% such assets of the previous excitement and such liquidity.
Local reversal zone.