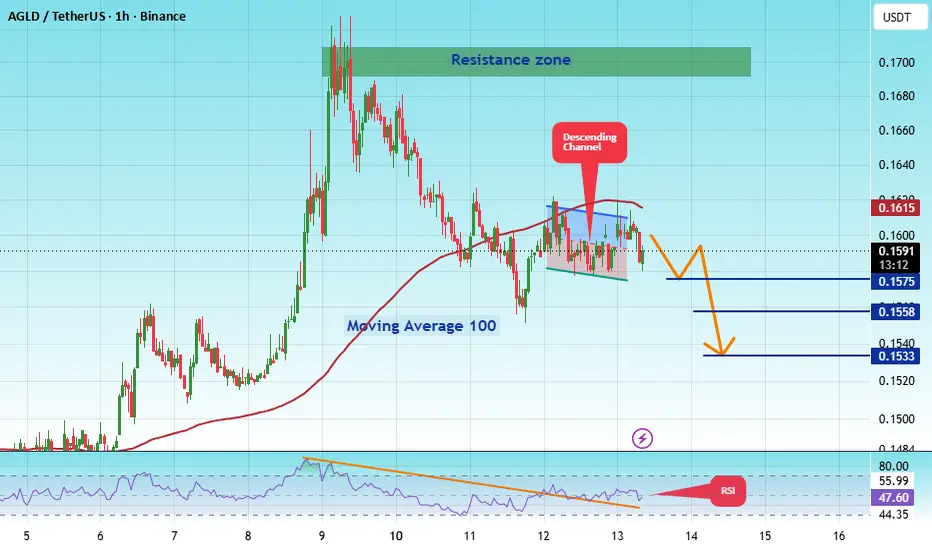
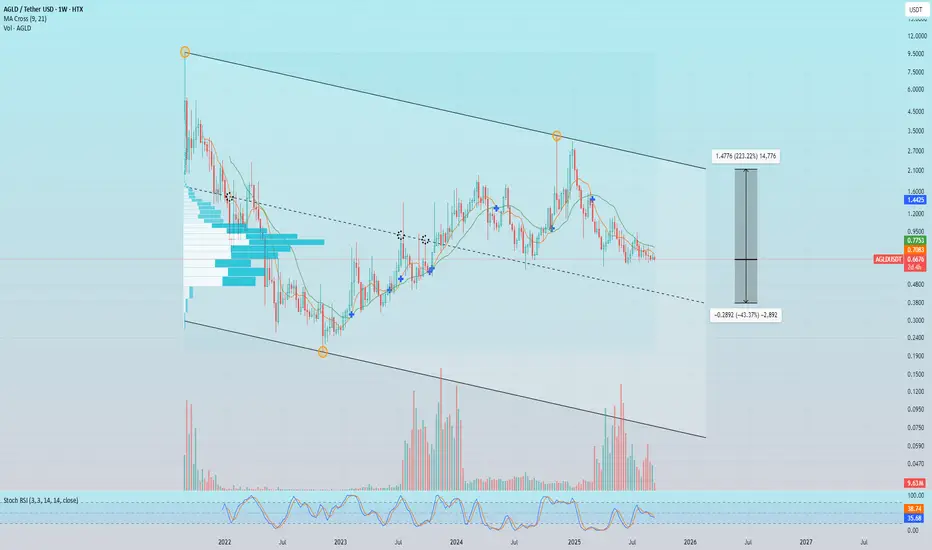
AGLDUSDT — Short at Range Ceiling, Sellers Stepping In Earlier#AGLD
The price is moving within a descending channel on the 1-hour timeframe and has reached the lower boundary, heading towards a breakout. A retest of this boundary is expected.
The Relative Strength Index (RSI) indicates a downward trend, and this trend is likely to continue due to the overbought condition.
There is a key resistance zone in green at 0.1700, which the price has bounced off several times, making it a strong support level.
A consolidation trend is observed above the 100-period moving average, which we are approaching. This trend supports a decline towards this level.
Entry Price: 0.1592
Target 1: 0.1575
Target 2: 0.1558
Target 3: 0.1533
Stop Loss: At the resistance zone in green.
Remember this simple rule: Manage your money wisely.
For any questions, please leave a comment.
Thank you.
In-depth trading ideas
#AGLDUSDT Ready for a Breakout? Analysis of a Long Accumulatio#AGLD
The price is moving within a descending channel on the 1-hour timeframe and has reached the lower boundary. It is now poised for a bounce and is expected to retest this boundary.
The Relative Strength Index (RSI) indicates a downward trend, which is likely to continue given the overbought conditions.
There is a key support zone in green at 0.1300, and the price has bounced off this zone several times, making it a strong support level.
The price is trending towards the 100-period moving average, which we are approaching. This trend supports an upward move.
Entry Price: 0.1510
Target 1: 0.1566
Target 2: 0.1636
Target 3: 0.1715
Stop Loss: At the resistance zone in green
Remember this simple rule: Money management.
Any questions? Please leave a comment.
Thank you.
AGLDUSDT — Bid from Support [Quantum Algo]AGLD ran from the 0.1485 base up to 0.185, then sold off through the range. Price has pulled back into a demand shelf around 0.1556 and held, firing the Buy. This is a pullback long: the deeper retrace has brought price back to a level where buyers have stepped in before, and the play is to buy the hold and target the mid-range supply overhead.
Why this setup works — three confluences:
Demand rejection on the retrace. Price pulled into the demand zone and reacted rather than continuing straight down to the base. That's where buyers step back in — the Buy printed on the reaction, giving a defined floor to lean risk against instead of catching a falling knife mid-air.
Level with a track record. This zone sits in the same area that produced the earlier launch off 0.1485. Price returning to a shelf that's already produced a clean leg up means you're trading a level with memory, not a fresh guess.
Clear room to mid-range supply. Above entry there's room up toward the 0.171 zone, where the last rejection came from and the logical draw on a recovery. Defined risk below demand, asymmetric room up to structure.
Trade management:
Entry: 0.15561 (rejection off demand)
SL: 0.14660 (below the demand shelf)
TP1: 0.16500 — take 50% off, move stop to breakeven
TP2: 0.17100 — 100% exit at the target zone
R:R: ~1.7:1 to full target
Invalidation:
A 2h close back below 0.14660. That breaks the demand shelf and the base that launched the last rally — sellers take control, thesis dead, just out.
The lesson:
The levels worth trading are the ones that already produced something. When a demand zone launches a clean leg up and price eventually returns to it, you're not predicting a bottom — you're waiting at a shelf with history and letting it prove itself again. The stop below the level is what keeps that patience honest: if the zone that worked before finally fails, you're out for one clean R instead of arguing with the chart.
Signal fired. We took it. Update coming.
Disclaimer: Not financial advice. This idea is shared for educational purposes only. Trading leveraged instruments carries substantial risk. Past performance is not indicative of future results. Always do your own research and manage your own risk.
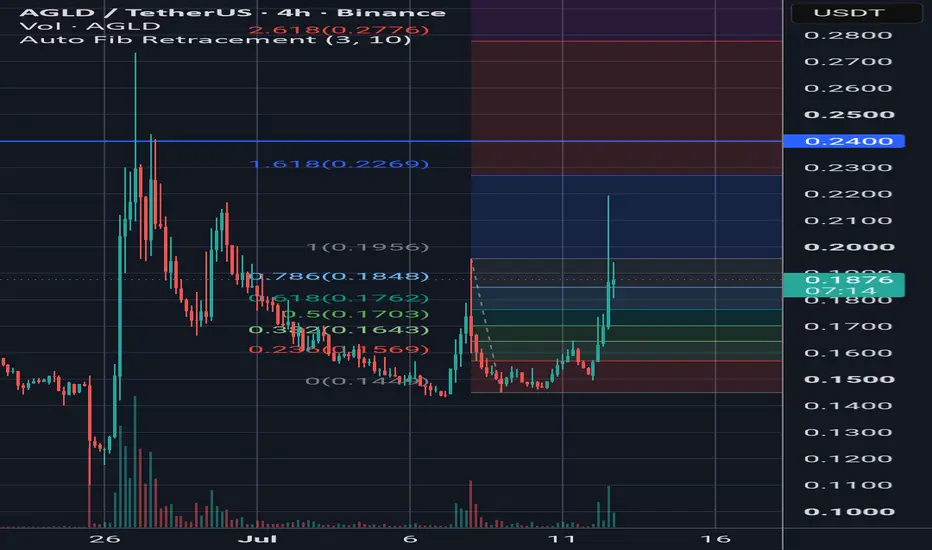
AGLDUSDT Forming Bullish MomentumAGLDUSDT is forming a clear bullish momentum pattern, a classic bullish wave signal that often indicates a good rejection. The price has been consolidating within a narrowing range, suggesting that selling pressure is weakening while buyers are beginning to regain control. With consistent volume confirming accumulation at lower levels, the setup hints at a potential bullish breakout soon. The projected move could lead to an impressive gain of around 30% to 40% once the price breaks above the key resistance zone.
This bullish momentum pattern is typically seen at the end of downtrends or corrective phases, representing a potential shift in market sentiment from bearish to bullish. Traders closely watching AGLDUSDT are noticing strengthening momentum as the price approaches a critical breakout area. Healthy trading volume adds confidence to this setup, indicating that market participants may be positioning early in anticipation of a sustained upward move.
Investors' growing interest in AGLDUSDT reflects increasing confidence in both its long-term potential and current technical structure. If the breakout is confirmed with strong and sustained volume, it could signal the beginning of a fresh bullish trend. This setup may present an attractive opportunity for medium-term traders looking to capitalize on accelerating buying momentum as the pattern completes.
✅ Show your support by hitting the like button!
✅ Leave a comment below: What is your opinion about this coin?
Your feedback and engagement keep me inspired to share more insightful market analysis with you!
#AGLDUSDT Ready for a Breakout? Analysis of a Long Accumulatio#AGLD
The price is moving within a descending channel on the 1-hour timeframe and has reached the lower boundary. It is now poised for a bounce and is expected to retest this boundary.
The Relative Strength Index (RSI) indicates a downward trend, which is likely to continue given the overbought conditions.
There is a key support zone in green at 0.1516, and the price has bounced off this zone several times, making it a strong support level.
The price is trending towards the 100-period moving average, which we are approaching. This trend supports an upward move.
Entry Price: 0.1790
First Target: 0.1855
Second Target: 0.1929
Third Target: 0.2022
Stop Loss: At the resistance zone in green
Remember this simple rule: Money management.
Any questions? Please leave a comment.
Thank you.
#AGLDUSDT Ready for a Breakout? Analysis of a Long Accumulatio#AGLD
The price is moving within a descending channel on the 1-hour timeframe and has reached the lower boundary. It is now poised for a bounce and is expected to retest this boundary.
The Relative Strength Index (RSI) indicates a downward trend, which is likely to continue given the overbought conditions.
There is a key support zone (in green) at 0.195, and the price has bounced off this zone several times, making it a strong support level.
The price is trending towards the 100-period moving average, which we are approaching. This trend supports an upward move.
Entry Price: 0.216
First Target: 0.221
Second Target: 0.229
Third Target: 0.238
You can stop at the first and second targets and close the price, or continue towards the third target. Stop Loss: At the resistance zone (in green).
Remember this simple rule: Money Management.
Any questions? Please leave a comment.
Thank you.
#AGLDUSDT Ready for a Breakout? Analysis of a Long Accumulatio#AGLD
The price is moving within a descending channel on the 1-hour timeframe and has reached the lower boundary. It is now poised for a bounce and is expected to retest this boundary.
The Relative Strength Index (RSI) indicates a downward trend, which is likely to continue given the overbought conditions.
There is a key support zone (in green) at 0.216, and the price has bounced off this zone several times, making it a strong support level.
The price is trending towards the 100-period moving average, which we are approaching. This trend supports an upward move.
Entry Price: 237.
Target 1: 0.247
Target 2: 0.255
Target 3: 0.264
You can stop at the first and second targets and close the price, or continue towards the third target.
Stop Loss: At the resistance zone (in green).
Remember this simple rule: Money Management.
Any questions? Please leave a comment.
Thank you.
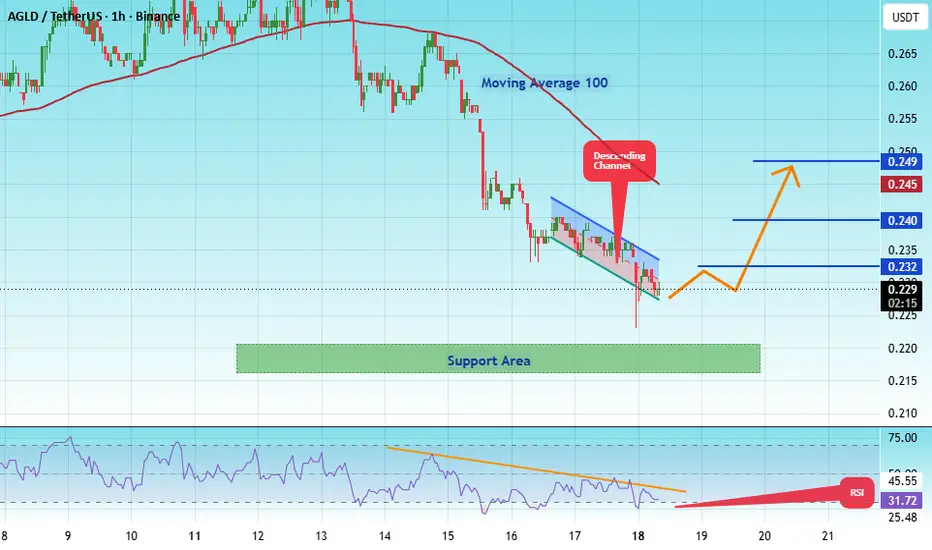
#AGLDUSDT Alert! Imminent Rise#AGLD
The price is moving within a descending channel on the 1-hour timeframe and has reached the lower boundary. It is now poised for a bounce and is expected to retest this boundary.
The Relative Strength Index (RSI) indicates a downward trend, which is likely to continue given the overbought conditions.
There is a key support zone (in green) at 0.217, and the price has bounced off this zone several times, making it a strong support level.
The price is trending towards the 100-period moving average, which we are approaching. This trend supports an upward move.
Entry Price: 0.229
First Target: 0.232
Second Target: 0.240
Third Target: 0.249
You can stop at the first and second targets and close the price, or continue towards the third target.
Stop Loss: At the resistance zone (in green).
Remember this simple rule: Money Management.
Any questions? Please leave a comment.
Thank you.
AGLD/USDT — Short at Range Ceiling, Sellers Stepping In EarlierAGLDUSDT Perpetual
Context:
AGLD has been stuck in a wide range between 0.23 and 0.29 for over three weeks. Price has tested the upper boundary multiple times and failed every time. The latest push to 0.285 got rejected hard, and now a Sell signal has fired at 0.265 as price breaks back below mid-range.
Why this setup works — three confluences:
Descending highs at resistance — the first rejection came at 0.29, the second at 0.285, and now the Sell signal is firing at 0.265. Each rally is weaker than the last. Sellers aren't waiting for the top anymore — they're stepping in earlier and more aggressively. That's distribution behavior
Previous Buy zone becoming resistance — look at the left side of the chart. The Buy signal fired around 0.24–0.26 and launched a massive rally. Now that same zone is being tested from above — and instead of holding as support, it's struggling. When the zone that launched the move can't support price on the retest, the buyers who drove the rally are gone
Mid-range failure — the 0.265 area is the equilibrium of the entire range. A Sell signal firing at equilibrium means sellers have control of the midpoint. When bears own the middle, they usually push for the bottom
A Sell signal fired at 0.26125. We took it.
Trade management:
Entry: 0.26125
Stop Loss: 0.27500 — above the mid-range resistance
TP1: 0.24255 — previous demand shelf, 50% off, stop to breakeven
TP2: 0.23197 — range low for 100% exit
R:R: ~1:1.4 to TP1, ~1:2.1 to TP2. Strong asymmetry — tight stop, deep targets.
Invalidation: Close above 0.27500 — buyers reclaim the mid-range and the short thesis is dead.
The lesson:
Distribution doesn't announce itself with a crash — it shows up as weakening rallies. Each push higher that fails to reach the previous high is the market whispering that demand is drying up. Most traders wait for the breakdown to short. The better play is recognizing the descending highs while they're forming and positioning before the crowd. By the time the breakdown is obvious, the best risk-to-reward is already gone.
Signal fired. We took it. Update coming.
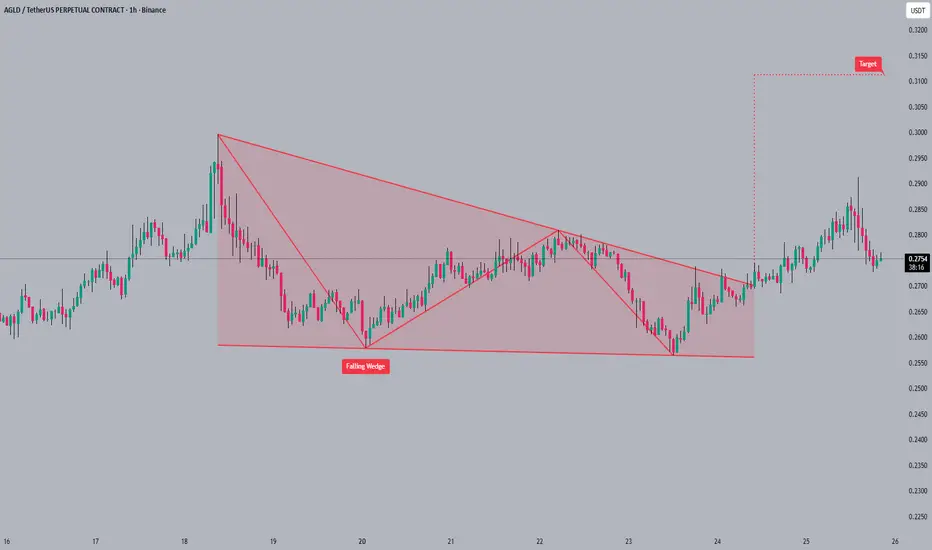
#AGLD#AGLD broke out of a falling wedge pattern 📈 and is currently retesting the breakout level around 0.2750. A successful retest could propel the price towards the next target resistance near 0.3100. Patience is key during retests as they often confirm the strength of a breakout 💪.
#AGLD #altcoin #crypto #trading
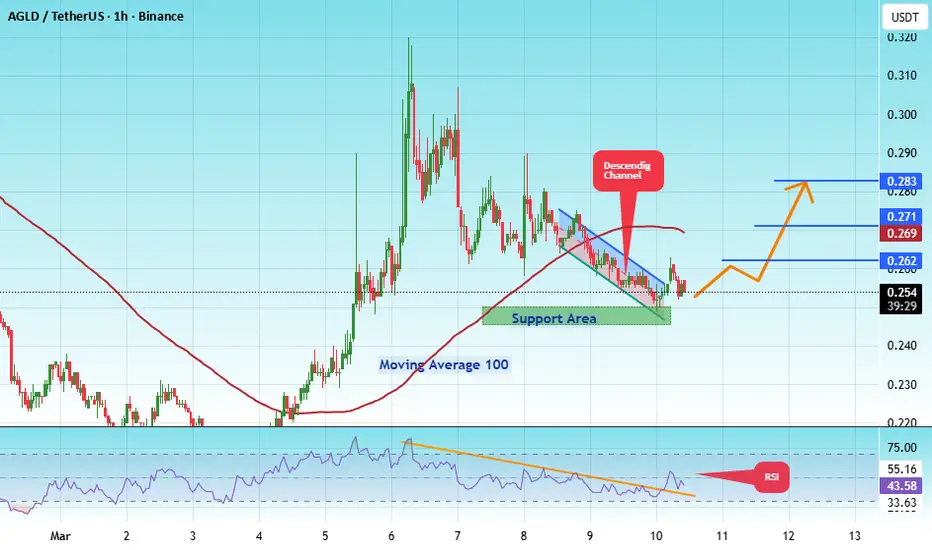
#AGLD/USDT Alert! Imminent Rise#AGLD
The price is moving within a descending channel on the hourly timeframe. It has reached the lower boundary and is trending towards a bounce. A retest of this boundary is expected.
The Relative Strength Index (RSI) indicates a downward trend, and this trend is likely to continue due to the overbought condition.
There is a key support zone in green at 0.248, and the price has bounced off this zone several times, making it a strong support level.
The price is trending towards the 100-period moving average, which we are approaching. This trend supports an upward move.
Entry Price: 0.254
First Target: 0.262
Second Target: 0.270
Third Target: 0.283
Stop Loss: At the resistance zone in green
Remember this simple rule: Money management.
Any questions, please leave a comment.
Thank you.
#AGLD/USDT Alert! Imminent Rise#AGLD
The price is moving within a descending channel on the hourly timeframe. It has reached the lower boundary and is heading towards a breakout, with a retest of the upper boundary expected.
The Relative Strength Index (RSI) is showing a downward trend, approaching the lower boundary, and an upward bounce is anticipated.
There is a key support zone in green at 0.277, and the price has bounced from this level several times. Another bounce is expected.
The RSI is showing a trend towards consolidation above the 100-period moving average, which we are approaching, supporting the upward move.
Entry Price: 0.283
First Target: 0.294
Second Target: 0.307
Third Target: 0.322
Stop Loss: Below the green support zone.
Remember this simple thing: Money management.
For any questions, please leave a comment.
Thank you.
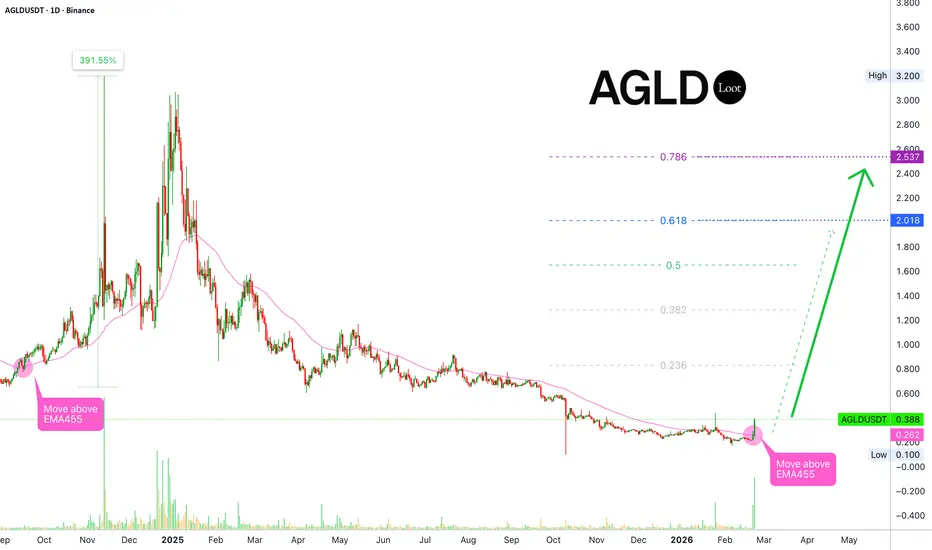
Adventure Gold—AGLD, becomes bullish after conquering EMA55This is a major development and a true confirmation for the start of a bullish trend.
›› AGLDUSDT broke yesterday, with high volume, above EMA55 on the daily timeframe. Today we are seeing a very strong continuation with a huge daily candle above this level with even higher volume—the highest volume since December 2024.
Needless to say, a break, move and close above EMA55, coupled with high volume, on the daily timeframe confirms the start of a bullish market cycle or phase. The minimum length of growth expected after this event lingers around 1-3 months, which is a long time.
AGLDUSDT hit bottom October 2025 and has been consolidating at bottom process for four months. With the current signal, with the move that is happening yesterday and today, we have confirmation that the period of boring sideways action is over. The accumulation period is over. This development precedes a massive wave of growth.
The last time this event happened, coming from a low point, was September 2024 leading to a ~400% bullish wave. This time around growth can be many times more or something similar.
Seeing the length and strength of the bearish cycle—it includes a new all-time low—tells us that Adventure Gold is set to produce an astonishing bullish cycle. Potentially a higher high will show vs the peak in 2024.
This signal works on this pair individually and also to support a broader bullish bias across the altcoins. What one does, the rest follows.
Thanks a lot for your continued support.
Namaste.
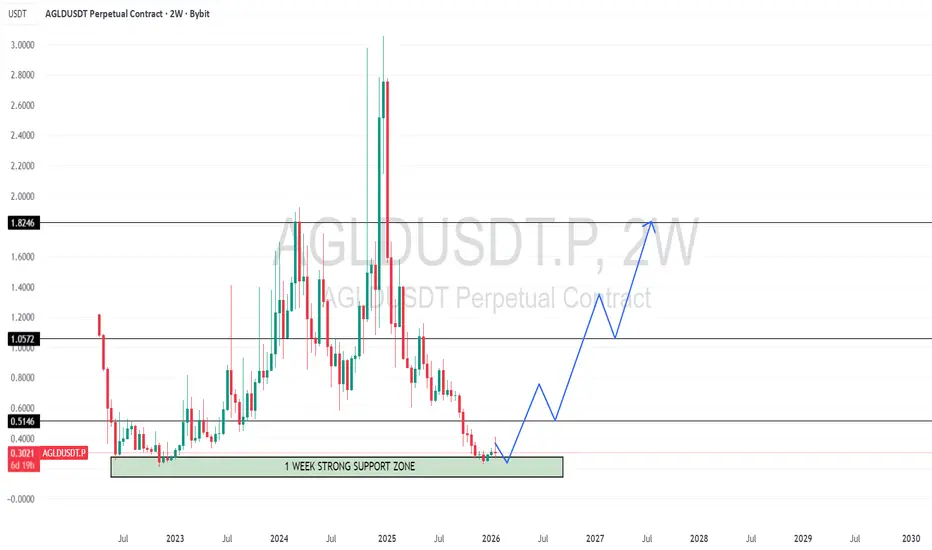
AGLD 2W HIGHER TIME FRAME UPDATE
📌 AGLD Technical Analysis: price massive dumped since 1 year following the broader market correction. currently price is moving in a long-term accumulation range after falling from its previous yearly highs.
📌 Major Support Zone:
Strong Support: now in strong support zone that has historically acted as a major demand floor.
Hold Support: before got massive up move tachin this support zone and history shows buyers always step in here.
Indicators: weekly RSI is in the neutral zone, which shows the selling pressure is exhausted and there is plenty of room for a big move up.
Trend Shift: price is currently fighting to hold above the long-term moving averages to confirm a trend reversal.
🔥 Conclusion: AGLD is at a major historical support level. if it hold this strong zone, price can massive up again 📈
AGLD/USDT – at Critical Support, Reversal or Breakdown?AGLD/USDT remains in a long-term downtrend, characterized by a clear sequence of lower highs and lower lows since its peak. However, recent price action shows weakening bearish momentum and early signs of a consolidation phase after a prolonged decline.
---
Pattern & Price Structure
Price continues to move below the main descending trendline (yellow line), which has acted as a dynamic resistance since the beginning of the downtrend.
The current structure resembles a Descending Channel / Extended Downtrend with Base Formation.
At the lower area, price compression is visible as the range tightens, indicating the potential for a strong directional move ahead.
As long as price remains below the descending trendline, the broader structure is still technically bearish.
---
Key Levels (Support & Resistance)
Resistance:
0.390 → nearest resistance and previous rejection zone
0.575 → mid-term resistance and former distribution area
0.660 – 0.845 → strong supply zone
1.120 → major resistance / extreme upside target if a strong reversal occurs
Support:
0.315 → current support and consolidation area
0.260 – 0.226 → historical support and lower range boundary
---
Bullish Scenario
Price holds above 0.315 and forms a higher low.
A valid breakout above the descending trendline, confirmed by a 2D candle close.
Gradual upside targets:
0.390
0.575
0.660
This scenario would indicate an early trend reversal from bearish to neutral–bullish.
---
Bearish Scenario
Price fails to break the trendline and gets rejected around the 0.39 area.
A breakdown below 0.315 signals bearish continuation.
Further downside potential toward:
0.260
0.226 (historical low support)
As long as price stays below the main trendline, selling pressure remains dominant.
---
Conclusion
AGLD/USDT is still in a major downtrend, but price action suggests the market is attempting to form a base / lower consolidation. This zone is critical in determining whether price will reverse upward or continue its decline. Key confirmation lies in price reaction around the descending trendline and the 0.315 level.
#AGLDUSDT #AGLD #CryptoAnalysis #Altcoin #Downtrend #Trendline #SupportResistance #PriceAction #CryptoTrading
#APT/USDT
#APT
The price is moving in a descending channel on the 1-hour timeframe. It has reached the lower boundary and is heading towards a breakout, with a retest of the upper boundary expected.
We are seeing a bearish trend in the Relative Strength Index (RSI), which has reached near the lower boundary, and an upward bounce is expected.
There is a key support zone in green at 0.250, and the price has bounced from this level several times. Another bounce is expected.
We are seeing a trend towards stabilizing above the 100-period moving average, which we are approaching, supporting the upward trend.
Entry Price: 0.264
First Target: 0.270
Second Target: 0.280
Third Target: 0.291
Remember a simple principle: Money Management.
Place your stop-loss order below the green support zone.
For any questions, please leave a comment.
Thank you.
#AGLD/USDT Alert! Imminent Rise#AGLD
The price is moving within a descending channel on the 1-hour frame, adhering well to it, and is heading for a strong breakout and retest.
We have a bearish trend on the RSI indicator that is about to be broken and retested, which supports the upward breakout.
There is a major support area in green at 0.662, which represents a strong support point.
For inquiries, please leave a comment.
We are in a consolidation trend above the 100 moving average.
Entry price: 0.675
First target: 0.686
Second target: 0.704
Third target: 0.723
Don't forget a simple matter: capital management.
When you reach the first target, save some money and then change your stop-loss order to an entry order.
For inquiries, please leave a comment.
Thank you.
AGLD — potential wave 3 setup forming?Key observations:
During the 10–11 Oct market crash, #AGLD held strong and avoided full capitulation.
Wave analysis OKX:AGLDUSDT suggests we may be near the end of corrective wave 2, possibly preparing for an impulsive move.
With a $35M market cap, nearly full token circulation, and roots in the Ethereum ecosystem, fundamentals look cleaner than most low-cap alts.
If the structure holds, next major wave could target the $12 area — but confirmation is still pending.
______________
◆ Follow us ❤️ for daily crypto insights & updates!
🚀 Don’t miss out on important market moves
🧠 DYOR | This is not financial advice, just thinking out loud.
Adventure Gold 854% Target ($7.05)AGLD embarked on a major uptrend starting November 2022. The end was December 2024. This is an interesting chart.
AGLDUSDT weekly is pretty interesting because of how the market changes from a perfect uptrend to a strange double-bottom pattern. But the flat base over such a long stretch of time, August 2024-2025, reveals that something is missing.
So the uptrend started after the November 2022 low non-stop until March 2024. The March 2024 high leads to a correction and the first support is found August 2024. This was the first correction after more than a year of growth.
Then in 2025 the August 2024 support is tested and so far it holds. It holds and we have higher lows with this week now going green. This is it.
AGLDUSDT is preparing to launch a major bullish wave. That is why I mapped a major target on this chart at $7.05. Total profits potential amounts to 854%.
Good luck and good profits... Enjoy the trade.
Namaste.
#AGLD/USDT#AGLD
The price is moving within an ascending channel on the 1-hour frame, adhering well to it, and is on its way to break it strongly upwards and retest it.
We have support from the lower boundary of the ascending channel, at 0.700.
We have a downtrend on the RSI indicator that is about to break and retest, supporting the upside.
There is a major support area in green at 0.688, which represents a strong basis for the upside.
Don't forget a simple thing: ease and capital.
When you reach the first target, save some money and then change your stop-loss order to an entry order.
For inquiries, please leave a comment.
We have a trend to hold above the 100 Moving Average.
Entry price: 0.745
First target: 0.769
Second target: 0.800
Third target: 0.840
Don't forget a simple thing: ease and capital.
When you reach your first target, save some money and then change your stop-loss order to an entry order.
For inquiries, please leave a comment.
Thank you.