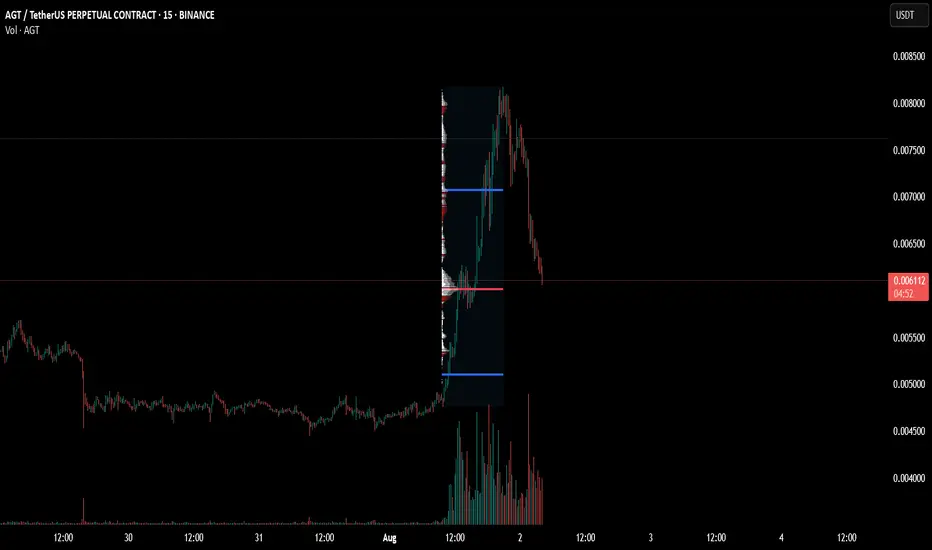
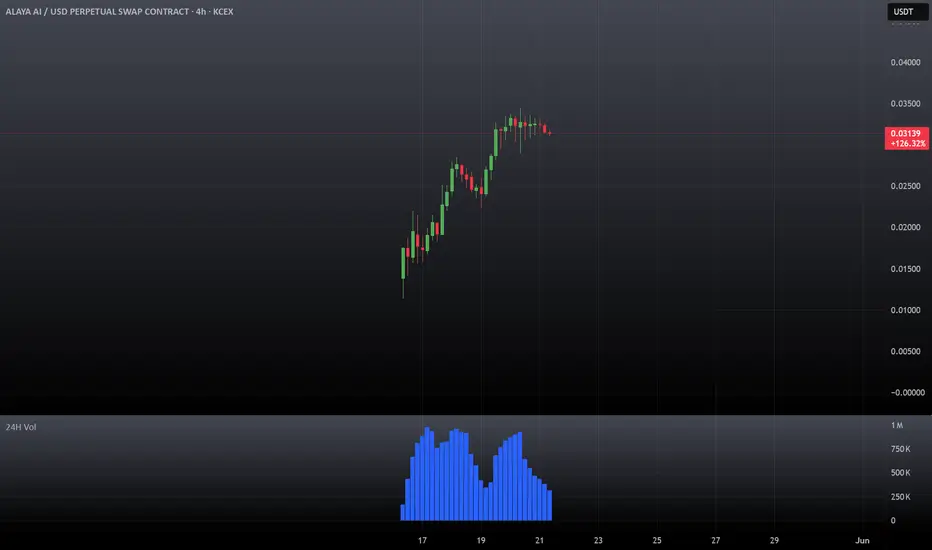
AGTUSDT Forming Bullish MomentumAGTUSDT is forming a clear bullish momentum pattern, a classic bullish wave signal that often indicates an upcoming breakout. The price has been consolidating within a narrowing range, suggesting that selling pressure is gradually weakening while buyers are beginning to regain control. With consistent trading volume confirming accumulation at lower levels, the current setup hints at a potential bullish breakout in the near future. The projected move could lead to an impressive gain of around 140% to 150% once the price breaks above the key resistance level.
This bullish momentum pattern is typically seen at the end of downtrends or corrective phases, representing a potential shift in market sentiment from bearish to bullish. Traders closely watching AGTUSDT are noticing strengthening momentum as the price approaches a critical breakout zone. Strong trading volume adds confidence to this setup, showing that market participants are positioning early in anticipation of a sustained upward move.
Growing investor interest in AGTUSDT reflects increasing confidence in the project's long-term fundamentals and its improving technical outlook. If the breakout is confirmed with sustained buying volume, it could mark the beginning of a fresh bullish leg. The ongoing consolidation phase suggests steady accumulation, creating favorable conditions for a strong continuation rally once the resistance level is cleared.
Traders may find this an attractive medium-term opportunity, especially as the bullish momentum pattern nears completion and buying pressure continues to build. A confirmed breakout could attract additional market participation and accelerate the move toward the projected upside target.
✅ Show your support by hitting the like button.
✅ Leaving a comment below! (What is You opinion about this Coin)
Your feedback and engagement keep me inspired to share more insightful market analysis with you!
Alaya AI / USDT
No trades
No trades
In-depth trading ideas
SHORT AGT1. Price has changed structure at the Premium
2. We have a strong pd array pushing price down at the M30 SIBI C.E + M45 SIBI LowerQ+FVG Monthly C.E
3. We have a good imbalance at discount to draw to
4. We have additional eq lows to purge at discount and FVG weekly C.E (good price to collapse short orders)
AGT/USDT — Breakout Formation from Accumulation Zone ImminentAGT/USDT — Breakout Formation from Accumulation Zone Imminent 🚀
AGT has entered a strong accumulation zone after a prolonged downtrend, showing the first technical signs of a potential trend reversal. The current consolidation within the highlighted support block suggests that buyers are stepping in, preparing for a possible breakout phase.
Low time frame confirmation is here
📊 Current Price: $0.0042
🟢 Accumulation Zone: $0.0038 – $0.0045
🔹 Breakout Target: $0.038
The chart shows a typical bottoming structure, with a long accumulation base forming under historical resistance. Once AGT confirms a breakout above $0.006, momentum could accelerate rapidly — targeting the $0.02 → $0.038 zones.
This setup mirrors classic early-cycle patterns seen before major upward expansions in similar low-cap assets. A strong breakout candle with volume will serve as confirmation of the next phase.
📈 Technical Outlook:
Accumulation structure in place
Breakout trigger above $0.006–$0.007
Main breakout target around $0.038
Summary:
AGT/USDT is building strength at the bottom of its range. If volume confirms, a major reversal cycle could be underway, opening the path toward a breakout to $0.038 and beyond.
🎯 Targets: $0.02 → $0.038
📊 Bias: Bullish — Breakout Setup Forming
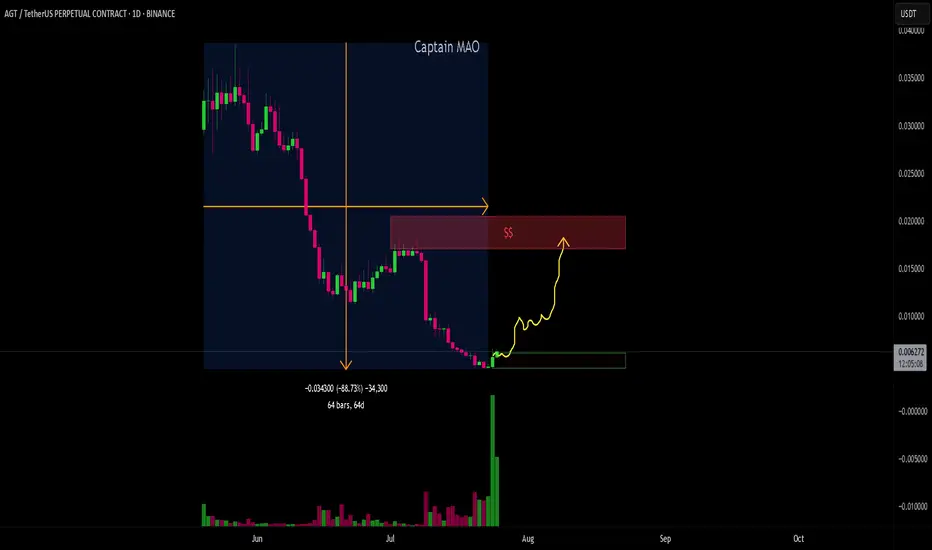
AGT/USDT +300%Since its listing on May 20, 2025, AGT/USDT has been under heavy selling pressure, resulting in a sharp ~90% decline over the past month. Such deep corrections often represent capitulation phases, clearing out weak hands and setting the stage for a reversal.
Currently, price action is showing signs of stabilization and strong base support formation. A liquidity grab and sweep has already taken place, further confirming that sellers may be exhausted.
The most strategic approach here is to DCA entries within the highlighted green box positioning early for a potential recovery leg once momentum shifts.
AGTUSDT.P LONGLets see some strong bullish moments at our entries level and most important we need to retest it with bullish candles. If not spotted than BOTTOM level is our point.
Let me give you guys the brief why i have chosen these two entries level as we can all see its forming a W pattern at this level. If price shows bullish momentum at these level than probably we are forming W.
Rest DYOR.
Follow me and support me to post more analysis.
Thank you.
AGT/USDT - ReversalAGT/USDT has been under massive selling pressure since its listing on May 20, 2025, leading to a sharp ~90% decline. However, recent price action is showing strong signs of a potential reversal. Buyers have stepped in aggressively with a noticeable surge in volume, signaling a possible end to the downtrend. The current structure suggests the beginning of accumulation and a high-probability setup for a trend reversal. Targeting 0.018-0.02$ which huge liquidity can be found at this zone .
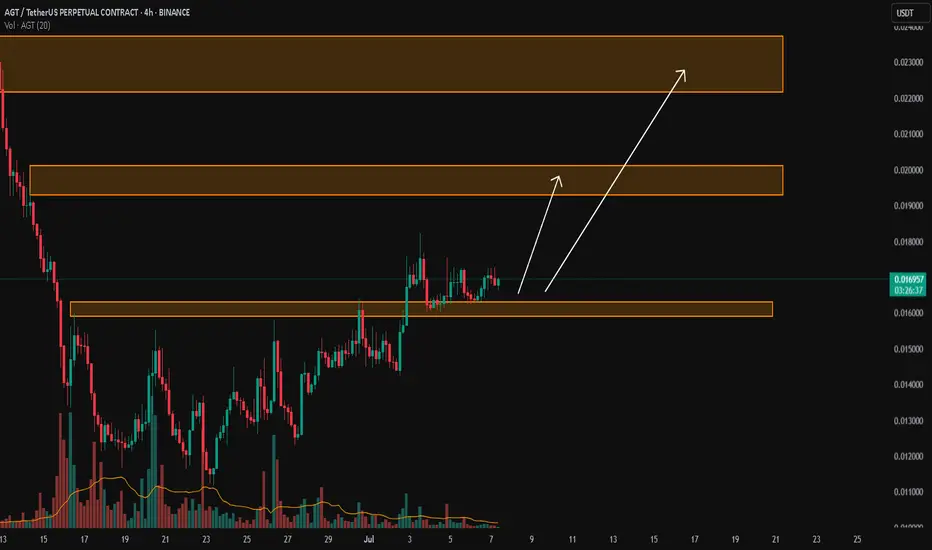
AGT/USDTKey Level Zone: 0.015900 - 0.016300
LMT v2.0 detected.
The setup looks promising—price previously trended upward with rising volume and momentum, then retested this zone cleanly. This presents an excellent reward-to-risk opportunity if momentum continues to align.
Introducing LMT (Levels & Momentum Trading)
- Over the past 3 years, I’ve refined my approach to focus more sharply on the single most important element in any trade: the KEY LEVEL.
- While HMT (High Momentum Trading) served me well—combining trend, momentum, volume, and structure across multiple timeframes—I realized that consistently identifying and respecting these critical price zones is what truly separates good trades from great ones.
- That insight led to the evolution of HMT into LMT – Levels & Momentum Trading.
Why the Change? (From HMT to LMT)
Switching from High Momentum Trading (HMT) to Levels & Momentum Trading (LMT) improves precision, risk control, and confidence by:
- Clearer Entries & Stops: Defined key levels make it easier to plan entries, stop-losses, and position sizing—no more guesswork.
- Better Signal Quality: Momentum is now always checked against a support or resistance zone—if it aligns, it's a stronger setup.
- Improved Reward-to-Risk: All trades are anchored to key levels, making it easier to calculate and manage risk effectively.
- Stronger Confidence: With clear invalidation points beyond key levels, it's easier to trust the plan and stay disciplined—even in tough markets.
Whenever I share a signal, it’s because:
- A high‐probability key level has been identified on a higher timeframe.
- Lower‐timeframe momentum, market structure and volume suggest continuation or reversal is imminent.
- The reward‐to‐risk (based on that key level) meets my criteria for a disciplined entry.
***Please note that conducting a comprehensive analysis on a single timeframe chart can be quite challenging and sometimes confusing. I appreciate your understanding of the effort involved.
Important Note: The Role of Key Levels
- Holding a key level zone: If price respects the key level zone, momentum often carries the trend in the expected direction. That’s when we look to enter, with stop-loss placed just beyond the zone with some buffer.
- Breaking a key level zone: A definitive break signals a potential stop‐out for trend traders. For reversal traders, it’s a cue to consider switching direction—price often retests broken zones as new support or resistance.
My Trading Rules (Unchanged)
Risk Management
- Maximum risk per trade: 2.5%
- Leverage: 5x
Exit Strategy / Profit Taking
- Sell at least 70% on the 3rd wave up (LTF Wave 5).
- Typically sell 50% during a high‐volume spike.
- Move stop‐loss to breakeven once the trade achieves a 1.5:1 R:R.
- Exit at breakeven if momentum fades or divergence appears.
The market is highly dynamic and constantly changing. LMT signals and target profit (TP) levels are based on the current price and movement, but market conditions can shift instantly, so it is crucial to remain adaptable and follow the market's movement.
If you find this signal/analysis meaningful, kindly like and share it.
Thank you for your support~
Sharing this with love!
From HMT to LMT: A Brief Version History
HM Signal :
Date: 17/08/2023
- Early concept identifying high momentum pullbacks within strong uptrends
- Triggered after a prior wave up with rising volume and momentum
- Focused on healthy retracements into support for optimal reward-to-risk setups
HMT v1.0:
Date: 18/10/2024
- Initial release of the High Momentum Trading framework
- Combined multi-timeframe trend, volume, and momentum analysis.
- Focused on identifying strong trending moves high momentum
HMT v2.0:
Date: 17/12/2024
- Major update to the Momentum indicator
- Reduced false signals from inaccurate momentum detection
- New screener with improved accuracy and fewer signals
HMT v3.0:
Date: 23/12/2024
- Added liquidity factor to enhance trend continuation
- Improved potential for momentum-based plays
- Increased winning probability by reducing entries during peaks
HMT v3.1:
Date: 31/12/2024
- Enhanced entry confirmation for improved reward-to-risk ratios
HMT v4.0:
Date: 05/01/2025
- Incorporated buying and selling pressure in lower timeframes to enhance the probability of trending moves while optimizing entry timing and scaling
HMT v4.1:
Date: 06/01/2025
- Enhanced take-profit (TP) target by incorporating market structure analysis
HMT v5 :
Date: 23/01/2025
- Refined wave analysis for trending conditions
- Incorporated lower timeframe (LTF) momentum to strengthen trend reliability
- Re-aligned and re-balanced entry conditions for improved accuracy
HMT v6 :
Date : 15/02/2025
- Integrated strong accumulation activity into in-depth wave analysis
HMT v7 :
Date : 20/03/2025
- Refined wave analysis along with accumulation and market sentiment
HMT v8 :
Date : 16/04/2025
- Fully restructured strategy logic
HMT v8.1 :
Date : 18/04/2025
- Refined Take Profit (TP) logic to be more conservative for improved win consistency
LMT v1.0 :
Date : 06/06/2025
- Rebranded to emphasize key levels + momentum as the core framework
LMT v2.0
Date: 11/06/2025
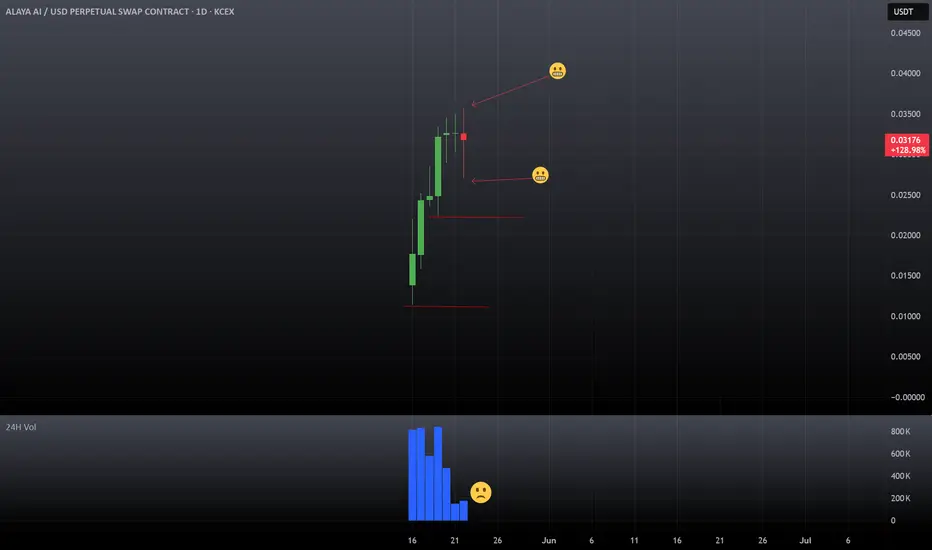
Pump and Dump🚨 Market Update – AGT Traders Beware 🚨
On May 21, Binance saw $141.14K in short liquidations vs. $90.47K in longs.
Today, just on Gate.io, there were a whopping $609.92K in long liquidations.
Overall volume remains low compared to previous days - signaling weak momentum and increased risk.
📅 On June 1, 82.35M AGT tokens (~$2.57M) will be unlocked.
⚠️ Expect high volatility - potential pump and dump scenarios.
Stay cautious out there.
Caution is advisedThe token is still 72% locked (3.6B AGT) - which means a huge potential supply is waiting to hit the market.
- Only 28% (1.4B AGT) is unlocked.
- 72% (3.6B AGT) will eventually enter the market.
- If even a fraction of that gets dumped, the price can tank hard.
With most tokens locked, current trading volumes can be manipulated easily.
Price pumps now could just be whales playing with a small float.