AIUSDT 1D#AI is moving inside a descending triangle pattern on the daily chart.
In case of a breakout above the triangle resistance and the Ichimoku cloud, the potential upside targets are:
🎯 $0.0272
🎯 $0.0303
🎯 $0.0333
🎯 $0.0376
🎯 $0.0431
⚠️ Always remember to use a tight stop-loss and maintain proper risk management.
In-depth trading ideas
AIUSDT: Confirming Sustainable Growth Structure
AIUSDT is outlining an incredibly standard growth scenario, evidencing a strong capital breakout in 2026. To date, the asset has recorded a 20% growth since our last strategic analysis. The key technical highlight lies not just in the numbers, but in how the price moved: a decisive breakout from the downtrend, followed by a precise retest of the old boundary before continuing its upward journey. This is a high-authenticity accumulation model, showing that old barriers have now become a solid fo
AI/USDT - Massive Breakout After a Long Downtrend?📊 The AI/USDT 2D timeframe chart is currently showing a very interesting structure after experiencing a prolonged decline since early 2025. Price is now testing a major trendline resistance that has been suppressing price movement for months.
🔥 If a breakout occurs successfully, the potential for a trend reversal and a major rally could open up. However, if the breakout fails, the market may continue its bearish pressure.
---
📉 Chart Pattern Analysis
📌 This chart is forming a Descending Resi
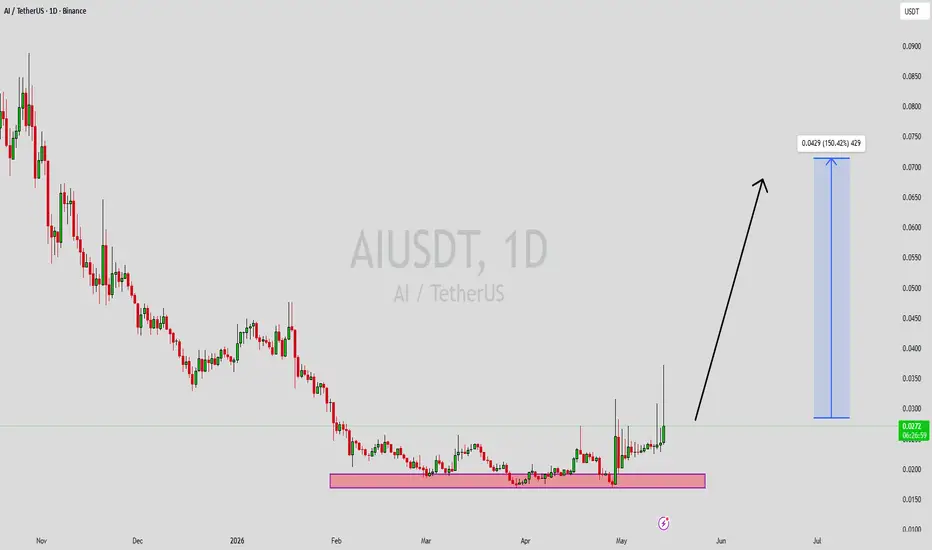
AIUSDT Forming Bullish MomentumAIUSDT is forming a clear bullish momentum pattern, a classic bullish continuation signal that often indicates a strong breakout may be approaching. The price has been consolidating within a tightening range, suggesting that bearish pressure is gradually weakening while buyers continue to regain strength near key support zones. This type of structure is commonly seen before major upward moves as momentum steadily shifts back in favor of the bulls.
The projected breakout from this bullish moment
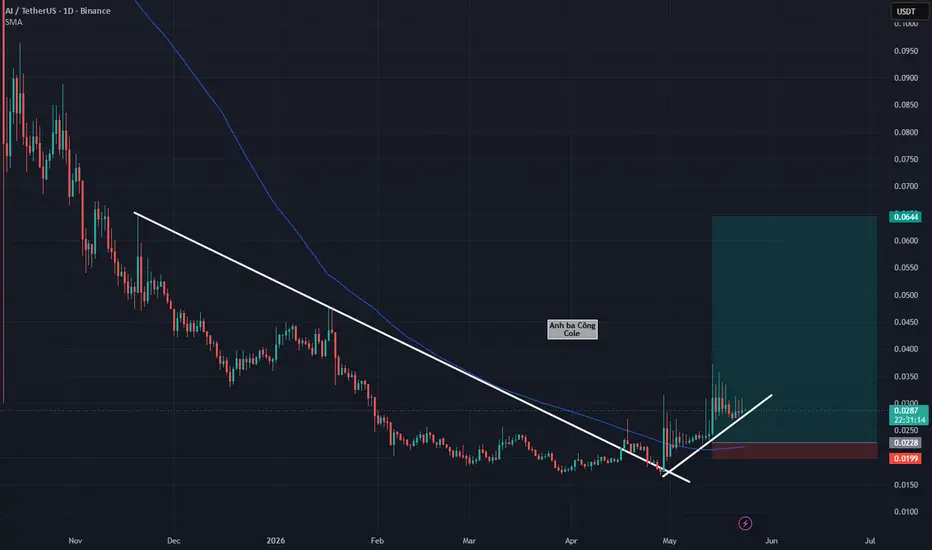
AI: A Golden Opportunity After the Surge
AI is currently demonstrating a textbook technical movement that our community frequently monitors. After successfully breaking out of a long-term downtrend and performing a precise retest, the price exploded with an impressive 80% growth. Currently, although we observe long upper wicks as the price approaches the 0.03 zone—a result of short-term profit-taking—this is actually a golden accumulation opportunity for those who missed the previous wave.
Looking at the chart , the most notable poin
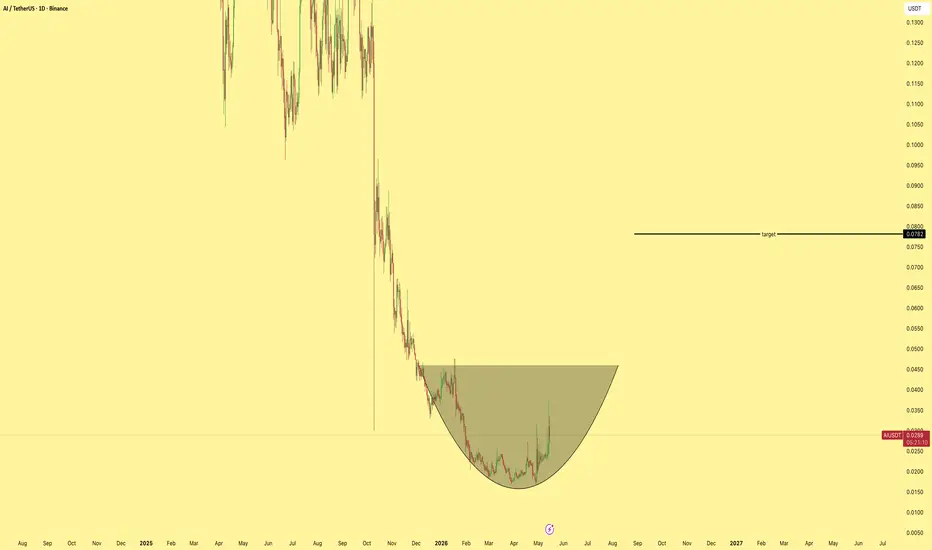
Sleepless AI—Market Cycles, Repeating Dates, Financial AstrologyHere you have the logarithmic chart, a single move, a downtrend, starting March 2024.
Compare this to the linear chart above. The main drop ends August 2024. A dead cat bounce followed by another drop ending April 2025. The ensuing action can hardly be called a downtrend.
Late April 2026 we have the highest volume ever by far, the chart is flat and this signals the start of a new market phase.
All the charts I've been showing you can be looked at through the linear scale and you get a comple
AI/USDT- Recovery phase AI/USDT has completed an extended corrective move and is now forming a solid base support. Price action has shifted from aggressive selling to stabilization and compression, a typical precursor to a recovery phase.
ALong
AIUSDT 1D#AI is moving inside a falling wedge pattern on the daily chart and has bounced off the wedge support line. In case of a breakout above the wedge resistance and the daily EMA100, the potential targets are:
🎯 $0.1299
🎯 $0.1654
🎯 $0.2210
🎯 $0.2659
🎯 $0.3107
🎯 $0.3747
🎯 $0.4561
⚠️ Always remember to use a tight stop-loss and maintain proper risk management.
AIUSDT (2D) — Entering a Major Accumulation Phase?Overview:
AIUSDT is currently in a deep accumulation phase after a long decline from the peak at 0.8608. Price is consolidating within the critical support zone of 0.0963 – 0.1257 (highlighted in yellow). This level has been tested multiple times, showing strong interest from both buyers and sellers.
On the 2D timeframe, the structure suggests that the market is waiting for a decisive move: will this support hold as the base for a reversal, or will it break down to extend the bearish trend?
--
AI ANALYSIS🔮#AI Analysis 💰💰
#AI is trading in a symmetrical triangle in a weekly time frame and if it breakouts with high volume then we can see a bullish momentum in #AI. Before that we will see little bit bearish movement .
🔖 Current Price: $0.1490
⏳ Target Price: $0.2100
⁉️ What to do?
- We can trade according to the chart and make some profits in #AI. Keep your eyes on the chart, observe trading volume and stay accustom to market moves.💲💲
#AI #Cryptocurrency #Pump #DYOR
AI/USDT – Bullish Breakout: Falling Wedge Targets +130%AI has broken out of a multi-month falling wedge pattern, with confirmation from a strong daily candle closing above the descending trendline. Current price is 0.1501 USDT, showing renewed buying pressure post-breakout.
The measured move from the wedge projects a potential target near 0.30 USDT (+130% from the breakout zone). Price action remains constructive, with breakout momentum suggesting potential continuation if support holds.
Key levels:
Breakout zone: ~0.1487 USDT
Projected targets:
•
AIUSDT Forming Bullish PennantAIUSDT is currently forming a bullish pennant pattern, a continuation setup that typically signals the market is preparing for another strong upward move after an initial rally. This consolidation phase shows that buyers are holding control, with price coiling into a tighter range before a potential breakout. With steady volume supporting the pattern, the setup indicates that a significant bullish move may be imminent once resistance levels are cleared.
The projected gain of 90% to 100%+ reflec
AIUSDT – Consolidation at Demand Zone: Accumulation or Bearish?⏳ Current Market Context
AIUSDT is at a critical juncture, consolidating within the demand zone of $0.096 – $0.124 (yellow box). This zone has been repeatedly tested since June 2025, making it a last line of defense for buyers before a potential deeper drop.
While the macro structure remains bearish (since the Dec 2024–Jan 2025 peak, price has printed continuous lower highs), a potential accumulation base is forming here, which could serve as a turning point if confirmed with strong breakout vo
Sleepless AI · It is all in your mindSee here the chart for Sleepless AI (AIUSDT). This is long-term.
Notice the volume this week. Really high bearish volume and a red candle. Why isn't this considered a bearish signal? Because the wick low this week is higher compared to the main low in June and the previous low in April. It can also happen that the week ends up closing green tomorrow.
A year long bear market leads to a strong bottom pattern and consolidation phase. It has been many months since AIUSDT got out of its downtrend,
$AI - LONG SETUPBINANCE:AIUSDT.P
NYSE:AI
⚠️ HIGH RISK TRADE
Recommended Leverage: 25x
🟢 LONG
Expecting the price to bounce from the white lines support.
📈 ENTRY: If 4H CC above (0.11880), DCA (0.11752)
🎯 TAKE PROFIT: Yellow Lines
🛑 STOP LOSS: 0.11616 (📊 4H Candle Close Below)
⚠️ High Risk – Manage Your Position Wisely!
📌 NFA – DYOR 🧠
ALong
AIUSDT 1D#AI is moving inside a descending triangle pattern on the daily chart and is currently holding above the daily SMA50.
📌 Consider buying at the current level and again near the support zone if the SMA50 is lost and a daily candle closes below it.
In case of a breakout above the triangle resistance and the daily SMA100, the potential upside targets are:
🎯 $0.1624
🎯 $0.1954
🎯 $0.2260
🎯 $0.2565
🎯 $0.3001
🎯 $0.3556
⚠️ As always, use a tight stop-loss and apply proper risk management.
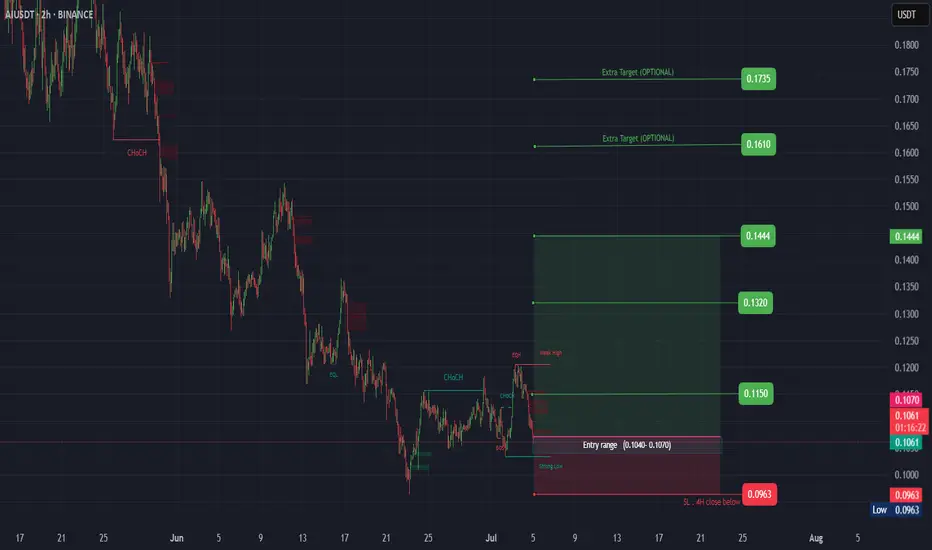
AI ( SPOT )BINANCE:AIUSDT
#AI/ USDT
Entry( 0.1040- 0.1070)
SL 4H close below 0.0963
T1 0.1150
T2 0.1320
T3 0.1444
_______________________________________________________
Golden Advices.
********************
* collect the coin slowly in the entry range.
* Please calculate your losses before the entry.
* Do not enter any trade you find it not suitable for you.
* No FOMO - No Rush , it is a long journey.
AI Looks Bullish (12H)The AI correction has started from the point marked as "start" on the chart.
It seems that wave C has completed, as its time cycle has finished and the price has reclaimed key levels.
As long as the green zone holds, the price can move toward the targets and the red box.
The targets are marked on the chart.
A daily candle closing below the invalidation level will invalidate this analysis.
For risk management, please don't forget stop loss and capital management
Comment if you have any quest