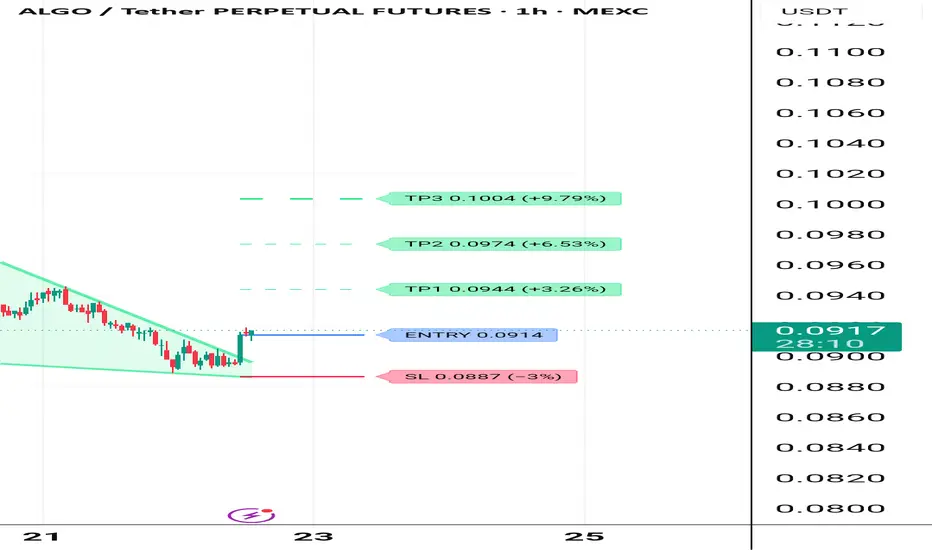
#ALGOUSDT - this will go up#ALGO
The price is moving within a descending channel on the 1-hour timeframe and has reached the lower boundary. It is now poised for a bounce and is expected to retest this boundary.
The Relative Strength Index (RSI) indicates a downward trend, which is likely to continue given the overbought conditions.
There is a key support zone in green at 0.0806. The price has bounced off this zone several times, making it a strong support level.
The price is trending towards the 100-period moving average, which we are approaching. This trend supports an upward move.
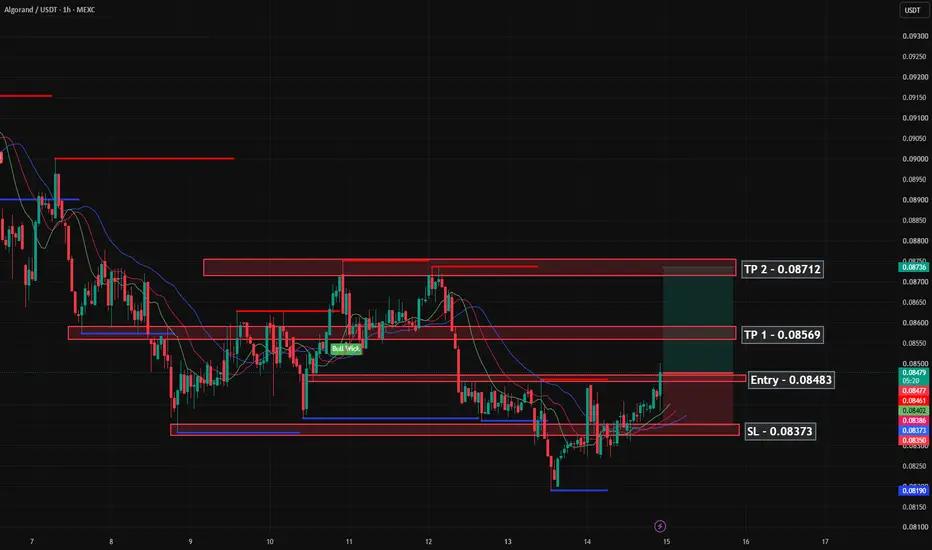
Entry Price: 0.0831
Target 1: 0.0841
Target 2: 0.0849
Target 3: 0.0860
Stop Loss: At the resistance zone in green
Remember this simple rule: Money management.
Any questions? Please leave a comment.
Thank you.
In-depth trading ideas
Algorand is tightening into a major decision point.EURONEXT:ALGO has been grinding lower inside a descending structure, but the latest consolidation is forming directly above a well-defended support zone. Sellers are losing momentum as volatility contracts and price presses against the descending trendline.
The Synergy Signal oscillator is rotating higher, showing improving momentum beneath the surface. However, confirmation still requires a clean breakout from the falling resistance with stronger volume.
A brief liquidity sweep below support remains possible before a recovery. If support holds and ALGO breaks the local range high, the volume profile suggests room to rotate into the next major supply zone.
For now, the setup is neutral with an improving bullish bias, but the breakout must be confirmed.
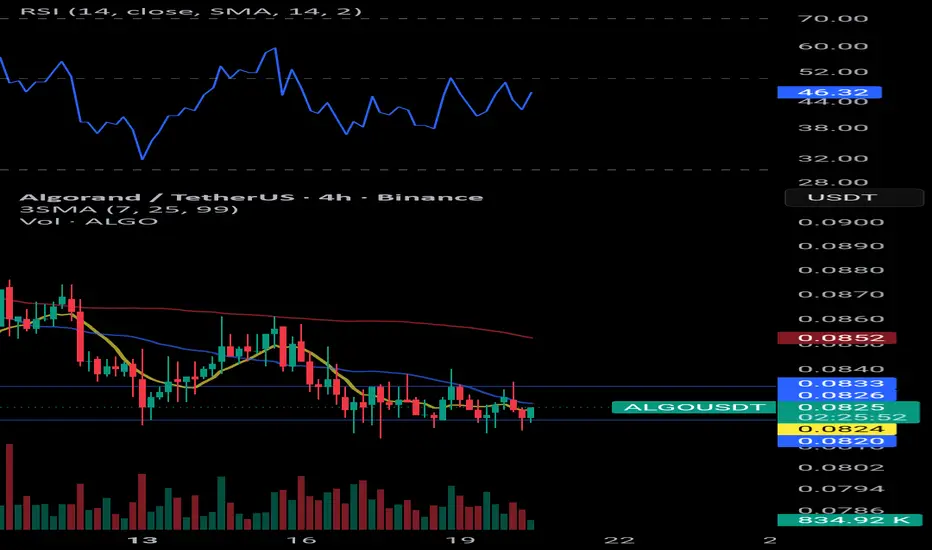
ALGOUSDT ALGOUSDT is currently bearish on the 4-hour timeframe. Price is ranging around the key support at 0.0820. A confirmed breakdown below this level could trigger a new bearish leg.
On the upside, the range high is located at 0.0833. A confirmed close above this level could signal the beginning of a bullish move. However, for a higher-probability long setup, it is better to wait for the market to establish a higher high and a higher low.
Since the market is trading inside a well-defined range, traders may also consider a breakout strategy in either direction, provided proper risk management is applied
#ALGOUSDT - this will go up#AGLO
The price is moving within a descending channel on the 1-hour timeframe and has reached the lower boundary. It is now poised for a bounce and is expected to retest this boundary.
The Relative Strength Index (RSI) indicates a downward trend, which is likely to continue given the overbought conditions.
There is a key support zone in green at 0.0806. The price has bounced off this zone several times, making it a strong support level.
The price is trending towards the 100-period moving average, which we are approaching. This trend supports an upward move.
Entry Price: 0.0831
Target 1: 0.0841
Target 2: 0.0849
Target 3: 0.0860
Stop Loss: At the resistance zone in green
Remember this simple rule: Money management.
Any questions? Please leave a comment.
Thank you.
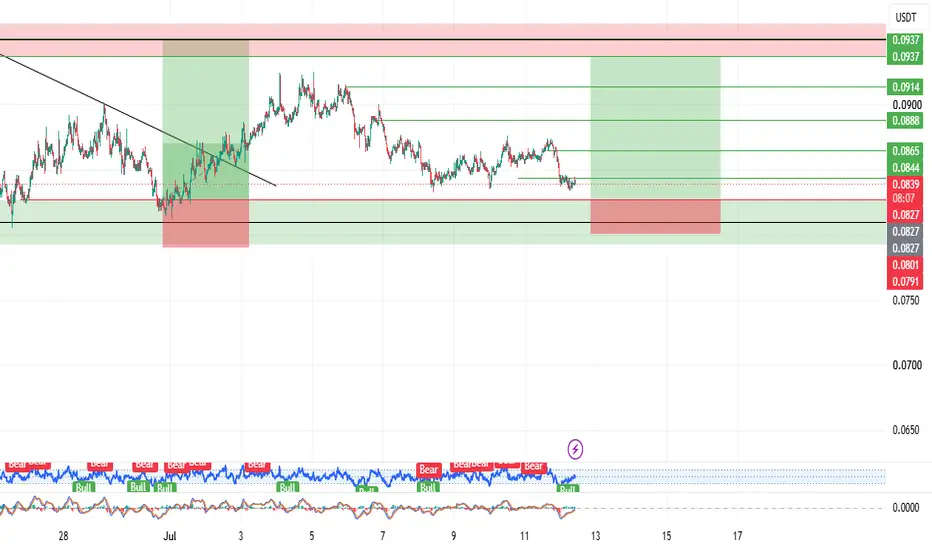
ALGO USDT LONG SIGNAL#52. ALGO/USDT – Trade Setup (LONG)
📈 Position Type: LONG
🕒 Timeframe: 1 H
📊 Market: Futures
💰 Entry Zone:
0.0827
🛑 Stop-Loss:
0.0800
🎯 Take-Profit Targets:
• TP1: 0.0844
• TP2: 0.0865
• TP3: 0.0888
• TP4: 0.0914
TP5: 0.0937
TP6:
⚙️ Leverage:
5- 10
⚠️ After reaching TP1, move Stop-Loss to Entry Price.
📌 Risk Management:
Risk only 1–2% of your capital per trade.
Always confirm the setup on your chart before entry
ALGO 8H – Macro Trendline Test After Extended DeclineALGO on the 8H timeframe is currently trading around 0.0849 after a sustained decline from the June high near 0.1360, with price now pressing directly into a macro rising trendline that has connected every significant low since late March and is currently sitting near 0.0815–0.0820.
The chart shows a rising trendline originating from the late March low near 0.0776, touching the early April low and extending across the entire visible structure as the macro support floor. Price rallied from that trendline through April and into a high near 0.1270–0.1300 in early May before pulling back, recovering again into a second high near 0.1360 in early June, and then selling off sharply and without meaningful recovery through the rest of June and into July. That decline has brought price through the 0.1060–0.1100 zone, through the 0.0875–0.0900 support area, and now directly into the macro trendline near 0.0815–0.0820. Two horizontal reference levels sit just above, one near 0.0855–0.0875 and a second near 0.0875–0.0900, both of which have flipped from support to resistance following the breakdown through them.
The current test of the macro trendline near 0.0815–0.0820 is the first since the late March origin point, and unlike the prior two highs which both launched from well above this level, price has arrived at the trendline after an extended and steep decline with no meaningful bounces along the way.
Key Levels To Watch
→ 0.1340–0.1360 – June high, major resistance above
→ 0.1220–0.1270 – Prior recovery high, resistance
→ 0.1060–0.1100 – Prior support zone, now resistance
→ 0.0875–0.0900 – Broken support, now resistance
→ 0.0855–0.0875 – Horizontal pivot, immediate resistance
→ 0.0815–0.0820 – Macro rising trendline, current test (dynamic)
→ Below 0.0776 – Trendline breakdown, full macro structural failure
A hold at the macro trendline near 0.0815–0.0820 and a recovery back above 0.0855–0.0875 would keep the structure that has defined every major low since March intact, opening a move toward 0.0875–0.0900 and potentially 0.1060–0.1100 on a more sustained recovery.
A confirmed 8H close below the macro trendline near 0.0815 would be the first structural break of this trendline since its origin in late March, removing the only remaining floor on this chart and opening downside toward 0.0776 and below with no clear support beneath.
First macro trendline test after an extended decline, most important level on this chart. Hold 0.0815–0.0820 → structure intact, recovery open toward 0.0875–0.0900. Lose trendline on confirmed close → macro structural break, downside toward 0.0776 and below. Bias neutral to cautiously bullish at trendline. Shift bearish only on confirmed close below 0.0815–0.0820.
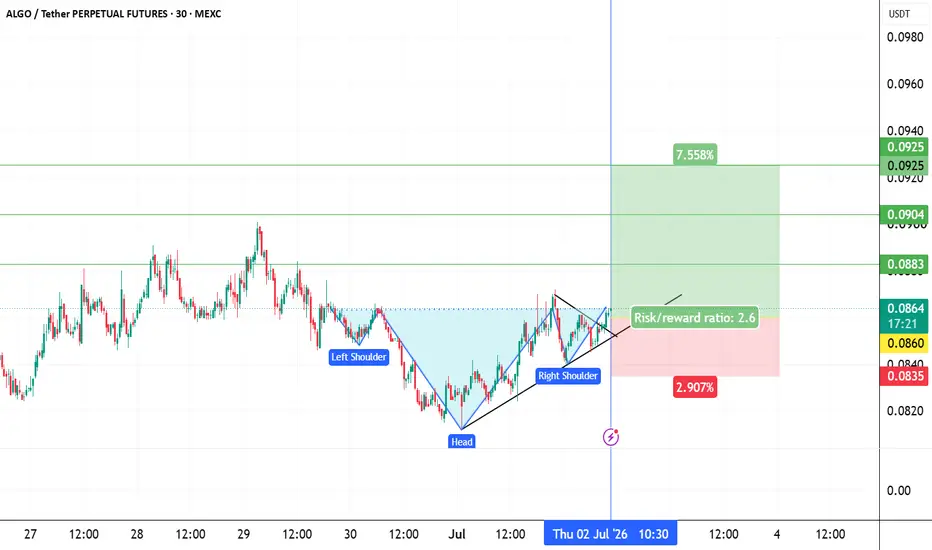
Algousdt long Roddy01-SIGNALSPROVIDERInstructions:
Entry point: yellow
Stop loss: red
Take profit: green
👉Leverage x 5-10-20 for crypto
👉Leverage x 20-50-100 for commodities, stocks, indices, and forex
👉Margin 1-5% max.
Always practice risk and money management.
Invest a maximum of 5% on any trade or across all your trades.
Invest only what you can afford to lose, as no one is in control of the market.
👉Our analyses are primarily based on:
breakouts: two trend lines (ascending and descending) and a line indicating a horizontal breakout.
chart patterns: shoulders and head, triangle parttern, elliott impulse, etc etc.
We don't always have the time to track them at all times or to represent them visibly, given the numerous signals, the number of channels to manage, and especially because of the often rapid pace of market movements.
indicators: We associate at least two indicators with this technique.
👉Depending on the circumstances, we use specific indicators, often setting 3 or more take profit levels.
👉Indeed, there are good days in trading and also bad days. No one can promise to win every trade, and like all traders worldwide, we also experience stop-loss orders. However, we win more than we lose and remain positive.
👉You can close the position before or after the take profit orders indicated by the green lines if you are personally satisfied; the same applies to stop loss orders.
👉We must stay positive, clear-headed, and humble.
we cannot provide all instructions or all trades here on this channel.
Good luck to us all, and may God guide us. Amen.
ALGOUSDTALGO is currently testing a major weekly support zone — a level that has previously attracted strong buying interest.
Bullish scenario: If buyers defend this support and price reclaims momentum, we could see a relief rally toward the next resistance levels.
Bearish scenario: A confirmed breakdown below this zone would likely open the door for further downside .
ALGO USDT LONG SIGNALALGO/USDT – Trade Setup (LONG)
📈 Position Type: LONG
🕒 Timeframe: 1 H
📊 Market: Futures
💰 Entry Zone:
0.0826
0.0810
🛑 Stop-Loss:
0.0790
🎯 Take-Profit Targets:
• TP1: 0.0842
• TP2: 0.0865
• TP3: 0.0892
• TP4: 0.0919
TP5: 0.0950
TP6:
⚙️ Leverage:
5-3
⚠️ After reaching TP1, move Stop-Loss to Entry Price.
📌 Risk Management:
Risk only 1–2% of your capital per trade.
Always confirm the setup on your chart before entry
ALGO 4H – Symmetrical Triangle Compression at ApexALGO on the 4H timeframe is currently trading around 0.1047 after a sharp decline from the June high near 0.1360, with price now compressing into the apex of a symmetrical triangle formed between a descending trendline from above and a rising trendline from below.
The chart shows price spiking to a high near 0.1360 in early June before reversing hard and dropping into the 0.0860–0.0900 region. From that decline, a descending trendline connects the early June high through subsequent lower highs, while a separate rising trendline extends from the late April lows near 0.0840 through higher lows formed across May and June. The two lines have converged into a symmetrical triangle, with price action increasingly compressed inside the structure over the past several sessions. The horizontal level near 0.0842 has acted as a recurring reference point at the base of the pattern and is currently being tested again as the triangle reaches its apex.
Price is now trading directly at the apex of the triangle with both trendlines converging within a very narrow range, leaving little room before a decisive move in either direction.
Key Levels To Watch
→ 0.1360 – June spike high, major resistance above
→ 0.1230–0.1270 – Prior consolidation zone, resistance
→ 0.1010–0.1040 – Mid-range resistance, descending trendline overlap
→ 0.0900–0.0930 – Recent recovery high, resistance
→ 0.0860–0.0880 – Triangle apex zone, current price
→ 0.0842 – Horizontal support, current test
→ Below 0.0820 – Triangle breakdown, no clear support visible
A break above the descending trendline with a reclaim of 0.0900–0.0930 would signal a bullish resolution out of the triangle, opening a move toward 0.1010–0.1040 and potentially 0.1230–0.1270 on continuation.
A confirmed break below 0.0842 and the rising trendline would signal a bearish resolution, with no clear horizontal support visible below and downside likely extending toward 0.0750–0.0780 on continuation.
Triangle at apex, breakout imminent in either direction. Break up through trendline and 0.0900 → recovery toward 0.1010–0.1040. Break down through 0.0842 → downside opens toward 0.0750–0.0780. Bias neutral inside compression. Direction confirmed only on a decisive break of either trendline.
Algorand—ALGOUSDT 8X LONG with 2,448% profits potentialThe same chart setup from Feb-March is being repeated, ALGO is back trading within its bottom range but with a slight higher low.
To me, this chart setup looks perfect. Great prices and timing. The action happening right above support makes for a great entry and this doesn't repeat very often. A new bullish wave can start within days. Maximum bullishness next week—right away.
See the full trade-numbers below:
_____
LONG ALGOUSDT
Leverage: 8X
Potential: 2448%
Allocation: 5%
Entry zone: $0.0870 - $0.0980
Targets:
1) $0.1047
2) $0.1202
3) $0.1455
4) $0.1865
5) $0.2118
6) $0.2528
7) $0.3190
8) $0.3855
Stop: Close weekly below $0.0865
_____
There is always high risk when trading Cryptocurrencies or any other financial instrument. Please keep this in mind before taking action. It is a complex game meant for adults. Lots can be gained but also all can be lost.
Namaste.
Algousdt long Roddy01-SIGNALSPROVIDER Instructions:
Entry point: yellow
Stop loss: red
Take profit: green
👉Leverage x 5-10-20 for crypto
👉Leverage x 20-50-100 for commodities, stocks, indices, and forex
👉Margin 1-5% max.
Always practice risk and money management.
Invest a maximum of 5% on any trade or across all your trades.
Invest only what you can afford to lose, as no one is in control of the market.
👉Our analyses are primarily based on:
breakouts: two trend lines (ascending and descending) and a line indicating a horizontal breakout.
chart patterns: shoulders and head, triangle parttern, elliott impulse, etc etc.
We don't always have the time to track them at all times or to represent them visibly, given the numerous signals, the number of channels to manage, and especially because of the often rapid pace of market movements.
indicators: We associate at least two indicators with this technique.
👉Depending on the circumstances, we use specific indicators, often setting 3 or more take profit levels.
👉Indeed, there are good days in trading and also bad days. No one can promise to win every trade, and like all traders worldwide, we also experience stop-loss orders. However, we win more than we lose and remain positive.
👉You can close the position before or after the take profit orders indicated by the green lines if you are personally satisfied; the same applies to stop loss orders.
👉We must stay positive, clear-headed, and humble.
we cannot provide all instructions or all trades here on this channel.
Good luck to us all, and may God guide us. Amen.
Algorand—ALGOUSDT 4X LONG with 1,272% profits potentialThe same chart setup from Feb-March is being repeated, ALGO is back trading within its bottom range but with a slight higher low. This is a new opportunity, a second chance—the market always offers a second chance.
The last bullish move produced more than 70% growth and now we have the same setup but chart conditions can be interpreted as mixed. The action is happening below the November 2024 low but above February 2026. It is always mixed, there is no trading without risk.
While the current chart setup can break-down and all bullish potential lost, there is also the possibility of a strong bullish jump. In fact, the risk is very low while growth potential is huge.
The descending trendline starting from July 2025 has been broken. ALGOUSDT looks like is moving through a transition phase. We can call it a bottom process, consolidation at support or accumulation, it is all the same.
There is no certainty when it comes to the financial markets, anything can happen. We are betting up. Algorand looks primed to grow.
See the full trade-numbers below:
_____
LONG ALGOUSDT
Leverage: 4X
Potential: 1272%
Allocation: 5%
Entry zone: $0.0795 - $0.0940
Targets:
1) $0.1047
2) $0.1202
3) $0.1455
4) $0.1865
5) $0.2118
6) $0.2528
7) $0.3190
8) $0.3855
Stop: Close weekly below $0.0790
_____
Trading strategy: How to approach this chart and trading pair? Buy and hold, the market takes care of the rest. Buy and hold, consider securing profits after the fifth target, or higher.
Thank you for reading.
Namaste.
Buy entry Algo Long time i actually put a trade on crypto. But the signals show me what i want to see.
- Retest trendline
-Weekly liquidity taken
-Daily zone to be filled
-4 hour zone and doji to be filled in zone of entry
- internal higher high
- to have an uptrend we need higher low
90% shure of this one
Rsi making higher highs
Bet 100 USD make 10 k
1/1 = break even
$algo deviated below last H4 candle and just a tad below the H4 21 which it reclaimed so assuming we close above this 21 ema or white squiggly line this is good to go with a stop under range low
targeting 1048-1054 for 50% the rest shall see
btc pair is just below the 200 ema with a little way down so shall see what that does as well.
bitty just under resistance of 64092 62400 good zone to bid so shall wait for now..
Algorand / TetherUSSmart Money Analysis of Algorand / TetherUS | ALGO/USDT
Hello dear followers,
In this analysis, we are going to review the Algorand / TetherUS — ALGO/USDT trading pair from the perspective of market structure, order flow, liquidity areas, and the Smart Money Concept approach.
For an accurate Smart Money analysis, looking at only one timeframe is not enough. We need to carefully study the price history, order flow, liquidity zones, structural breaks, and how price behaves near important levels.
Higher Timeframe Analysis
On the monthly timeframe, the price structure of this asset does not currently provide us with a clear and reliable view for making an entry decision.
Also, on the weekly timeframe, the historical price action is not clear enough for us to make a strong and realistic conclusion for entering the market.
For this reason, we are focusing on the daily timeframe to analyze the main structure, and we will use the 4-hour timeframe for execution and entry confirmation.
General Market View and Its Connection to Bitcoin
Based on our previous analyses of Bitcoin and Tether, we expect Bitcoin to potentially move into a bullish phase. During that move, Bitcoin may aim to hunt its main high and register a new price level.
Please pay attention, because this is the key point:
If Bitcoin moves upward and then, with a high probability, enters a larger correction afterward, many altcoins will need to act before Bitcoin begins its correction from that new price area.
Based on our previous data and market behavior, we believe that past market structure can provide important clues about the possible future path. Many altcoins, in order to survive and maintain strength during Bitcoin’s next correction, need to break their own main highs first and create a valid bullish structure.
Therefore, for assets like ALGO/USDT, breaking the main high, especially the monthly high, is very important. Creating a new bullish structure is a key factor for this market to show strength.
Main Scenario on the Daily Timeframe
At the moment, we are focusing on the daily timeframe.
In the current structure, we expect price to first break the marked low with a valid candle body close.
After that, price may create a new bearish order flow. This bearish order flow may be relatively small, but it is still important for the structure.
After the low is broken, we need to see the pattern that has been drawn on the chart forming at lower prices on the daily timeframe.
Then, if the market structure changes and a Major CHoCH is created, we can start considering the possibility of a more valid bullish move.
Entry Confirmation on the 4-Hour Timeframe
After the main structural shift, or the Major CHoCH, is confirmed on the daily timeframe, we will move to the 4-hour timeframe for a more accurate entry.
On this timeframe, we will look for stronger confirmations, such as:
Price reaction to important blocks
Liquidity collection before the main move
Confirmation candles and structures for a lower-risk entry
Suggested Entry Scenarios
For entering this type of structure, it is better not to rely on only one entry point.
Based on our trading style, two possible scenarios can be considered:
Scenario One: Entry at the Main Low After a Liquidity Hunt
In the first scenario, we look for an entry around the main low.
If the main low gets hunted and price shows the expected reaction, we can consider entering the market from that area.
Scenario Two: Entry from the Extreme Block
In the second scenario, we look for an entry from the Extreme Block.
This is the area where the main buy orders may be positioned, and where market makers may push price upward from.
Please note that we have already seen similar behavior near the high. In that case, price made a deceptive move to remove potential sellers and collect buy-side liquidity above the high, and then the market changed its main direction.
Important Note About Order Management
For this type of setup, we always evaluate entries with proper risk management.
That is why, instead of entering with a heavy position at one single level, it is better to set two controlled orders with calculated position sizes:
One order for the main low liquidity hunt scenario
One order for the reaction from the Extreme Block
This approach allows us to still have an entry opportunity if only one of the scenarios gets activated, while keeping the overall trade risk under control.
Potential Target
The main target of this analysis is based on the main market high.
If price is able to collect liquidity, create a structural shift, and then gain strong bullish momentum, a move toward the main high can become an important market objective.
By zooming in on the chart and reviewing the marked areas, the analysis will become clearer for you. You will be able to examine the structure, entry zones, stop-loss areas, and targets more accurately.
Analysis Summary
At the moment, we do not have enough confirmation for a rushed entry into the market.
However, if price first breaks the important low, collects liquidity, and then creates a Major CHoCH on the daily timeframe, we can look for lower-risk entries on the 4-hour timeframe.
Our two main scenarios are:
Entry after the main low liquidity hunt
Entry from the Extreme Block
In both cases, risk management, having a logical stop loss, and splitting the entry size are extremely important.
Risk Disclosure and Disclaimer
This analysis is provided only for educational purposes, market structure review, and sharing an analytical viewpoint. It should not be considered a guaranteed buy or sell signal.
Financial markets, especially the cryptocurrency market, are highly volatile and carry significant risk. Price may move against this analysis and may result in financial loss.
Therefore, any trading decision should be made based on your own strategy, risk management plan, risk tolerance, and independent analysis.
Before entering any trade, make sure to follow these rules:
Always have a clear stop loss.
Do not risk more than you can afford to lose.
Avoid emotional entries.
Adjust your position size based on your risk management plan.
Never treat any analysis as a certainty in the market.
The final responsibility for any buying, selling, or investment decision belongs to the individual trader.
Wishing you success and profitable trades.
Arash
A Retail Trader at Wall Street Forex Trading Center
#ALGOUSDT - this will go up#ALGO
The price is moving within a descending channel on the 1-hour timeframe and has reached the lower boundary. It is now poised for a bounce and is expected to retest this boundary.
The Relative Strength Index (RSI) indicates a downward trend, which is likely to continue given the overbought conditions.
There is a key support zone (in green) at 0.0921. The price has bounced off this zone several times, making it a strong support level.
The price is trending towards the 100-period moving average, which we are approaching. This trend supports an upward move.
Entry Price: 0.1030
First Target: 0.1058
Second Target: 0.1096
Third Target: 0.1149
Stop Loss: At the resistance zone (in green)
Remember this simple rule: Money Management.
Any questions? Please leave a comment.
Thank you.
$ALGO is starting to wake up…BINANCE:ALGOUSDT looking seriously constructive here 👀
After weeks of sluggish price action, ALGO finally pushed into a clean bullish expansion on the 1H chart. Buyers stepped in aggressively from the local base and price is now grinding just under the key resistance zone around $0.120 - $0.125.
The structure is simple
Higher lows + strong impulsive candles + breakout momentum. Bulls are clearly defending dips for now.
The chart shows a potential long setup from the $0.1138 demand zone, which lines up with the recent breakout base and short-term support area. As long as this zone holds, momentum still favors continuation.
Key levels
• Support: $0.1138
• Invalidation / SL: $0.1113
• Resistance: $0.1250 macro ceiling
• Target 1: $0.1186 ✅ nearly tapped
• Target 2: $0.1238 🎯
Price is currently trading right below resistance, so traders should expect some volatility and possible liquidity sweeps before continuation. A quick retest into the entry zone would actually strengthen the setup if buyers react again.
What makes this move interesting is the relative strength BINANCE:ALGOUSDT is showing despite broader market uncertainty. The recent SEC/CFTC commodity classification narrative, Revolut staking integration, and growing “quantum-proof blockchain” narrative are clearly bringing fresh attention back into the coin.
Volume expansion also supports the breakout. This doesn’t look like a random low-volume pump. Spot buyers are active.
That said, bulls still need a confirmed breakout above $0.125. That level is acting as the main liquidity wall right now. If price flips it into support, the next leg toward the $0.13+ region could accelerate fast 🚀
Right now?
Momentum favors the bulls, but resistance is still overhead.
Are traders finally rotating back into utility L1s like BINANCE:ALGOUSDT , or is this just another short-term relief rally? 🤔
#ALGOUSDT - this will go up#ALGO
The price is moving within a descending channel on the hourly timeframe. It has reached the lower boundary and is trending towards a bounce. A retest of this boundary is expected.
The Relative Strength Index (RSI) indicates a downward trend, and this trend is likely to continue due to the overbought condition.
A key support zone has been identified in green at 0.0980. The price has bounced off this zone several times, making it a strong support level.
The price is trending towards the 100-period moving average, which we are approaching. This trend supports an upward move.
Entry Price: 0.1090
First Target: 0.1121
Second Target: 0.1151
Third Target: 0.1197
You can close at the second target or wait for the third target to be reached. The choice is yours.
Stop Loss: At the resistance zone in green.
Remember this simple rule: Money Management.
Any questions, please leave a comment.
Thank you.
Algorand (ALGO) Looks Better & Closer To A 455% MoveAlgorand is looking good and with each passing day it looks better and closer to a 455% bullish wave, a challenge of the same price and high from December 2024. This is what the market has been preparing for all these months. Why do you think it is taking this long?
ALGOUSDT moved briefly below the October 2025 flush low as a liquidity hunt event, it stood there for almost two months then recovered. This is the cup pattern showed orange on the chart.
After recovering the October 2025 low as support, it has been sideways. Above the low from November 2024. The ground gained is being maintained.
This sideways period is the best possible ever, an easy trade. With this chart setup it is easy to buy and hold, a bullish wave will show up next.
This is an easy prediction. The downtrend ended months ago, then we have a bullish jump followed by sideways rather than a rejection. The initial jump is being consolidated before the market produces additional growth.
It is the same all over again. Prepare for bullish action. At some point, the entire market will grow.
This type of bullish chart setup and the presence of multiple recovery across major altcoins proof that Bitcoin will not produce a new low. This ALGOUSDT chart, HBAR, XLM and so on, all prove the market already hit bottom and from this bottom we grow.
The bear market is over, it has been over for months. We are seeing very strong bullish breakouts and this has been repeating again and again.
Things are looking good... and this is only the start. Opportunities are endless in this market and it gets better.
Thank you for reading.
Namaste.