#ALICEUSDT — Descending Triangle at Demand Zone!#ALICE
The price is moving within a descending channel on the 1-hour timeframe and has reached the lower boundary. It is now poised for a bounce and is expected to retest this boundary.
The Relative Strength Index (RSI) indicates a downward trend, which is likely to continue given the overbought conditions.
A key support zone has been identified in green at 0.1000. The price has bounced off this zone several times, making it a strong support level.
The price is trending towards the 100-period moving average, which we are approaching. This trend supports an upward move.
Entry Price: 0.1240
First Target: 0.1276
Second Target: 0.1312
Third Target: 0.1353
You can close at the second target or wait for the third target to be reached. The choice is yours.
Stop Loss: At the resistance zone in green.
Remember this simple rule: Money Management.
Any questions? Please leave a comment.
Thank you.
In-depth trading ideas
#ALICEUSDT — Descending Triangle at Demand Zone!#ALICE
The price is moving within a descending channel on the 1-hour timeframe and has reached the lower boundary. It is now poised for a bounce and is expected to retest this boundary.
The Relative Strength Index (RSI) indicates a downward trend, which is likely to continue given the overbought conditions.
There is a key support zone in green at 0.1049, and the price has bounced off this zone several times, making it a strong support level.
The price is trending towards the 100-period moving average, which we are approaching. This trend supports an upward move.
Entry Price: 0.1180
Target 1: 0.1210
Target 2: 0.1253
Target 3: 0.1300
Stop Loss: At the resistance zone in green
Remember this simple rule: Money management.
Any questions? Please leave a comment.
Thank you.
ALICE/USDT (4h) Testing the Apex of a Symmetrical TriangleALICE/USDT is trading at the apex of a large symmetrical triangle on the 4H chart after a prolonged period of compression.
A confirmed breakout above the descending resistance could trigger bullish expansion. A break below the rising support would favor bearish continuation, while low activity near the apex increases the risk of a false breakout.
#ALICEUSDT — Descending Triangle at Demand Zone!#ALICE
The price is moving within a descending channel on the 1-hour timeframe and has reached the lower boundary. It is now poised for a bounce and is expected to retest this boundary.
The Relative Strength Index (RSI) indicates a downward trend, which is likely to continue given the overbought conditions.
A key support zone (in green) has been identified at 0.1100. The price has bounced off this zone several times, making it a strong support level.
The price is trending towards the 100-period moving average, which we are approaching. This trend supports an upward move.
Entry Price: 0.1223
First Target: 0.1246
Second Target: 0.1282
Third Target: 0.1330
You can close at the second target or wait for the third target. The choice is yours.
Stop Loss: At the resistance zone (in green).
Remember this simple rule: Money Management.
Any questions? Please leave a comment.
Thank you.
ALICE/USDTKey Level Zone: 0.1260 - 0.1280
LMT v2.0 detected.
The setup looks promising—price previously trended upward with rising volume and momentum, then retested this zone cleanly. This presents an excellent reward-to-risk opportunity if momentum continues to align.
Introducing LMT (Levels & Momentum Trading)
- Over the past 3 years (SINCE 2022), I’ve refined my approach to focus more sharply on the single most important element in any trade: the KEY LEVEL.
- While HMT (High Momentum Trading) served me well—combining trend, momentum, volume, and structure across multiple timeframes—I realized that consistently identifying and respecting these critical price zones is what truly separates good trades from great ones.
- That insight led to the evolution of HMT into LMT – Levels & Momentum Trading.
Why the Change? (From HMT to LMT)
Switching from High Momentum Trading (HMT) to Levels & Momentum Trading (LMT) improves precision, risk control, and confidence by:
- Clearer Entries & Stops: Defined key levels make it easier to plan entries, stop-losses, and position sizing—no more guesswork.
- Better Signal Quality: Momentum is now always checked against a support or resistance zone—if it aligns, it's a stronger setup.
- Improved Reward-to-Risk: All trades are anchored to key levels, making it easier to calculate and manage risk effectively.
- Stronger Confidence: With clear invalidation points beyond key levels, it's easier to trust the plan and stay disciplined—even in tough markets.
Whenever I share a signal, it’s because:
- A high‐probability key level has been identified on a higher timeframe.
- Lower‐timeframe momentum, market structure and volume suggest continuation or reversal is imminent.
- The reward‐to‐risk (based on that key level) meets my criteria for a disciplined entry.
***Please note that conducting a comprehensive analysis on a single timeframe chart can be quite challenging and sometimes confusing. I appreciate your understanding of the effort involved.
Important Note: The Role of Key Levels
- Holding a key level zone: If price respects the key level zone, momentum often carries the trend in the expected direction. That’s when we look to enter, with stop-loss placed just beyond the zone with some buffer.
- Breaking a key level zone: A definitive break signals a potential stop‐out for trend traders. For reversal traders, it’s a cue to consider switching direction—price often retests broken zones as new support or resistance.
My Trading Rules (Unchanged)
Risk Management
- Maximum risk per trade: 2.0%
- Leverage: 3x
Exit Strategy / Profit Taking
- Sell at least 70% on the 3rd wave up (LTF Wave 5).
- Typically sell 50% during a high‐volume spike.
- Move stop‐loss to breakeven once the trade achieves a 1.5:1 R:R.
- Exit at breakeven if momentum fades or divergence appears.
The market is highly dynamic and constantly changing. LMT signals and target profit (TP) levels are based on the current price and movement, but market conditions can shift instantly, so it is crucial to remain adaptable and follow the market's movement.
If you find this signal/analysis meaningful, kindly like and share it.
Thank you for your support~
Sharing this with love!
From HMT to LMT: A Brief Version History
HM Signal (Prototype) :
Date: 17/08/2023
- Early concept identifying high momentum pullbacks within strong uptrends
- Triggered after a prior wave up with rising volume and momentum
- Focused on healthy retracements into support for optimal reward-to-risk setups
HMT v1.0:
Date: 18/10/2024
- Initial release of the High Momentum Trading framework
- Combined multi-timeframe trend, volume, and momentum analysis.
- Focused on identifying strong trending moves high momentum
HMT v2.0:
Date: 17/12/2024
- Major update to the Momentum indicator
- Reduced false signals from inaccurate momentum detection
- New screener with improved accuracy and fewer signals
HMT v3.0:
Date: 23/12/2024
- Added liquidity factor to enhance trend continuation
- Improved potential for momentum-based plays
- Increased winning probability by reducing entries during peaks
HMT v3.1:
Date: 31/12/2024
- Enhanced entry confirmation for improved reward-to-risk ratios
HMT v4.0:
Date: 05/01/2025
- Incorporated buying and selling pressure in lower timeframes to enhance the probability of trending moves while optimizing entry timing and scaling
HMT v4.1:
Date: 06/01/2025
- Enhanced take-profit (TP) target by incorporating market structure analysis
HMT v5 :
Date: 23/01/2025
- Refined wave analysis for trending conditions
- Incorporated lower timeframe (LTF) momentum to strengthen trend reliability
- Re-aligned and re-balanced entry conditions for improved accuracy
HMT v6 :
Date : 15/02/2025
- Integrated strong accumulation activity into in-depth wave analysis
HMT v7 :
Date : 20/03/2025
- Refined wave analysis along with accumulation and market sentiment
HMT v8 :
Date : 16/04/2025
- Fully restructured strategy logic
HMT v8.1 :
Date : 18/04/2025
- Refined Take Profit (TP) logic to be more conservative for improved win consistency
LMT v1.0 :
Date : 06/06/2025
- Rebranded to emphasize key levels + momentum as the core framework
LMT v2.0
Date: 11/06/2025
- Fully restructured lower timeframe (LTF) momentum logic
Live trading account :
www.binance.com
#ALICEUSDT — Descending Triangle at Demand Zone!#ALICE
The price is moving within a descending channel on the 1-hour timeframe and has reached the lower boundary. It is now poised for a bounce and is expected to retest this boundary.
The Relative Strength Index (RSI) indicates a downward trend, which is likely to continue given the overbought conditions.
There is a key support zone in green at 0.1270, and the price has bounced off this zone several times, making it a strong support level.
The price is trending towards the 100-period moving average, which we are approaching. This trend supports an upward move.
Entry Price: 0.1488
First Target: 0.1562
Second Target: 0.1638
Third Target: 0.1725
You can stop at the first and second targets and close below them, or continue towards the third target. Stop Loss: At the resistance zone in green.
Remember this simple rule: Money Management.
Any questions? Please leave a comment.
Thank you.
#ALICEUSDT — Descending Triangle at Demand Zone!#ALICE
The price is moving within a descending channel on the hourly timeframe. It has reached the lower boundary and is trending towards a bounce. A retest of this boundary is expected.
The Relative Strength Index (RSI) indicates a downward trend, and this trend is likely to continue due to the overbought condition.
A key support zone (in green) has been identified at 0.1200. The price has bounced off this zone several times, making it a strong support level.
The price is trending towards the 100-period moving average, which we are approaching. This trend supports an upward move.
Entry Price: 0.1303
First Target: 0.1330
Second Target: 0.1362
Third Target: 0.1405
You can close at the second target or wait for the third target to be reached. The choice is yours.
Stop Loss: At the resistance zone (in green).
Remember this simple rule: Money Management.
Any questions? Please leave a comment.
Thank you.
#ALICEUSDT — Descending Triangle at Demand Zone!#ALICE
The price is moving within a descending channel on the 1-hour timeframe and has reached the lower boundary. It is now poised for a bounce and is expected to retest this boundary.
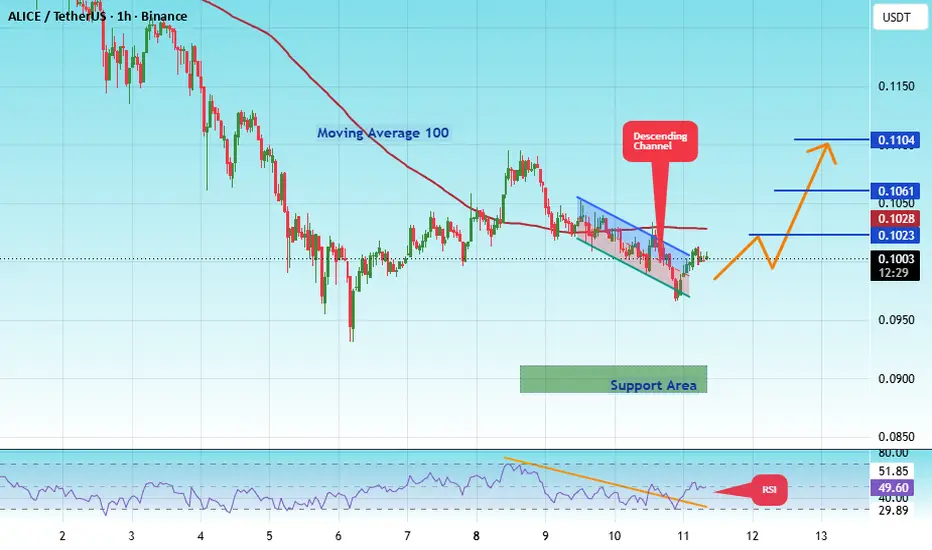
The Relative Strength Index (RSI) indicates a downward trend, which is likely to continue given the overbought conditions.
There is a key support zone in green at 0.0888. The price has bounced off this zone several times, making it a strong support level.
The price is trending towards the 100-period moving average, which we are approaching. This trend supports an upward move.
Entry Price: 0.1000
Target 1: 0.1023
Target 2: 0.1061
Target 3: 0.1104
Stop Loss: At the resistance zone in green
Remember this simple rule: Money management.
Any questions? Please leave a comment.
Thank you.
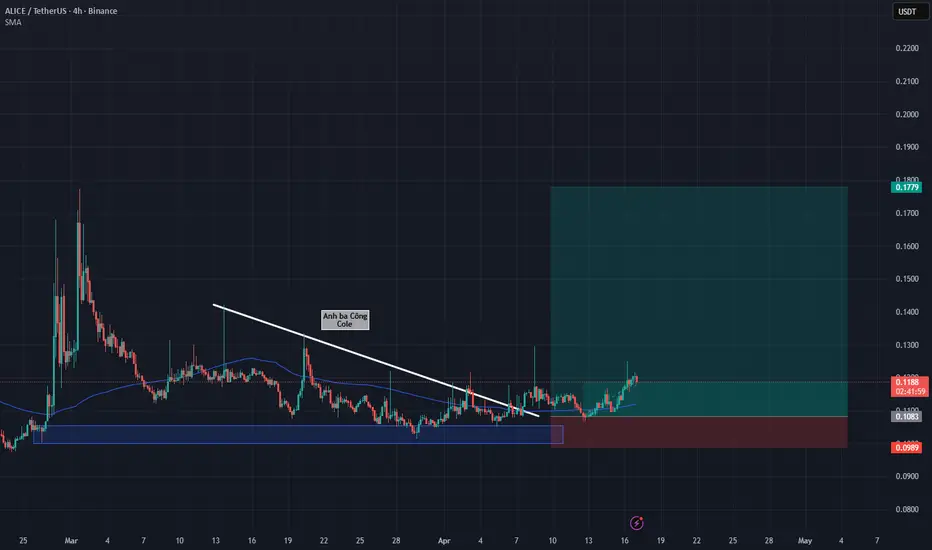
ALICE: Strategic Entry for the Next Expansion Leg
ALICE has officially marked a critical technical turning point, transitioning from a prolonged downtrend to a sustainable growth structure. Following a period of compression, the current chart outlines a "textbook" scenario with consistent higher highs and higher lows. This is clear evidence that active buying pressure is gaining dominance, and smart money is beginning to flow back into this asset to accumulate for a new cycle.
Looking at the technical chart, after successfully establishing a second peak, the price is undergoing a healthy retracement, closely hugging the 100-period moving average (MA100). In professional analysis, maintaining a position above the MA100 support after a breakout is an extremely positive signal, indicating that the upward momentum is supported by a solid foundation rather than being a temporary spike. Currently, this price zone offers a valuable "touchpoint" for those who missed the initial wave.
The trading strategy at this stage is quite clear. You may consider activating a Long position right at the current MA100 support to anticipate the next push. A more disciplined option is to patiently wait for the price to retest the ascending trendline for the third time – a confluence point that typically provides a powerful bounce. Should ALICE successfully establish a new higher peak as expected, the risk-to-reward (RR) ratio for this setup will be highly attractive. Maintain discipline and prioritize decisive capital management.
this is not investment advice, DYOR
Aliceusdt longInstructions:
Entry point: yellow
Stop loss: red
Take profit: green
👉Leverage x 5-10-20 for crypto
👉Leverage x 20-50-100 for commodities, stocks, indices, and forex
👉Margin 1-5% max.
Always practice risk and money management.
Invest a maximum of 5% on any trade or across all your trades.
Invest only what you can afford to lose, as no one is in control of the market.
👉Our analyses are primarily based on:
breakouts: two trend lines (ascending and descending) and a line indicating a horizontal breakout.
chart patterns: shoulders and head, triangle parttern, elliott impulse, etc etc.
We don't always have the time to track them at all times or to represent them visibly, given the numerous signals, the number of channels to manage, and especially because of the often rapid pace of market movements.
indicators: We associate at least two indicators with this technique.
👉Depending on the circumstances, we use specific indicators, often setting 3 or more take profit levels.
👉Indeed, there are good days in trading and also bad days. No one can promise to win every trade, and like all traders worldwide, we also experience stop-loss orders. However, we win more than we lose and remain positive.
👉You can close the position before or after the take profit orders indicated by the green lines if you are personally satisfied; the same applies to stop loss orders.
👉We must stay positive, clear-headed, and humble.
we cannot provide all instructions or all trades here on this channel.
Good luck to us all, and may God guide us. Amen.
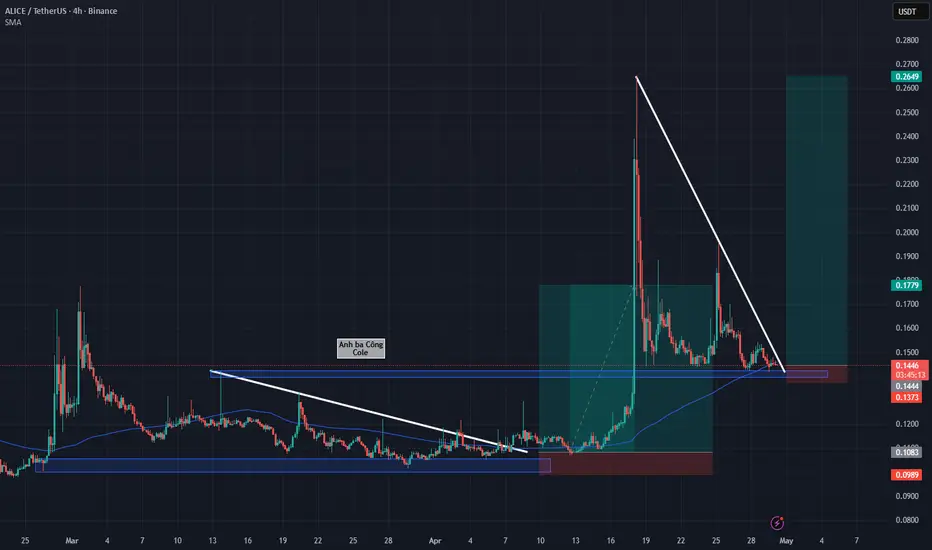
ALICE: Testing Strategic SupportALICE has recently delivered an explosive growth spurt, reaching $0.264 and significantly overshooting our previous $0.177 target. Currently, the price is undergoing a natural correction, forming a descending triangle with a pivotal support zone around $0.14 - $0.143. This is not merely a random price level; it represents a classic "role reversal" where old resistance has transformed into a robust foundation for the bulls in the context of 2026
Why is this setup particularly noteworthy? ALICE is now tightening at the apex of the triangle while receiving direct support from the 100-period Moving Average (MA100). In technical analysis, the price holding firm above this medium-term average during a consolidation phase indicates that the primary macro uptrend remains intact. I am leaning towards a breakout scenario (Long) to continue the decisive bullish momentum. This setup offers an excellent risk management advantage, as we can place a very tight stop-loss just below the support zone. Patiently waiting for the price to compress at key technical boundaries is the ultimate key to capital preservation before the next expansion. The convergence of historical support and current trend indicators is creating a high-value zone for the upcoming market shifts once technical obstacles are neutralized.
this is not investment advice, DYOR
#ALICE /USDT — Descending Triangle at Demand Zone!
#ALICE
The price is moving within a descending channel on the hourly timeframe. It has reached the lower boundary and is trending towards a bounce. A retest of this boundary is expected.
The Relative Strength Index (RSI) indicates a downward trend, and this trend is likely to continue due to the overbought condition.
There is a key support zone in green at 0.1290, and the price has bounced off this zone several times, making it a strong support level.
The price is trending towards the 100-period moving average, which we are approaching. This trend supports an upward move.
Entry Price: 0.1331
Target 1: 0.1423
Target 2: 0.1510
Target 3: 0.1631
Stop Loss: At the resistance zone in green
Remember this simple rule: Money management.
Any questions, please leave a comment.
Thank you.
ALICE: Testing the $0.13 "Ceiling"ALICE is moving with remarkable precision and conviction, perfectly aligning with our deep-dive analysis from last week. Following an impressive surge, price candles are now facing a genuine challenge at the $0.12 - $0.13 psychological resistance zone. In professional analysis circles, this is considered a solid "ceiling" where sellers are attempting to stall the rally to absorb remaining liquidity before a new macro growth cycle is decisively established in 2026.
The reason for close observation lies in the broader market's capital flow leadership. If Bitcoin (BTC) maintains its positive impulse and draws capital back into major ecosystems, ALICE will have sufficient drive to pierce through this barrier and head straight toward its All-Time High (ATH). However, if the market falls into a state of indecision, a sideways accumulation scenario just below this resistance for several weeks is necessary for the asset to "recharge." Identifying the exact moment when active capital enters will be the key to capital preservation and catching the upcoming explosive wave. Maintain iron discipline and monitor the candle closes; patience at these core value zones is the ultimate key to reaping rewards when the market structure officially and decisively shifts as technical obstacles are neutralized.
this is not investment advice, DYOR
#ALICEUSDT — Descending Triangle at Demand Zone!#ALICE
The price is moving within a descending channel on the 1-hour timeframe and has reached the lower boundary. It is now poised for a bounce and is expected to retest this boundary.
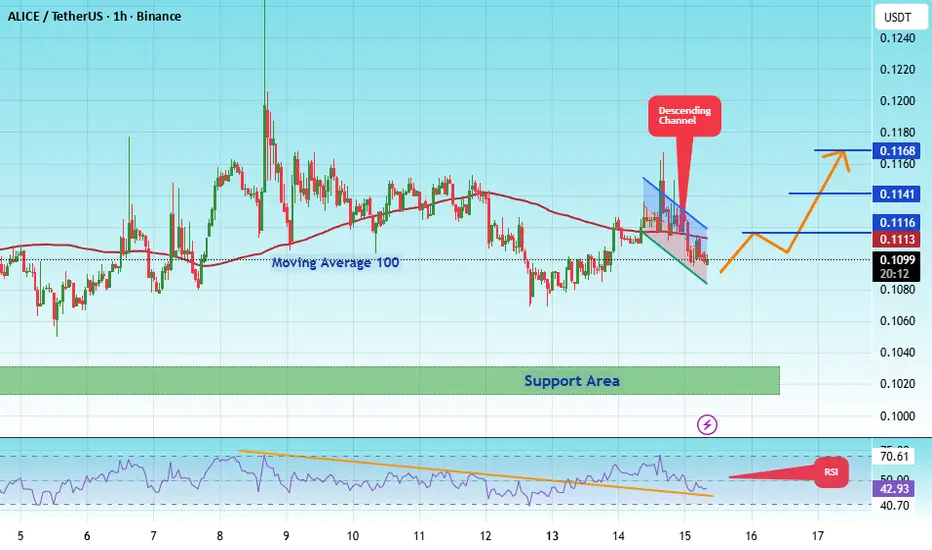
The Relative Strength Index (RSI) indicates a downward trend, which is likely to continue given the overbought conditions.
There is a key support zone in green at 0.1014. The price has bounced off this zone several times, making it a strong support level.
The price is trending towards the 100-period moving average, which we are approaching. This trend supports an upward move.
Entry Price: 0.1100
First Target: 0.1116
Second Target: 0.1140
Third Target: 0.1168
You can stop at the first and second targets and close the price, or continue to the third target. Stop Loss: At the resistance zone in green.
Remember this simple rule: Money Management.
Any questions? Please leave a comment.
Thank you.
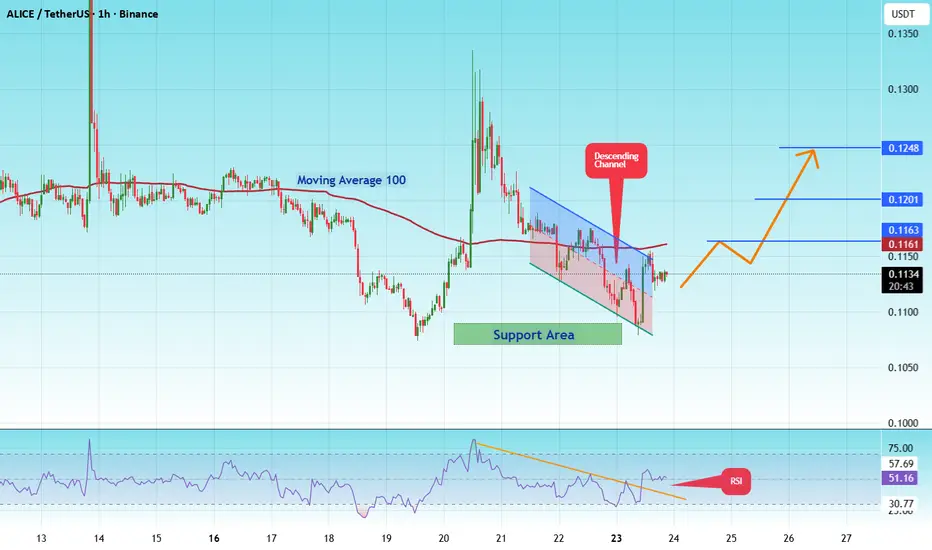
#ALICE/USDT Alert! Imminent Rise#ALICE
The price is moving within a descending channel on the hourly timeframe. It has reached the lower boundary and is trending towards a bounce. A retest of this boundary is expected.
The Relative Strength Index (RSI) indicates a downward trend, and this trend is likely to continue due to the overbought condition.
A key support zone (in green) was found at 0.1077, and the price has bounced off this zone several times, making it a strong support level.
The price is trending towards the 100-period moving average, which we are approaching. This trend supports a potential upward move.
Entry Price: 0.1134
First Target: 0.1163
Second Target: 0.1201
Third Target: 0.1248
Stop Loss: At the resistance zone (in green)
Remember this simple rule: Money Management.
Any questions? Please leave a comment.
Thank you.
ALICE: Testing the $0.105 "Steel Floor"ALICE is establishing a positive accumulation base at the $0.105 support, preparing for a major transition. The current pivotal challenge is breaking out of the descending trendline to trigger a rally toward the MA100 and the $0.177 resistance. Stable price maintenance above support indicates seller exhaustion. Investors should patiently await an impulsive confirmation candle to catch the decisive macro recovery as technical barriers are gradually and officially neutralized, signaling the return of active momentum.
this is not investment advice, DYOR
ALIVE: Under Heavy PressureALIVE is entering a decisive liquidity compression phase at the lower edge of its accumulation triangle. By maintaining the price below the MA100, the market structure is heavily skewed toward the bears as recovery demand appears exhausted. A decisive breakout from the diagonal support will signal a high-RR Short setup. Investors should closely monitor the confirmation move to catch the macro downtrend once the final technical barrier is eliminated.
this is not investment advice, DYOR
#ALICE/USDT Alert! Imminent Rise#ALICE
The price is moving within a descending channel on the hourly timeframe. It has reached the lower boundary and is trending towards a bounce. A retest of this boundary is expected.
The Relative Strength Index (RSI) indicates a downward trend, and this trend is likely to continue due to the overbought condition.
There is a key support zone in green at 0.1170. The price has bounced off this zone several times, making it a strong support level.
The price is trending towards the 100-period moving average, which we are approaching. This trend supports an upward move.
Entry Price: 0.1200
Target 1: 0.1232
Target 2: 0.1256
Target 3: 0.1293
Stop Loss: At the resistance zone in green
Remember this simple rule: Money management.
Any questions, please leave a comment.
Thank you.
#ALICE/USDT Alert! Imminent Rise#ALICE
The price is moving within a descending channel on the hourly timeframe. It has reached the lower boundary and is poised for a bounce. A retest of this boundary is expected.
The Relative Strength Index (RSI) indicates a downward trend, and this trend is likely to continue due to the overbought condition.
There is a key support zone in green at 0.1160. The price has bounced off this zone several times, making it a strong support level.
The price is trending towards the 100-period moving average, which we are approaching. This trend supports an upward move.
Entry Price: 0.1249
Target 1: 0.1249
Target 2: 0.1280
Target 3: 0.1317
Stop Loss: At the resistance zone in green
Remember this simple rule: Money management.
Any questions, please leave a comment.
Thank you.
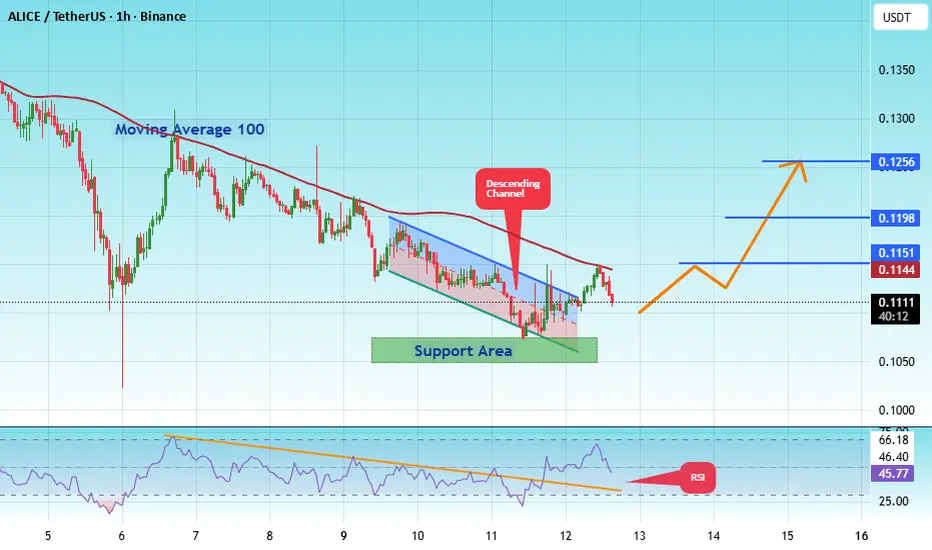
#ALICE/USDT – Potential Trend Reversal After Long Accumulation#ALICE
The price is moving within a descending channel on the hourly timeframe. It has reached the lower boundary and is heading towards a breakout, with a retest of the upper boundary expected.
The Relative Strength Index (RSI) is showing a downward trend, approaching the lower boundary, and an upward bounce is anticipated.
There is a key support zone in green at 0.1060, and the price has bounced from this level several times and is expected to bounce again.
The indicator is showing a trend towards consolidation above the 100-period moving average, which we are approaching, supporting the upward move.
Entry Price: 0.1111
First Target: 0.1150
Second Target: 0.1198
Third Target: 0.1256
Stop Loss: Below the green support zone.
Remember this simple thing: Money management.
For any questions, please leave a comment.
Thank you.
#ALICE/USDT – Potential Trend Reversal After Long Accumulation#ALICE
The price is moving within a descending channel on the hourly timeframe. It has reached the upper boundary and is heading towards breaking it. A retest of this boundary is expected.
The Relative Strength Index (RSI) is showing an upward trend, as it has approached the upper boundary. A bearish reversal is expected.
There is a key support zone in green at 0.1703. The price has bounced from this zone several times and is expected to bounce again.
A consolidation trend is observed above the 100-period moving average, which we are approaching. This trend supports a decline towards this level.
Entry Price: 0.1726
Target 1: 0.1759
Target 2: 0.1797
Target 3: 0.1837
Stop Loss: Above the green support zone.
Remember this simple thing: Money management.
For any questions, please leave a comment.
Thank you.
#ALICE/USDT – Potential Trend Reversal After Long Accumulation#ALICE
The price is moving within a descending channel on the hourly timeframe. It has reached the lower boundary and is heading towards a breakout, with a retest of the upper boundary expected.
The Relative Strength Index (RSI) is showing a downward trend, approaching the lower boundary, and an upward bounce is anticipated.
There is a key support zone in green at 0.1650. The price has bounced from this level several times and is expected to bounce again.
The indicator is showing a trend towards consolidation above the 100-period moving average, which we are approaching, supporting the upward move.
Entry Price: 0.1700
First Target: 0.1750
Second Target: 0.1786
Third Target: 0.1841
Stop Loss: Below the green support zone.
Don't forget one simple thing: Money Management.
For inquiries, please leave a comment.
Thank you.