AlloLamentations 3:53 — "They have cut off my life in the dungeon, and cast a stone upon me."
ALLO was cast into the dungeon. The stones were laid upon it. The darkness is complete.
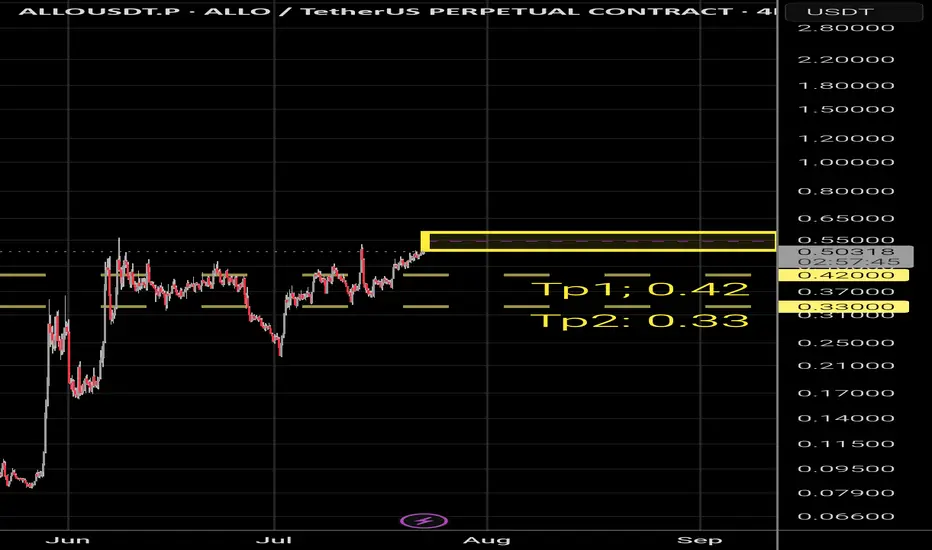
TP1: 0.42 — the first stone removeth. Still in shadow.
TP2: 0.33 — the dungeon wall breaketh. The light is gone. Only the abyss remains.
In-depth trading ideas
ALLOUSDT: Bullish Breakout Holds, Eyes on Higher HighsALLOUSDT has broken above its recent consolidation range and is now holding above the breakout area, indicating that buyers remain in control. The series of higher lows and sustained strength above support suggest bullish momentum is building.
As long as 0.4920 continues to act as support, the probability favors a continuation toward 0.5153. A loss of this level would weaken the bullish structure and invalidate the setup.
Trade Setup
Entry: 0.4983
Target: 0.5153
Stop Loss: 0.4920
I'll be watching for buyers to defend the breakout zone before expecting the next leg higher. A successful hold above support could provide the momentum needed to extend the current uptrend, while disciplined risk management remains essential if the setup fails.
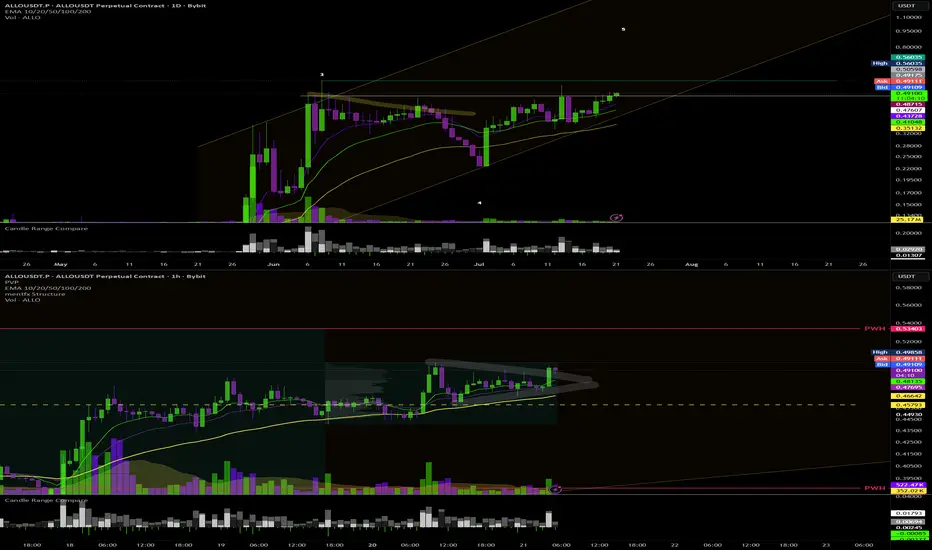
ALLO Long: Daily Reclaim Into 1H Compression Break⚛️ I am getting long ALLO here as price starts to break out of a tight 1H compression following a constructive daily reclaim.
On the daily, ALLO pulled back into the 0.468 area, found support, and then began rebuilding. Instead of continuing lower, price reclaimed the short-term moving averages and started holding above them. That shift matters because it tells me the pullback may be transitioning into a new continuation phase.
The important part is that this was not just a straight bounce. Price spent time building a base. Sellers failed to push it back through support, the range tightened, and higher lows began forming as ALLO pressed into the 0.494 to 0.495 resistance area.
On the 1H, the structure is clean. We have rising lows, compression beneath local resistance, and price holding above the moving-average structure. That gives me a defined place to be wrong while positioning for expansion if this breakout can gain acceptance.
I am not looking for a quick wick above resistance. I want to see ALLO hold above the breakout area, build value there, and show that buyers are willing to support price above the prior range. If that happens, the next higher-timeframe area I am watching is the prior-month high near 0.5603.
The failure scenario is simple. If price rejects this breakout, loses the local higher-low structure, and accepts back below 0.487, then the immediate continuation thesis is invalid. At that point, this is a failed breakout attempt and there is no reason to force the long.
HTF Context: Daily support held near 0.468, followed by a reclaim of short-term structure.
LTF Structure: 1H higher lows and compression beneath 0.494 to 0.495 resistance.
Cycle Position: Early base-and-break continuation attempt after the daily reclaim.
Confirmation: Acceptance and value building above the local breakout zone.
Invalidation: Loss of 0.487 and acceptance back into the prior range.
Upside Area: Prior-month high near 0.5603.
Location. Compression. Confirmation.
Not financial advice. This is an educational market structure breakdown, not a signal.
ALLO | Q3 2026 - Week ChartAllora (Ticker: ALLO)Allora is a decentralized, self-improving Artificial Intelligence (AI) network that coordinates thousands of specialized machine learning models to generate adaptive, context-aware predictions.
-----------------------------------
Multiple Time-Frame Analysis; Color Code | Strength favors the higher timeframe.
Yearly timeframe = black
Monthly timeframe = pink
weekly = grey
daily = red
4hr = orange
1hr = yellow
15min = blue
5min = green if they are shown. (Level visibility on intervals is set to timeframe the level was found on and below to keep chart view organized.)
** Candle Science explained **
A Range = two or more consecutive color candles.
There are two types of ranges - accumulation and distribution.
DISTRIBUTION RANGES DEFINED:
When price is above a distribution range, these candles/levels act as support.
(BS) BACKSIDE Candle - First distribution candle in a distribution range. Expectation = strong reaction to price. long wicks reaching to or away from level.
(FS) FrontSide Candle - Last distribution candle in a distribution range. Expectation = reversal, create a trend in the opposite direction. Distribution candles are used as support.
ACCUMULATION RANGES DEFINED: When price is below an accumulation range, these candles/levels act as resistance.
INVERSE BACKSIDE (Inv.BS) - First Accumulation candle in an accumulation range. Expectation. = strong reaction to price. long wicks reaching to or away from level.
INVERSE FRONTSIDE (Inv.FS) - Last accumulation candle in an accumulation range. Expectation = reversal, create a trend in the opposite direction. Accumulation candles are used as resistance.
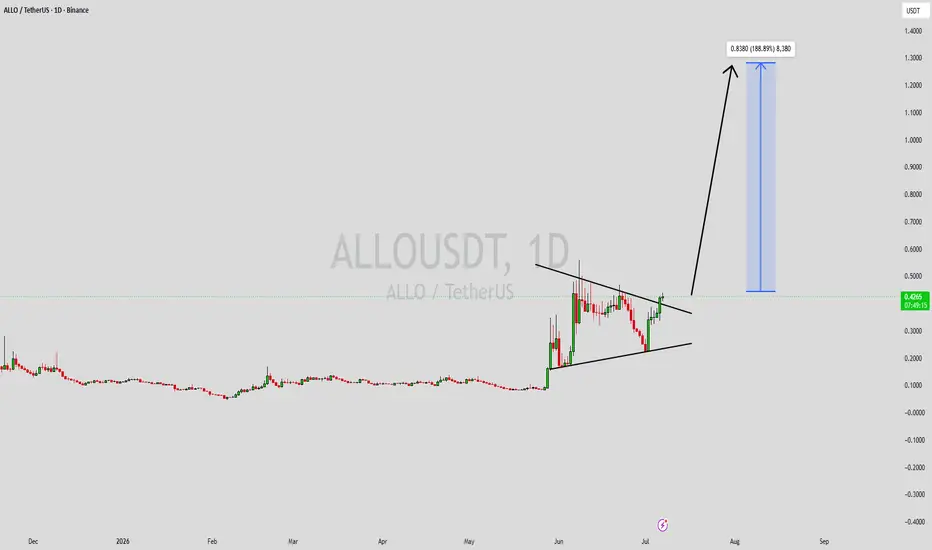
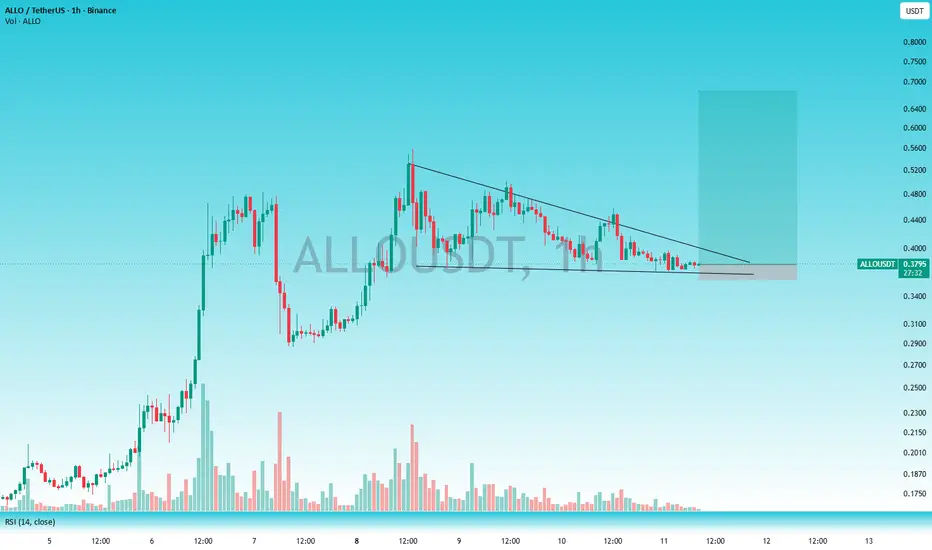
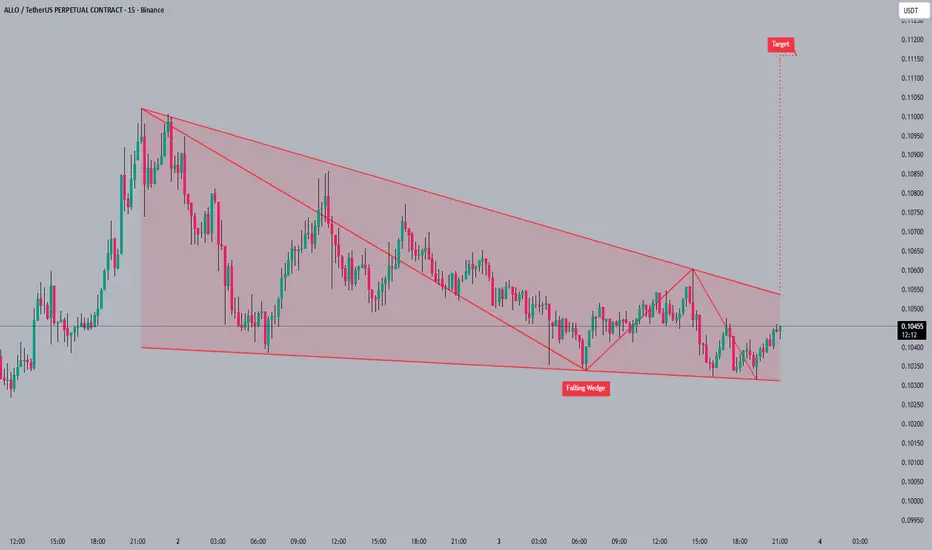
ALLOUSDT Forming Falling WedgeALLOUSDT is forming a clear falling wedge pattern, a classic bullish wave signal that often indicates an upcoming breakout. The price has been consolidating within a narrowing range, suggesting that selling pressure is weakening while buyers are beginning to regain control. With consistent volume confirming accumulation at lower levels, the setup hints at a potential bullish breakout soon. The projected move could lead to an impressive gain of around 90% to 100% once the price breaks above the wedge resistance.
This falling wedge pattern is typically seen at the end of downtrends or corrective phases, and it represents a potential shift in market sentiment from bearish to bullish. Traders closely watching ALLOUSDT are noticing the strengthening momentum as it approaches a key breakout zone. Healthy trading volume further supports this setup, indicating that market participants are gradually accumulating positions in anticipation of a potential reversal.
Growing interest in ALLOUSDT reflects increasing confidence in the project's long-term potential as well as its current technical structure. If the breakout is confirmed with sustained buying volume, it could signal the beginning of a strong bullish trend. Traders may find this an attractive opportunity for medium-term gains as the falling wedge pattern reaches completion and bullish momentum continues to build.
✅ Show your support by hitting the like button!
✅ Leave a comment below! (What is your opinion about this coin?)
Your feedback and engagement keep me inspired to share more insightful market analysis with you!
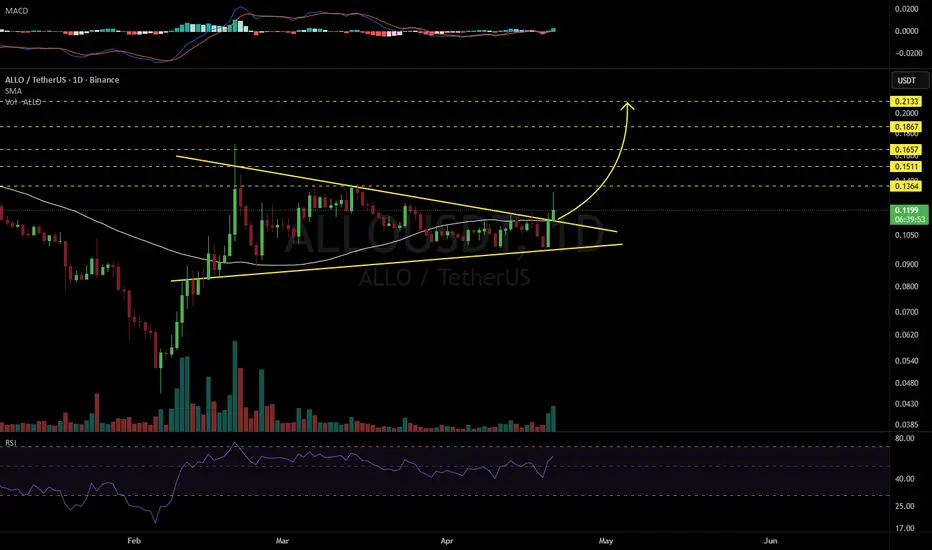
ALLOUSDT Forming Bullish MomentumALLOUSDT is forming a clear bullish momentum pattern, a classic bullish wave signal that often indicates an upcoming breakout. The price has been consolidating within a narrowing range, suggesting that selling pressure is weakening while buyers are beginning to regain control. With consistent volume confirming accumulation at lower levels, the setup hints at a potential bullish breakout soon. The projected move could lead to an impressive gain of around 70% to 80% once the price breaks above the wedge resistance.
This bullish momentum pattern is typically seen at the end of downtrends or corrective phases, and it represents a potential shift in market sentiment from bearish to bullish. Traders closely watching ALLOUSDT are noting the strengthening momentum as it nears a breakout zone. The strong trading volume adds confidence to this pattern, showing that market participants are positioning early in anticipation of a reversal.
Investors’ growing interest in ALLOUSDT reflects rising confidence in the project's long-term fundamentals and current technical strength. If the breakout confirms with sustained volume, this could mark the start of a fresh bullish leg. The current market structure suggests that buyers are steadily gaining control while bearish pressure continues to fade.
Traders might find this a valuable setup for medium-term gains, especially as the bullish momentum pattern completes and buying momentum accelerates. A confirmed breakout could attract additional market attention and potentially drive the price toward significantly higher levels in the coming trend cycle.
✅ Show your support by hitting the like button!
✅ Leaving a comment below! (What is your opinion about this Coin?)
Your feedback and engagement keep me inspired to share more insightful market analysis with you!
ALLO is building strength with higher lows along its trendline
ALLO/USDT Price Action
**Trendline Support:** The chart shows a clear series of higher lows, confirming that buyers are stepping in consistently. This is a strong bullish signal.
**Momentum:** On the 4‑hour timeframe, candles are holding above the trendline, and buyer activity is visible at each retest.
**Breakout Potential:** The marked green zone above price represents a possible target area. If momentum continues, ALLO could push into that breakout zone.
**Risk Management:** A safe entry would be near the trendline support, with a stop‑loss placed just below it. Waiting for a breakout confirmation candle before scaling in adds extra safety.
🔎 Summary
ALLO is currently in a **bullish structure**, supported by higher lows and strong buyer reaction. If this momentum holds, a breakout toward the target zone is likely. Proper risk management is key to making this setup effective.
✨ Short caption for posting:
"ALLO is climbing with strong higher lows. Buyers are active, and the setup hints at a breakout toward the target zone."**
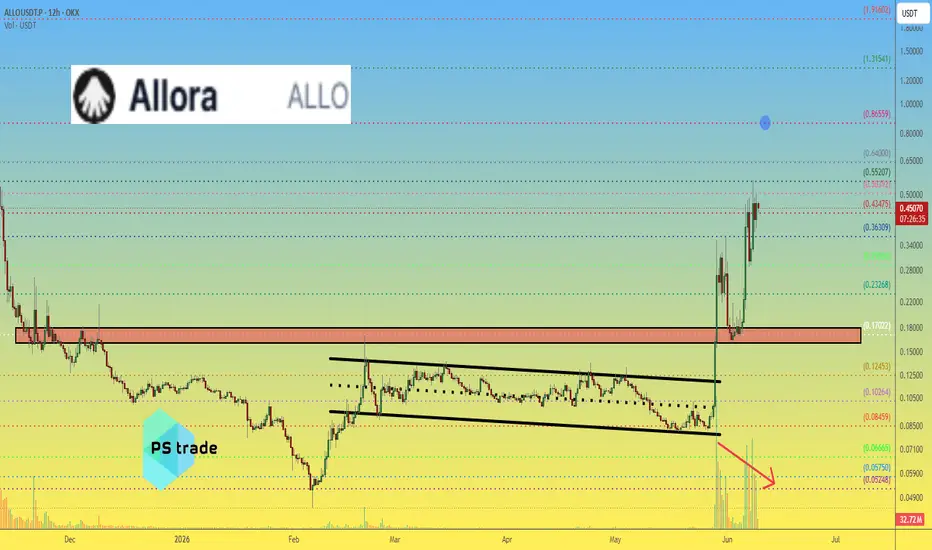
Allora ALLO price analysis👀 While the crypto market continues its local correction, #ALLO is behaving quite differently — someone is clearly holding the price.
There is a chance that OKX:ALLOUSDT is being supported for one final push higher.
🔼 The market could be preparing for one last squeeze to force short sellers out of their positions.
After all, it's always easier to move lower without too many extra passengers on board.
But there is one thing that catches our attention.
🔽 Price keeps moving up while trading volume continues to decline.
For us, that's a warning sign and often a pattern seen near the end of a move.
At the same time, we cannot rule out a final spike toward $0.86.
And honestly, it doesn't look unrealistic.
Allora's current market capitalization is around $100M.
Could it become $200M? Absolutely.
Compared to many other crypto projects, that is still not a particularly large valuation.
🍿 Personally, though, we are not comfortable buying #ALLO at current prices.
The $0.16–0.18 area looks much more attractive for a potential entry.
Do you think #ALLO is preparing for one last pump, or are smart money players already quietly leaving the market?
🧠 DYOR | This is not financial advice, just thinking out loud.
______________
◆ Follow us ❤️ for daily crypto insights & updates!
🚀 Don’t miss out on important market mov
PEAK!?As you can see here, there's something odd about how small volume can send this coin so high. The volume has been decreasing from its initial high to now. This is a sign of a peak, a massive decline due to the inability of the market makers to continue pumping the coin's price.
You can also see that the RSI increase didn't have a significant impact. A price increase should be followed by an increase in the RSI, as evidenced by previous pumping. This actually indicates weakening.
In my opinion, with data like this, we can only wait and see how long the market makers can hold the price at 0.4, so that total distribution will likely occur this week. BTC will definitely hit 50,000-49,000 this month, or possibly even below (43,000) this month.
So, the red support line is a minor support line that must be broken. If it is broken, it will lead to the orange support line (this is likely where whales will play again for small accumulations).
ALLO Drops 45% – Buyers Facing a Big Test ALLO has corrected 45% from its recent highs, putting the token at a critical point. After such a sharp decline, traders are watching closely to see if buyers step in and defend key support levels.
Large corrections often create fear in the market, but they can also present opportunities if demand returns. The next move will likely depend on volume and how price reacts around current support zones.
For now, volatility remains high and all eyes are on whether ALLO can stabilize and begin a recovery.
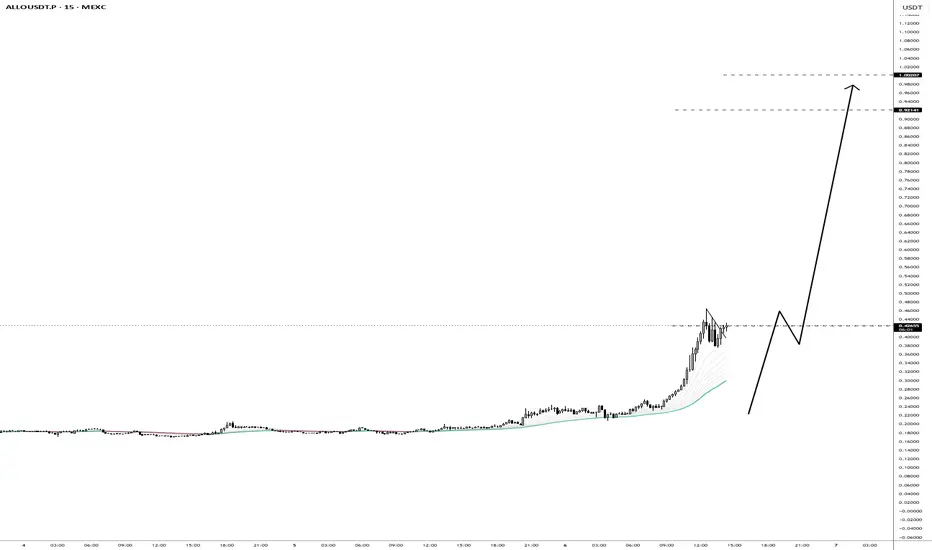
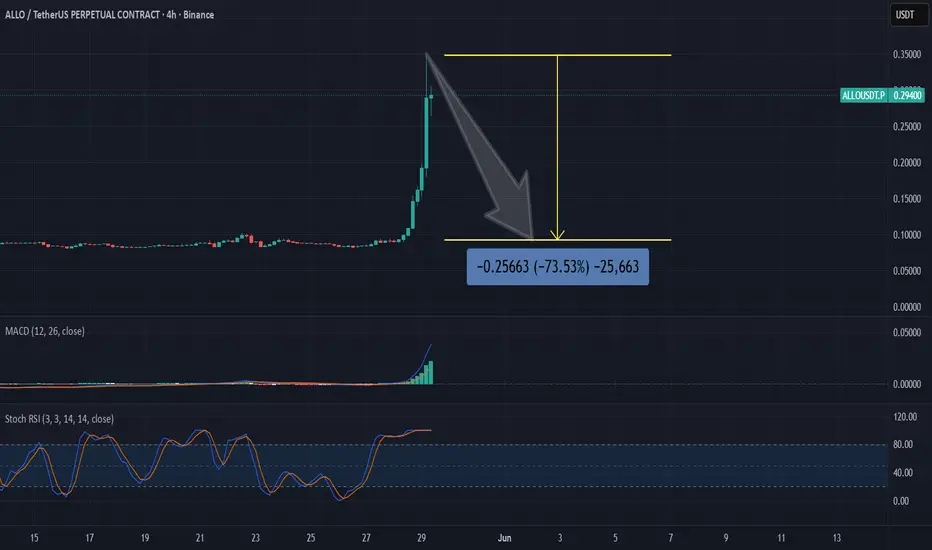
SHORT ALLO!A truly insane increase, hahaha.
This price increase was triggered by the market maker experiencing significant losses and the CL. BTC broke through $72,000 yesterday, and with BTC's rise to $73, the market maker chose a good coin to exploit.
I don't see any strong support on the 1H/4H timeframe. With this kind of increase, it could fall very quickly without further buying support.
So, I speculate as shown in this chart.
Allora —Up 300%My analysis is ruined because the thing moved too much too fast, the chart changed too much.
Alright. ALLOUSDT.
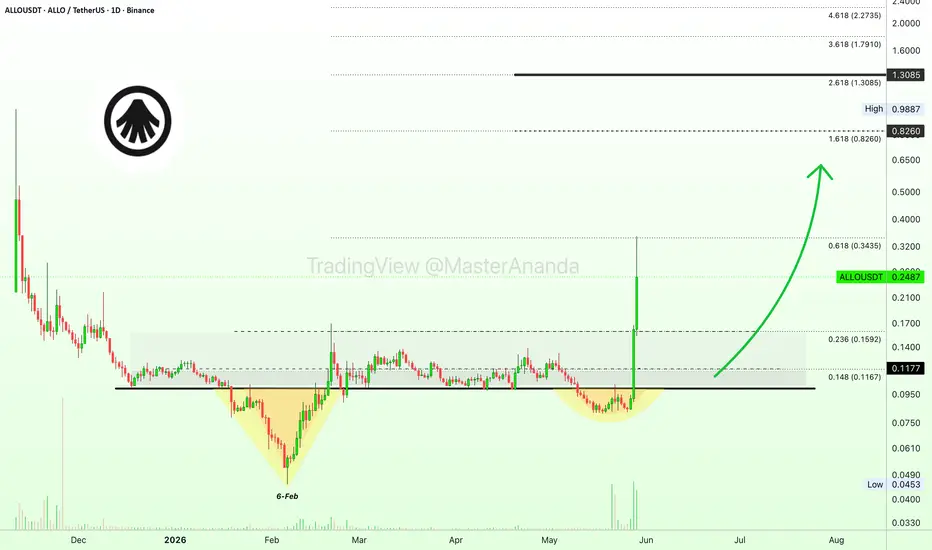
The bottom 6-February produced a strong recovery. There is no volume.
After lots of sideways, we see a stop-loss hunt event followed by a major rise. The major rise is coupled with the highest volume ever. Total growth goes beyond 300% in the past 3 days.
This is another project that rather than breaking down is breaking up.
I saw many projects moving lower, a very shy lower low. The continuation of the consolidation period at bottom prices with a downward bent. We can be sure these projects have been expanding their token supply and thus we continue to see lower prices, but never a new bearish impulse, never a new major low.
When a breakout happens, it is always as shown on this chart. 100%, 200% or even 300% up in a matter of days. This is what reveals a broader hidden bullish bias across the market.
When the retrace is over, we will have a bullish resumption.
Thank you for reading.
Namaste.
ALLO/USDT — early expansion, but still inside rangeStrong moves don’t start from breakouts.
They start from imbalance at support.
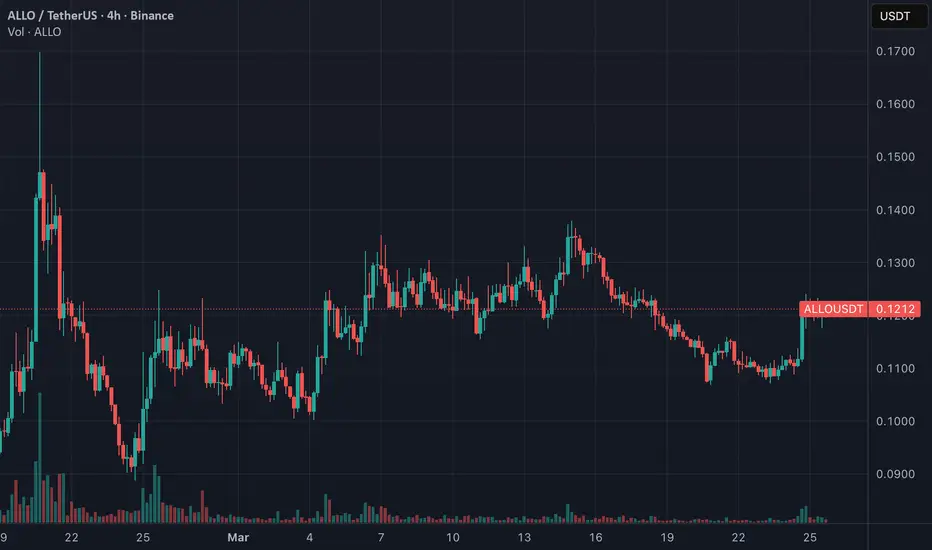
Right now ALLO is trading around 0.121 after a local push from the 0.119 area.
The structure is shifting — but not confirmed.
What the current structure shows
• Price reacting from support zone (0.119–0.120)
• Early signs of buyer pressure
• Medium volatility → controlled environment
At the same time:
• No clean breakout yet
• Range structure still active
This matters.
Early strength + range = potential expansion, not confirmation
What AI highlights (this is key)
The setup supports a LONG scenario:
• Entry aligns with support (0.1198–0.1210)
• Order flow slightly favors buyers
• Risk is clearly defined below structure
But:
This is not a strong trend
Which means:
• Move can stall
• Fake expansions are possible
• Weak momentum can fade quickly
Key levels to work with
Support / Entry: 0.1198 – 0.1210
Invalidation: 0.1172
Resistance: 0.1278
Targets:
• 0.1278
• 0.1314
Two scenarios from here
Continuation scenario
If price holds above 0.120 and builds acceptance:
• Gradual expansion toward 0.1278
• Buyers gain control
This is where structure starts to confirm.
Failure scenario
If price loses 0.119:
• Buyer pressure disappears
• Move rotates back into lower range
• Setup invalidates fast
Practical approach
This is a positioning setup inside support, not a breakout trade.
In this type of market:
• Entries near support only
• No chasing
• Risk must be tight
The edge here is not momentum.
It’s timing within the range.
$ALLO – Powerful Rebound at BuyersBINANCE:ALLOUSDT
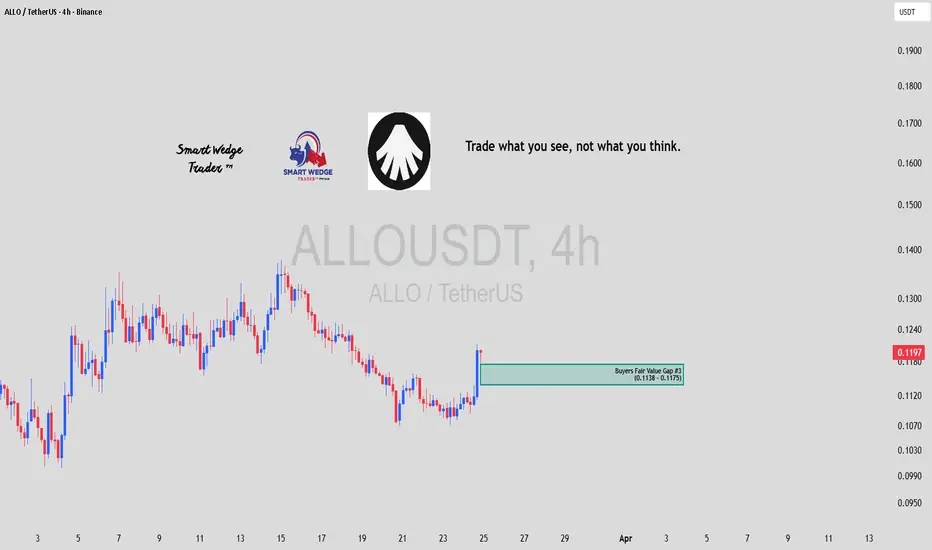
NASDAQ:ALLO – Powerful Rebound at Buyers Fair Value Gap #3 on 4H Chart 🚀
🐂 Buyers stepping in strongly at key demand zone
After a prolonged corrective decline from the mid-March highs near 0.1380–0.1400, price has formed a clear lower low structure and dropped sharply into the prominent Buyers Fair Value Gap #3 (0.1138 – 0.1175) — a significant area of previous buy-side imbalance and resting demand liquidity.
The latest 4H candles show an aggressive bullish reaction:
- Strong green candle with long lower wick rejecting the lower boundary of the FVG
- Immediate follow-through pushing price above 0.1180
- Early signs of momentum shift with higher lows developing inside and above the gap
Current market structure:
- Clear defense of the Buyers FVG #3
- Price reclaiming short-term structure after weeks of selling pressure
- Trading above the gap with bullish candle bodies dominating recent sessions
🎯 Key levels & high-probability scenarios:
- Primary support / defended zone → 0.1138 – 0.1175 (inside Buyers FVG #3)
→ Successfully held → now acting as new short-term floor
-*If bulls maintain control above the FVG → Next upside targets open toward 0.1220 – 0.1250 (previous swing highs & 50% retracement zone) → excellent area for continuation longs on any healthy pullback to the gap
- If minor rejection appears near 0.1220–0.1240 → A retest of the broken FVG from above would be technically very bullish and offer high-probability long re-entries with tight stops below 0.1175
⚠️ As long as price holds above the Buyers Fair Value Gap #3 and we continue to see higher lows, the path of least resistance remains upward. A clean break back below 0.1130 would invalidate the current bullish recovery.
Trade what you see, not what you think.
Patience. Discipline. Let the chart lead.
#ALLO #ALLOUSDT #Crypto #Altcoins #BullishRebound #FairValueGap #SmartWedge #TradingView #Binance #CryptoTrading #SmartWedgeTrader
ALLO/USDTALLO approaching a fragile decision zone
Most traders try to predict the next move.
But the real edge often comes from understanding when structure is not ready yet.
Right now ALLO is trading near 0.1235 in a mixed regime.
The broader bias still leans upward, but the structure is not fully aligned:
• 4H structure is unclear
• 1H structure is broken
• Price remains above MA200 on 4H and 1H, while 1D still lacks alignment
That usually means one thing:
The market may still recover —
but confirmation matters more than bias.
Markets in this condition usually resolve in one of two ways:
• Structure stabilizes above support → recovery continuation
• Support fails / MA200 is lost → deeper rotation or exit scenario
Practical approach
Do not force the trade here.
Watch for confirmation first.
If ALLO rebuilds short-term structure and holds above support, upside continuation becomes more credible.
If price loses support or prints 2–3 consecutive 4H closes below MA200, the bullish case weakens significantly.
In environments like this, the goal is not prediction.
It’s patience around structure.