ALTUSDT Forming Falling WedgeALTUSDT is forming a clear falling wedge pattern, a classic bullish wave signal that often indicates an upcoming breakout. The price has been consolidating within a narrowing range, suggesting that selling pressure is weakening while buyers are beginning to regain control. With consistent volume confirming accumulation at lower levels, the setup hints at a potential bullish breakout soon. The projected move could lead to an impressive gain of around 40% to 50% once the price breaks above the wedge resistance.
This falling wedge pattern is typically seen at the end of downtrends or corrective phases, and it represents a potential shift in market sentiment from bearish to bullish. Traders closely watching ALTUSDT are noting the strengthening momentum as it nears a breakout zone. Good trading volume adds confidence to this pattern, showing that market participants are positioning early in anticipation of a sustained upward move.
Investors' growing interest in ALTUSDT reflects rising confidence in the project's long-term fundamentals and current technical strength. If the breakout confirms with sustained buying volume, this could mark the start of a fresh bullish leg. The ongoing consolidation phase suggests that buyers are steadily accumulating positions while bearish pressure continues to weaken, creating favorable conditions for further upside.
Traders might find this a valuable setup for medium-term gains, especially as the falling wedge pattern nears completion and buying momentum continues to accelerate. A confirmed breakout above resistance could attract additional market participation and potentially drive the price toward its projected upside target over the coming weeks.
✅ Show your support by hitting the like button!
✅ Leave a comment below! (What is your opinion about this coin?)
Your feedback and engagement keep me inspired to share more insightful market analysis with you!
In-depth trading ideas
ALTUSDT 1D#ALT is currently trading within a falling wedge pattern on the daily chart.
Consider entering this coin only after a confirmed breakout above both the wedge resistance and the daily SMA100. If the breakout is confirmed, the following upside targets could come into play:
🎯 $0.00754
🎯 $0.00875
🎯 $0.00972
🎯 $0.01069
🎯 $0.01208
🎯 $0.01384
⚠️ Always remember to use a tight stop-loss and maintain proper risk management.
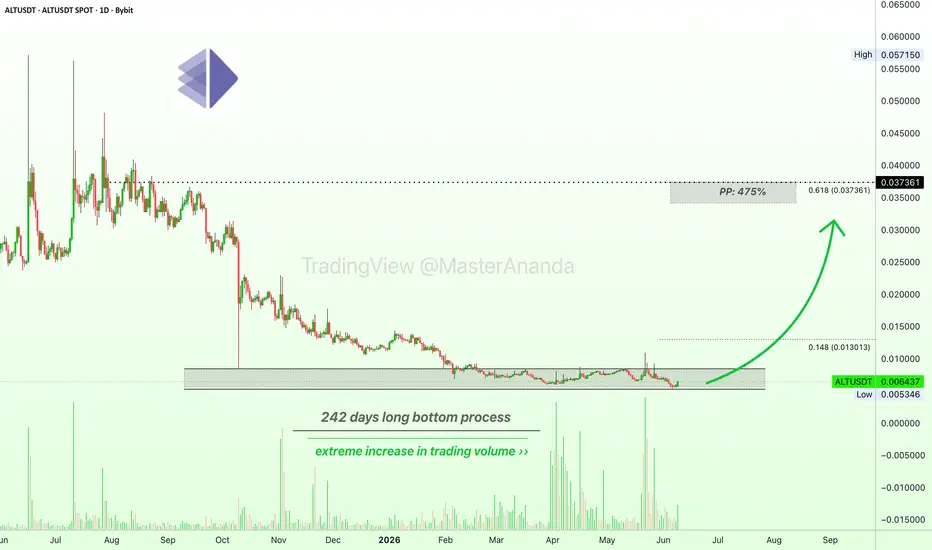
Alt Layer: Downtrend, Bottom Process & Trend Reversal (PP: 475%)For eight months a bottom process has been in the making. First we have a downtrend followed by the bottom process, a neutral sideways market and then comes the trend reversal.
Alt Layer—ALTUSDT
Notice the extreme increase in trading volume after April 2026, what changed? The price stays the same, the market continues sideways. Neither down nor up yet, trading volume goes through the roof and green bars clearly stand out.
Can we take this as a bullish signal? Whales accumulating at the true bottom? Yes.
This kind of behavior and chart signals tend to lead to a change of trend. The first target, an easy target, will reach a nice 475% mid-term, within three months. We get the usual correction followed by additional growth.
Right now we are witnessing the accumulation zone, then the market grows. Very simple and unavoidable. Trust.
Namaste.
ALT/USDT — Massive Breakout or Another Rejection from Trendline?ALT/USDT on the 2D timeframe is currently sitting at a very crucial area after months of moving inside a long-term downtrend structure. 📊
Price is starting to show signs of recovery and is now testing the main trendline resistance that has been suppressing the price since early 2025. ⚠️
This chart is becoming increasingly interesting because selling pressure appears to be weakening, while buyers are slowly forming higher lows from the previous bottom area. 📈
If a breakout successfully occurs, a medium-term reversal could begin to develop. 🚀
---
📊 Chart Structure & Pattern
The chart shows several important structures:
🔻 Descending Trendline Resistance
The yellow trendline acts as the primary resistance since the market formed a major top in the upper area. 📉
As long as price remains below this line, the macro bearish structure is still valid. ❌
However, price is now approaching the end of the trendline, and the compression zone is getting tighter. 🔍
Conditions like this often trigger a large impulsive move. 💥
---
📉 Downtrend Structure Starting to Weaken
After a long decline, bearish momentum is beginning to lose strength:
✅ Selloff is slowing down
✅ Candle bodies are getting smaller
✅ Base accumulation is forming near the lows
✅ Price is starting to create a small recovery structure
This indicates that buyers are slowly stepping into the market. 🐂
---
📦 Major Support Area
Key support levels are located around:
🟢 0.0067
🟢 0.0059 (major low)
This area has become a strong demand zone that buyers have successfully defended so far. 🛡️
As long as this support holds, the reversal opportunity remains open. 🚀
---
🚀 Bullish Scenario
✅ Bullish Trigger:
Bullish confirmation will occur if price manages to:
✔️ Break above the yellow trendline
✔️ Close strongly above the 0.0089 area
✔️ Continue the momentum toward the next resistance zones
If a valid breakout happens, the next upside targets could potentially be:
🎯 0.0107
🎯 0.0140
🎯 0.0157
🎯 0.0197
🎯 0.0227
These levels are important horizontal resistances as well as the next recovery targets. 📈🔥
---
📈 Potential Trend Reversal
If price successfully reclaims the 0.0107 area and holds above the trendline, the market structure could shift from:
🔻 Downtrend → 🔄 Sideways Accumulation → 🚀 Early Uptrend
A breakout could also trigger a short squeeze since many sell positions are likely trapped around the trendline resistance area. ⚡
---
⚠️ Bearish Scenario
The bearish scenario still needs attention because the major trend remains bearish. 🐻
❌ Bearish Confirmation:
If price fails to break out and gets rejected from the trendline again:
🔻 ALT could move lower once more
🔻 Retest lower support levels
🔻 Continue the previous downtrend
Downside targets are located around:
📉 0.0067
📉 0.0059
If support at 0.0059 breaks down, the market could enter another capitulation phase and print new lower lows. ⚠️
---
🧠 Conclusion
ALT/USDT is currently at a major decision point after a prolonged downtrend. 📊
The bearish trendline area remains the most important level to watch. 👀
📌 Trendline breakout = opens the door for a major reversal 🚀
📌 Trendline rejection = bearish trend continues 📉
At the moment, the chart is beginning to show signs of accumulation and weakening bearish momentum, but the main confirmation still depends on a valid breakout above resistance. 🔥
---
🔥 Important Trading Plan Areas
📍 Resistance:
🔸 0.0089
🔸 0.0107
🔸 0.0140
🔸 0.0157
🔸 0.0197
🔸 0.0227
📍 Support:
🟢 0.0067
🟢 0.0059
---
#ALTUSDT #ALT #Crypto 🚀 #Bitcoin #Altcoin #TradingView #CryptoTrading #TechnicalAnalysis #Breakout #Bullish 📈 #Bearish 📉 #Binance #CryptoMarket #Trader #SupportResistance #Trendline #Accumulation #Reversal #Altseason #PriceAction
ALTUSDT Floor Leverage + Xtreme Backwardation.. Patient Bull Recovery
ALTUSDT prints 0.00755 spot against 0.00750 futures with F/S ratio 2.57x↓ at 5.3% percentile — Floor territory. Volumes pair 237.64M spot / 1.79M USDT versus 614.39M futures / 4.64M USDT — premium -0.7% Xtreme Backwardation at Z -3, yield Bull -769% APY at -3σ.
Signal board stacks 24 bull to 24 bear out of 112 — dead balanced but reading Tight BULL 9.92% at 1.22x edge. Candle 8:3 and EMA 3:1 carry bulls, C>T 4:10 and DD/SS 1:8 drag bears. Ichi TK 5:7 slight bear. Spread 9.9% Tight. Squeeze has FIRED with BW at 27.12% Normal. S.Mom Con↓ at 333.3% Expanding — coil still loading.
Volume reads quiet — Spot Z -0.45 Steady, Fut Z -0.44 Steady, F+S Z -0.46. SpotZ sequence -0.45:-0.02:-0.43 Falling. Spot:Fut Normal. Bull:Bear Z 0.05:-0.56 Bullish — bear side suppressed relative to bull.
OBV Z sequence 3.39:2.75:0.64 reads Strong↑ with Sprd Div active — OBV has been flooding up on the recent bounce even as volume itself is quiet, telling you accumulation is happening on this structure. Liq Clear.
Price sits 6.4% Floor in 0.03139/0.00593 range — bottom decile. Leverage at 2.57x/5.3% percentile is absolute floor. AT Max 30.63x was 43 bars back at 0.00739/0.00703.
The honest read: ALT shows classic floor accumulation structure — leverage at 5.3% floor, price at 6.4% floor, OBV Strong↑ with Flood reading (3.39 Z), Xtreme Backwardation at -3σ meaning spot holds premium over futures (short-squeeze fuel waiting), Retrace -13% Deep already tagged Recov, Squeeze fired with momentum Con↓ still expanding. The 24:24 signal tie resolves Bull edge via stronger EMA/Candle and the OBV Flood reading is the real tell — paper is being accumulated quietly at the floor. Biggest caution: C>T 4:10 and DD/SS 1:8 still bear-weighted, meaning trend structure hasn't fully flipped yet. This is a patient accumulation setup — wait for volume to activate and C>T to flip green for confirmation. If the Xtreme Backwardation compresses while leverage stays at floor, this moves fast.
Is That Crypto Pump Real? Data Says No. Here's Why.
Stop Losing Money to Fake Volume. Find Real Moves Now.
Trade the REAL Crypto Volume. Stop Getting Faked Out.
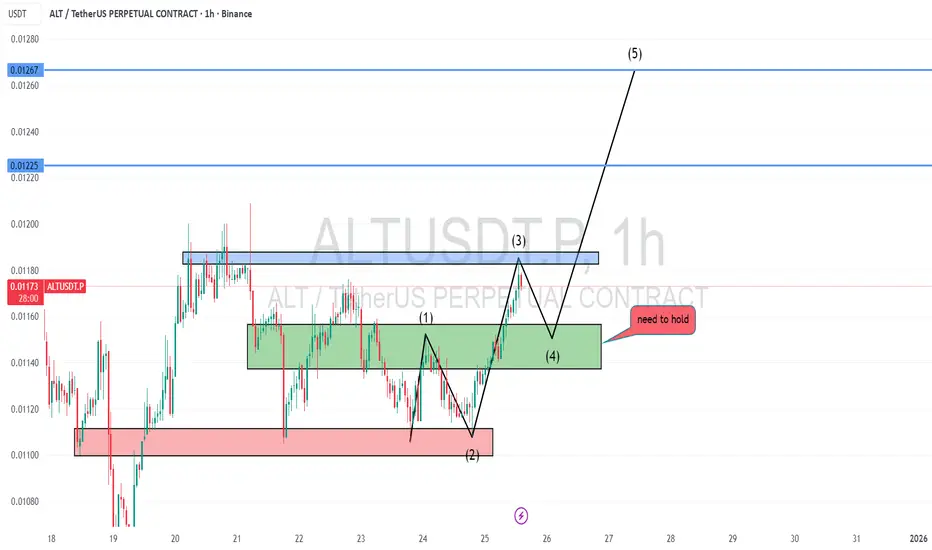
$ALT 1H CHART UPDATE
📌This is a 1 hour chart, so this is a short-term view of $ALT.
📌I’m using Elliott Wave theory to understand the move.
Right now, Wave 3 is already completed on the chart.
📌After every strong Wave 3, price usually pulls back to form Wave 4.
This pullback is normal, not a bad sign.
📌The green box on the chart is the support zone.
👉 Wave 4 must hold this zone.
📌If price holds this support and does not break below it,
then we can expect the next move up as Wave 5 🚀
📌Simple explanation for beginners:
➡️ Drop = Wave 4 (healthy correction)
➡️ Hold support = strength
➡️ Next push up = Wave 5
ALTUSDT 1D#ALT is currently trading within a falling wedge pattern on the daily chart. In case of a successful bounce from the support zone and a breakout above the wedge resistance and the daily EMA100, the potential upside targets are:
🎯 $0.02564
🎯 $0.03139
🎯 $0.03603
🎯 $0.04068
🎯 $0.04729
🎯 $0.05572
⚠️ Always remember to use a tight stop-loss and maintain proper risk management.
ALTUSDT Forming Bullish WaveALTUSDT is currently forming a bullish wavering wedge pattern, which is often seen as a strong reversal signal indicating potential upward momentum. The pattern highlights a period of consolidation where the price narrows between converging trendlines before breaking out with significant force. In ALTUSDT’s case, the consistent volume and healthy market activity support the likelihood of a breakout to the upside, aligning with the projected gain of 190% to 200%. Traders are closely watching this setup as it combines strong technical signals with rising investor enthusiasm.
The bullish wavering wedge pattern typically emerges when a market is preparing for a powerful move after an extended correction phase. For ALTUSDT, this pattern suggests that sellers are losing strength while buyers are gradually taking control. The consistent volume flow adds confidence that a breakout could lead to a substantial rally once key resistance levels are breached. This setup has historically provided high-probability trading opportunities in trending markets, especially when accompanied by growing investor attention.
The current technical outlook on ALTUSDT reflects strong accumulation, improving momentum, and renewed optimism across the broader crypto market. If the breakout confirms with strong candle closes and follow-through buying, the pair could experience a significant surge in price action. This aligns with the bullish sentiment seen in other major altcoins, reinforcing ALTUSDT’s potential for exponential growth in the upcoming sessions.
✅ Show your support by hitting the like button and
✅ Leaving a comment below! (What is You opinion about this Coin)
Your feedback and engagement keep me inspired to share more insightful market analysis with you!
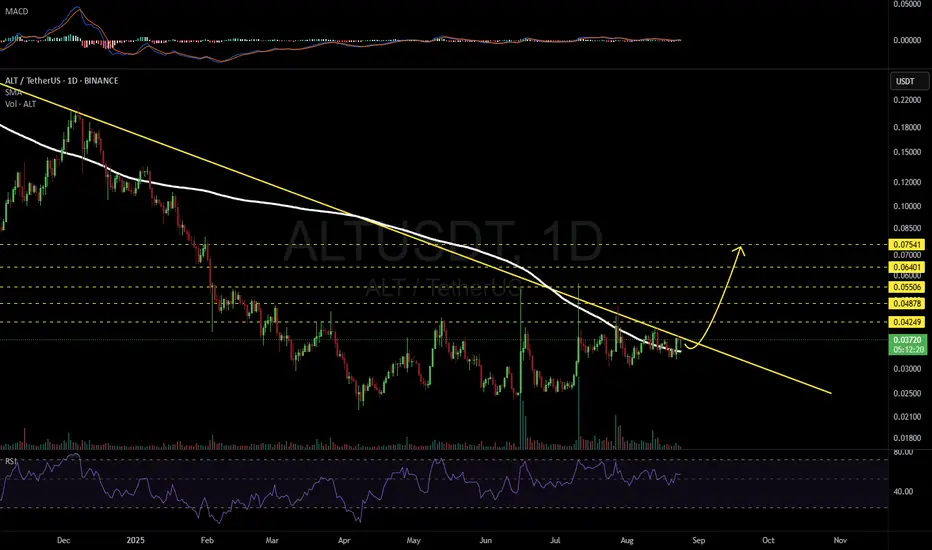
ALTUSDT 1D#ALT is moving near the descending trendline and is on the verge of breaking out above it, with the daily SMA200 acting as strong support. If a breakout occurs, the potential targets are:
🎯 $0.04249
🎯 $0.04878
🎯 $0.05506
🎯 $0.06401
🎯 $0.07541
⚠️ As always, use a tight stop-loss and apply proper risk management.
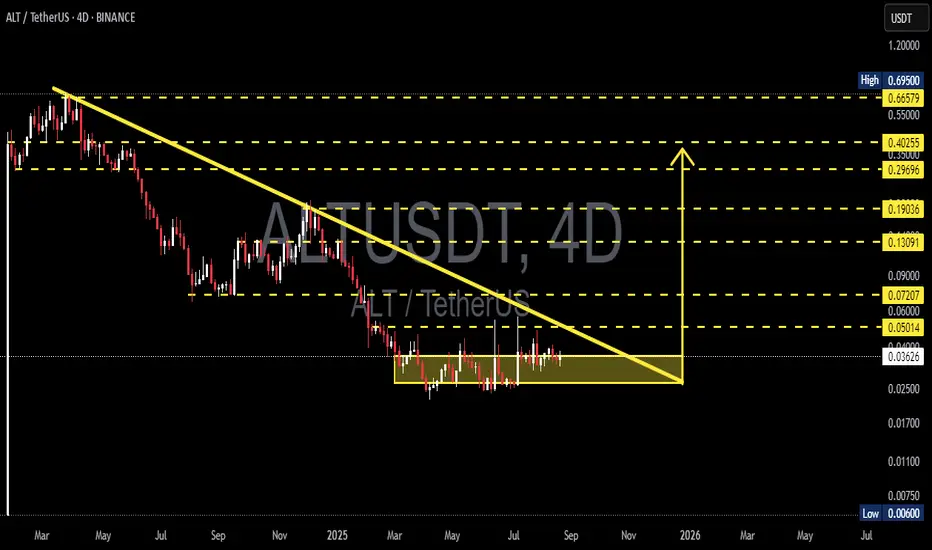
ALT/USDT — Descending Triangle: Breakout or Breakdown?🔎 Overview
ALT/USDT has been in a prolonged downtrend since 2024, consistently forming lower highs along a descending trendline. At the same time, buyers continue to defend the support base at 0.028–0.031 USDT, creating a clear Descending Triangle pattern.
Currently, price action is consolidating inside a yellow accumulation box — squeezed between strong demand below and heavy supply above. This kind of compression often ends with a large expansion move, either a breakout or a breakdown.
---
🧩 Technical Structure
Main Pattern: Descending Triangle (typically bearish continuation, but at the end of long trends it can act as a reversal).
Key Demand Zone (support): 0.028–0.031
Key Supply Zone (resistance + trendline): 0.040–0.042
Major Resistance Levels:
0.050 → 0.060 → 0.072 → 0.090 → 0.131 → 0.190 → 0.270 → 0.403 → 0.666
Support Levels if Breakdown:
0.017 → 0.011 → 0.006
---
🚀 Bullish Scenario (Potential Reversal & Breakout)
1. Confirmation: 4D close above 0.042 and a clean breakout from the descending trendline.
2. Entry Trigger: Retest of 0.040–0.042 holding as new support.
3. Short- to Mid-Term Targets:
0.050 (minor resistance)
0.060 (psychological barrier)
0.072–0.090 (major supply zone)
4. Long-Term Targets (if momentum builds): 0.130 → 0.190 → 0.270
5. Invalidation: Price closes back below 0.038–0.040 after breakout.
---
📉 Bearish Scenario (Trend Continuation)
1. Confirmation: 4D close below 0.028 with strong volume.
2. Entry Trigger: Retest of 0.028–0.031 fails to reclaim (acting as resistance).
3. Targets to the Downside:
0.017 (historical support)
0.011 (extreme support)
0.006 (all-time low risk zone)
4. Invalidation: Price reclaims above 0.031 after breakdown.
---
⚖️ Key Notes
Price is in a compression phase — the longer it consolidates inside the box, the stronger the eventual breakout or breakdown.
Watch for false breakouts/breakdowns, especially around 0.028–0.042 key levels.
The 4D timeframe provides stronger confirmation signals; patience is key.
Always manage risk: maintain R:R ≥ 1:2, scale in/out across marked levels.
---
🎯 Conclusion
ALT/USDT is at a critical decision point: Will it break out of its long downtrend and start a bullish reversal, or will sellers dominate again and push the price to fresh lows?
The Descending Triangle acts like a “technical time bomb” — pressure keeps building, and once released, it could result in a significant move.
Traders should closely watch for a confirmed breakout above 0.042 (bullish) or a breakdown below 0.028 (bearish) to determine the next major direction.
#ALTUSDT #ALT #Crypto #CryptoAnalysis #PriceAction #DescendingTriangle #Breakout #SupportResistance
AltLayer 3,000% Late 2025 Target · Bottom ConfirmedThis is a perfect chart. You can see the same drawings made by the candles compared to other altcoins we've been visiting. For example, the main low happened 7-April 2025, four months ago. So AltLayer hit bottom and has been consolidating slowly moving up.
Notice higher lows. Notice how after more than two months in June when the market tried to move lower the session ended as an inverted hammer, with high volume. The hammer as a candlestick pattern is a reversal signal. It is only a valid signal when it comes at the end of a trend. Here we have the major low in April after a major downtrend. These signals confirms the low is in and the trend will soon change.
It is true, because we already have confirmation. ALTUSDT has been challenging resistance with long upper wicks, support remains unchallenged. As this trend continues, bullish momentum will grow and a massive bullish wave will occur. AltLayer has a huge 3,000% potential for growth in the coming months. Can be a bit less but it can also end up being much more.
Namaste.
ALT/USDT - Superbullish ALT/USDT is shaping a superbullish market structure, driven by aggressive buyer pressure and consistent demand. Price has repeatedly defended the $0.035 zone, which now stands out as a strong base support—a clear sign of accumulation and market confidence.
This level has acted as a springboard for multiple bullish pushes, with buyers stepping in early and heavily on every dip. The chart suggests that momentum is coiling tightly for an upcoming parabolic move as demand continues to outpace supply.
ALTUSDT Forming Bullish ReversalALTUSDT is currently displaying a bullish reversal pattern that may mark the beginning of a significant trend change. After a prolonged period of downward or sideways movement, the asset has shown signs of accumulation, with increasing volume and a shift in price structure. This type of reversal formation typically signals that buyers are stepping back into the market with strength, aiming to reclaim lost levels and push higher.
Technically, the chart structure supports a strong recovery potential, as the price is attempting to break out of a consolidation zone with solid momentum. The bullish reversal pattern suggests that sellers have likely exhausted their control, and a trend shift is underway. With increasing interest and engagement around the ALT project, both technically and sentimentally, a price surge in the range of 90% to 100% becomes a realistic expectation.
From a market sentiment perspective, ALT is regaining attention from crypto traders due to recent development updates and growing adoption potential in its ecosystem. Investors are beginning to identify ALT as a sleeper altcoin that may deliver above-average returns once the reversal is confirmed. This momentum is backed by improved volume and clear buying pressure on critical support levels.
A confirmed breakout above resistance, with sustained volume, could act as the catalyst for a parabolic move. Traders should monitor this setup closely, as it may offer one of the best reward-to-risk ratios in the current market cycle. ALTUSDT could be setting up for a major rally in the coming days or weeks.
✅ Show your support by hitting the like button and
✅ Leaving a comment below! (What is You opinion about this Coin)
Your feedback and engagement keep me inspired to share more insightful market analysis with you!
ALT- Trading idea.
Altlayer - emerges as a decentralized protocol designed to revolutionize the blockchain landscape by simplifying the launch of native and restaked rollups. These rollups, which can be based on optimistic or zk-rollup stacks, benefit from enhanced security, decentralization, and interoperability. The protocol’s innovative approach includes the concept of restaked rollups, leveraging mechanisms from various rollup stacks such as OP Stack, Arbitrum Orbit, Polygon CDK, and ZK Stack.
A key feature of Altlayer is its native utility token, ALT, which serves multiple functions within the ecosystem. ALT is used for economic bonding, governance, protocol incentives, and payment of protocol fees. This tokenomics model ensures that ALT holders play a significant role in maintaining and managing the network.
Binance Labs has invested in this coin.
-----------------------------------------------------
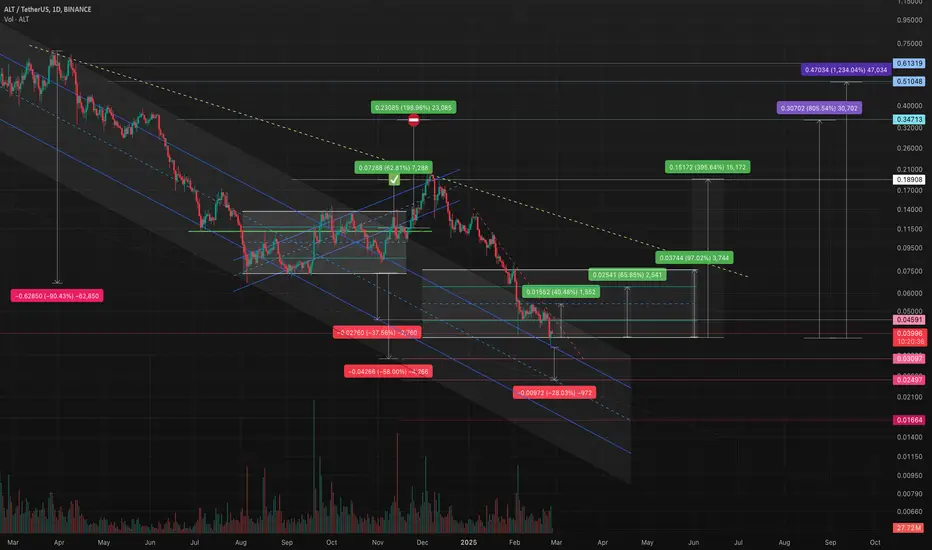
✅ The previous trading idea closed only one sell zone, gaining +97% since publication. The remaining position was stopped out around +70%.
⤵️ The price then retraced back into the descending channel, following the overall market sentiment.
Logically, there are a few possible scenarios:
1️⃣ - A sideways range starts to form (a channel within a channel).
2️⃣ - A V-shaped recovery from the current levels.
3️⃣ - A continued decline within the descending channel.
🛒 From the allocated amount for this coin and the previously locked-in profit, I’m starting to build a position.
ALTUSDT Forming Potential BreakoutALTUSDT is shaping up to be an interesting opportunity for crypto traders watching for potential breakout plays. The pair has recently tested a strong horizontal support zone multiple times, forming a solid base around that level. This accumulation range is a key area where buyers seem to step in aggressively, suggesting that a bounce and a trend reversal could be on the horizon. The technical outlook points toward a projected gain of around 90% to 100%+, which could attract more traders looking for high risk-to-reward setups in the altcoin market.
The trading volume remains healthy on ALTUSDT, confirming that there’s good liquidity and market participation to fuel a potential rally. When volume supports the price action like this, it generally adds strength to the bullish case. Many traders keep an eye on such setups because once the price breaks out from the consolidation phase, it often does so with momentum that can yield quick returns. The chart also shows early signs of a move upward with bullish candles forming off the support zone.
Investors are increasingly taking interest in the project behind ALTUSDT, drawn not just by its technical potential but by the community sentiment and developmental updates. This is critical because strong fundamentals combined with a bullish technical pattern can create the perfect storm for a powerful price surge. As the crypto market enters a more optimistic phase, coins like ALTUSDT could see amplified moves as traders look to rotate capital into promising altcoins with clear breakout setups.
✅ Show your support by hitting the like button and
✅ Leaving a comment below! (What is You opinion about this Coin)
Your feedback and engagement keep me inspired to share more insightful market analysis with y
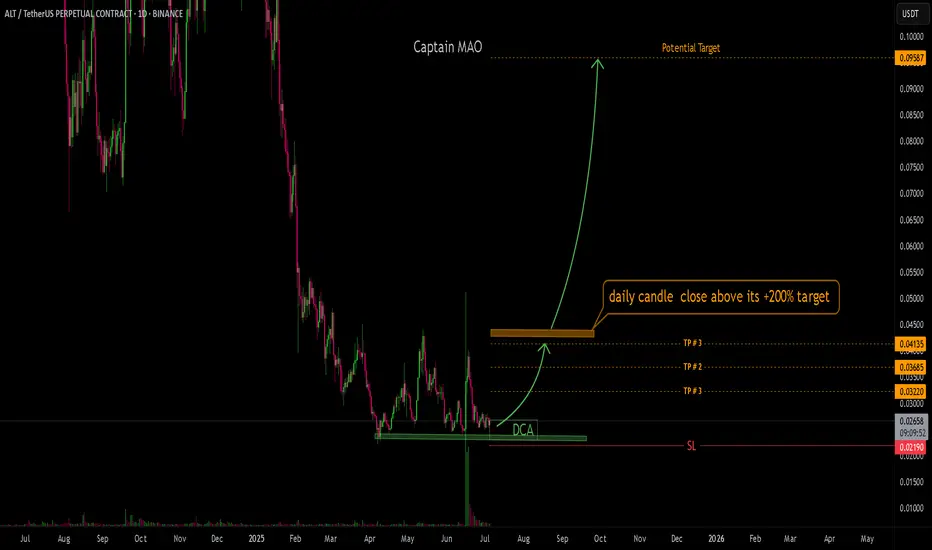
ALT/USDT +200%ALT recently delivered a powerful +100% pump, showcasing the strength of the $0.024 – $0.025 demand zone. After a healthy 50% retracement from the previous leg up, price action is now stabilizing and forming a new support base around the $0.025 – $0.026 zone — a classic setup for the next major move.
With bullish structure starting to rebuild, this could be the early stage of a fresh leg up, offering a potential +200% upside from current levels.
Entry Zone: $0.025 – $0.026 (Current Market Price)
DCA Zone: $0.023 – $0.026
Targets:
• TP1: $0.0322
• TP2: $0.0368
• TP3: $0.0415
Stop Loss: Below $0.022 (adjust based on personal risk)
ALTUSDT Forming Falling WedgeALTUSDT has recently completed a breakout from a well-formed falling wedge pattern, a strong bullish technical signal that often precedes significant upward momentum. The wedge breakout is backed by a noticeable spike in trading volume, adding credibility to the move and indicating growing market participation. This classic reversal pattern suggests that a major trend shift could be underway, and price projections indicate a potential gain in the range of 70% to 80%, aligning with historical performance of such breakouts.
What makes this setup more compelling is the structure of the wedge itself—tight, consistent, and with clear lower highs and lower lows, followed by a strong bullish candle cutting through resistance. This is a textbook example of a bullish breakout where the price decisively exits the consolidation zone and starts trending upward. With volume confirming the breakout, many traders see this as an early-stage rally signal with room to grow.
Investor sentiment around ALTUSDT is gaining strength, particularly on social platforms and trading communities. This surge in attention could fuel further buying pressure, particularly as the breakout becomes more visible to retail and technical traders. ALTUSDT has shown the ability to move sharply during bullish phases, and this breakout could signal the beginning of a new leg higher, especially if it maintains momentum over the next few daily closes.
With strong technical structure, increasing investor interest, and supportive volume, ALTUSDT is shaping up to be one of the stronger bullish breakout candidates in the current market environment. Traders looking for high-reward setups may find this an ideal entry point with a well-defined technical framework and attractive upside potential.
✅ Show your support by hitting the like button and
✅ Leaving a comment below! (What is You opinion about this Coin)
Your feedback and engagement keep me inspired to share more insightful market analysis with you!
Altcoins Market Bull Market Confirmed, AltLayerThis is just one, another one, but this theme will continue to repeat over and over, again and again.
Here AltLayer is producing a three digits strong bullish breakout; the highest volume ever today and this confirms the start of the 2025 altcoins market bull market.
Total growth amounts to more than 115% in the past few hours. This is similar to what we saw with Ravencoin and Axelar, these projects produced three digits green in a single day and the market is producing a bullish continuation on those, here it will do so as well.
This is only the start, prepare for maximum growth.
If you enjoy the content, consider hitting follow. I will be sharing new altcoins daily for year to come.
Namaste.
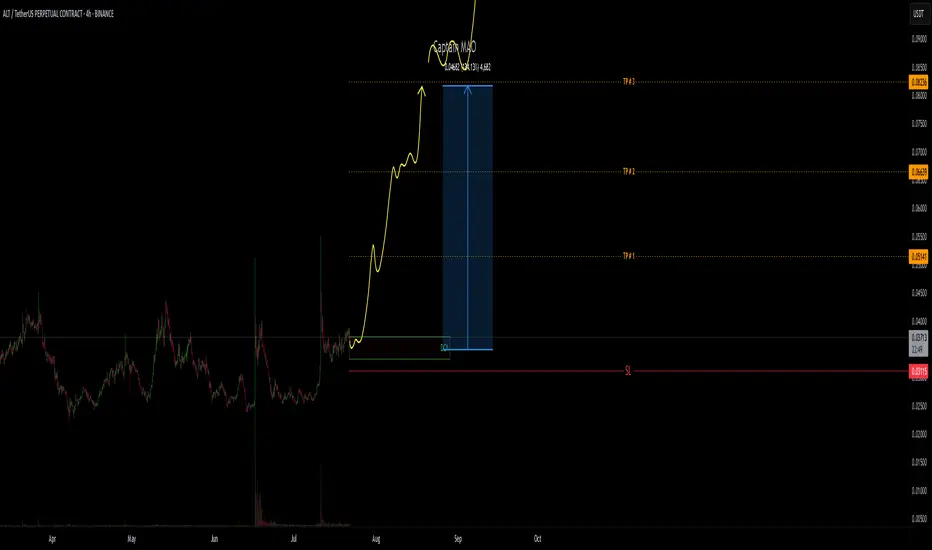
Alt rivers and jump in terminal mood pattern Daily chart Finishing a terminal fractal While the downtrend is expansive The flat waves and patterns promise a near 100% uptrend The 4-hour chart is completing a flat terminal pattern According to the pattern, it could overshadow today's price from tomorrow and continue to grow until the price target is above the resistance level of 150
$ALT Breaks 136-Day Resistance — Big Rally Loading?#ALT has officially broken above the 136-day-long resistance.
Price is now consolidating above the breakout zone, showing strength.
If momentum continues, a major rally could be ahead.
Watching closely for confirmation of the next move.
NASDAQ:ALT BINANCE:ALTUSDT