

Compare with Roundhill Sports Betting & iGaming ETF
Key stats
Fund info
Home page
Inception date
Jun 4, 2020
Structure
Open-Ended Fund
Replication method
Physical
Dividend treatment
Distributes
Distribution tax treatment
Qualified dividends
Income tax type
Capital Gains
Max ST capital gains rate
39.60%
Max LT capital gains rate
20.00%
Primary advisor
Roundhill Financial, Inc.
Distributor
Foreside Fund Services LLC
ISIN
US53656F7895
CUSIP
53656F789
FIGI
BBG00V7866V2
Identifiers
ISIN US53656F7895
BETZ is the second ETF by RoundHill investments and the first ETF to offer global passive exposure to sports betting and iGaming companies. This includes companies that are actively involved in analyzing sports events and wagering, as well as those involved with online betting. Eligible companies are scored from 1 to 4, depending on their involvement in the sports betting and iGaming industry, with companies deriving more than 50% of their revenue from the theme assigned the highest score of 4. Components are weighted in proportion to both their combined theme score and their free-float market capitalization, with higher theme scores receiving heavier tilt factors. The index is rebalanced and reconstituted annually in December. Prior to October 2, 2023, the fund tracked the Roundhill Sports Betting & iGaming Index.
Classification
What's in the fund
Exposure type
Consumer Services
Mutual fund
Government
Breakdown by region
Top 10 holdings

Roundhill Sports Betting & iGaming (BETZ) Short IdeaSuch a beautiful short setup for BETZ in my opinion. Just sharing my trading plan, not meant as advice.
Short
$BETZ is below the channel, upside looks weaker$BETZ the popular betting ETF looks to be loosing some steam on the daily chart. The stock recently broke the bottom of the channel (that has a slight downward trend) and is now below the recently started 200MA. Our entry points for this stock are $25.x and $22.x ATM.
Look for a continuation t
 Short
Short Long
Long
Sports betting - a multi billion business globallyAnother requests from a follower based in Singapore. Here, in our country, there are many forms of sports betting like Singapore Pools where you can try your luck on sports betting like soccer matches, lottery tickets and horse betting.
Too bad, these are government owned and they are not publi
Long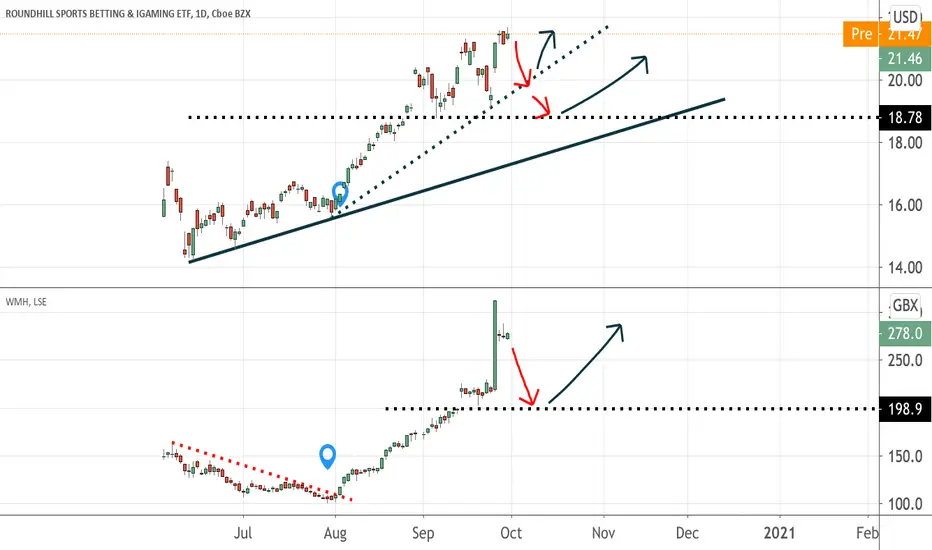
Long huge money to makeHuge potential big boost in market coming from cuomo about to pass legal gambling
Long
 Long
Long
Roundhill Sports ETF: Time to Watch: USAHappy New Year
By Sun Storm Investment Research
A Profit & Solutions Strategy
Disclaimer: I am not a financial advisor, so please do your own research before trading anything

See all ideas
Summarizing what the indicators are suggesting.
Oscillators
Neutral
Oscillators
Neutral
Summary
Neutral
Summary
Neutral
Summary
Neutral
Moving Averages
Neutral
Moving Averages
Neutral
Displays a symbol's price movements over previous years to identify recurring trends.
Frequently asked questions
An exchange-traded fund (ETF) is a collection of assets (stocks, bonds, commodities, etc.) that track an underlying index and can be bought on an exchange like individual stocks.
BETZ trades at 17.38 USD today, its price has fallen −0.31% in the past 24 hours. Track more dynamics on BETZ price chart.
BETZ net asset value is 17.49 today — it's fallen 10.68% over the past month. NAV represents the total value of the fund's assets less liabilities and serves as a gauge of the fund's performance.
BETZ assets under management is 43.63 M USD. AUM is an important metric as it reflects the fund's size and can serve as a gauge of how successful the fund is in attracting investors, which, in its turn, can influence decision-making.
BETZ price has fallen by −11.78% over the last month, and its yearly performance shows a −28.45% decrease. See more dynamics on BETZ price chart.
NAV returns, another gauge of an ETF dynamics, have fallen by −10.68% over the last month, showed a −7.42% decrease in three-month performance and has decreased by −25.03% in a year.
NAV returns, another gauge of an ETF dynamics, have fallen by −10.68% over the last month, showed a −7.42% decrease in three-month performance and has decreased by −25.03% in a year.
BETZ fund flows account for −18.39 M USD (1 year). Many traders use this metric to get insight into investors' sentiment and evaluate whether it's time to buy or sell the fund.
Since ETFs work like an individual stock, they can be bought and sold on exchanges (e.g. NASDAQ, NYSE, EURONEXT). As it happens with stocks, you need to select a brokerage to access trading. Explore our list of available brokers to find the one to help execute your strategies. Don't forget to do your research before getting to trading. Explore ETFs metrics in our ETF screener to find a reliable opportunity.
BETZ invests in stocks. See more details in our Profile section.
BETZ expense ratio is 0.75%. It's an important metric for helping traders understand the fund's operating costs relative to assets and how expensive it would be to hold the fund.
No, BETZ isn't leveraged, meaning it doesn't use borrowings or financial derivatives to magnify the performance of the underlying assets or index it follows.
In some ways, ETFs are safe investments, but in a broader sense, they're not safer than any other asset, so it's crucial to analyze a fund before investing. But if your research gives a vague answer, you can always refer to technical analysis.
Today, BETZ technical analysis shows the strong sell rating and its 1-week rating is strong sell. Since market conditions are prone to changes, it's worth looking a bit further into the future — according to the 1-month rating BETZ shows the strong sell signal. See more of BETZ technicals for a more comprehensive analysis.
Today, BETZ technical analysis shows the strong sell rating and its 1-week rating is strong sell. Since market conditions are prone to changes, it's worth looking a bit further into the future — according to the 1-month rating BETZ shows the strong sell signal. See more of BETZ technicals for a more comprehensive analysis.
Yes, BETZ pays dividends to its holders with the dividend yield of 5.52%.
BETZ trades at a premium (0.61%).
Premium/discount to NAV expresses the difference between the ETF’s price and its NAV value. A positive percentage indicates a premium, meaning the ETF trades at a higher price than the calculated NAV. Conversely, a negative percentage indicates a discount, suggesting the ETF trades at a lower price than NAV.
Premium/discount to NAV expresses the difference between the ETF’s price and its NAV value. A positive percentage indicates a premium, meaning the ETF trades at a higher price than the calculated NAV. Conversely, a negative percentage indicates a discount, suggesting the ETF trades at a lower price than NAV.
BETZ shares are issued by Roundhill Financial, Inc.
BETZ follows the No Underlying Index. ETFs usually track some benchmark seeking to replicate its performance and guide asset selection and objectives.
The fund started trading on Jun 4, 2020.
The fund's management style is active, aiming to outperform its benchmark index by actively selecting and adjusting assets. The goal is to achieve returns that exceed those of the index the fund tracks.