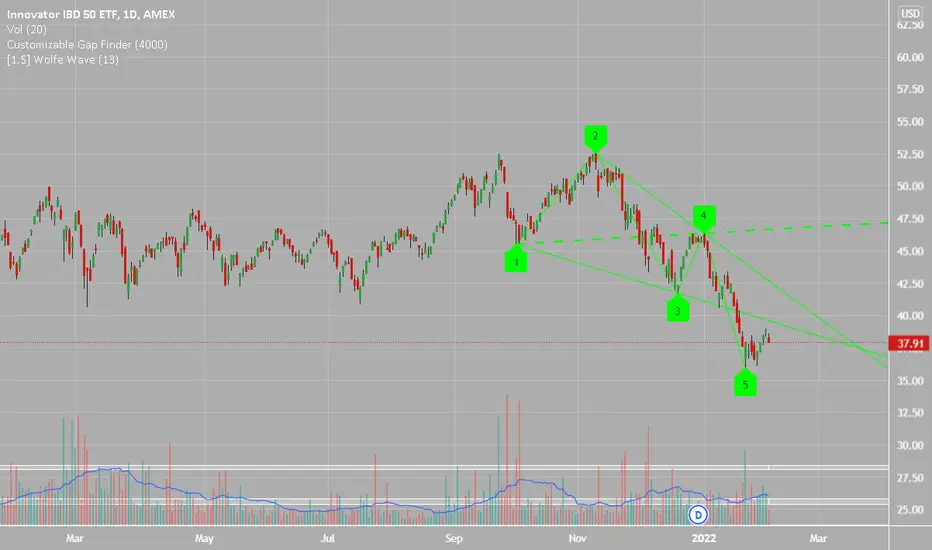
$FFTY Forming a VCP (Volatility Contraction Pattern)?AMEX:FFTY looks to me like it is working on a VCP with volatility shrinking and forming a nice wedging pattern. I like this pattern “IF” or when the market turns positive.
Here are the negative things I see, as of now it is trading below or right at the 18-month AVWAP. It is right at shorter term resistance. It is below the downward sloping wedge trendline. And the RS is still declining.
On the Positive side I see current price is about 11% below the 52-week high. Price is above all the movi
In-depth trading ideas
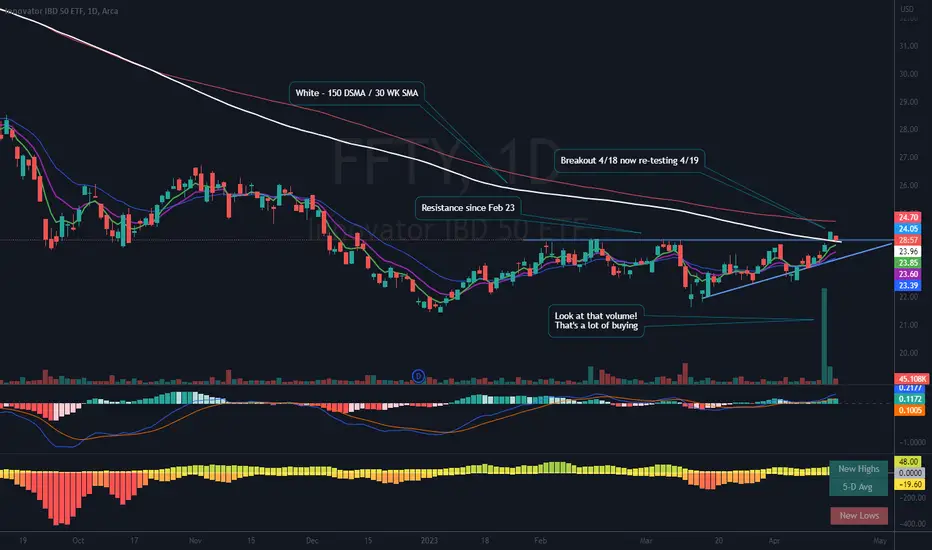
$FFTY Breakout / Re-Test?AMEX:FFTY The Innovator IBD 50 ETF – This ETF is sponsored by Investor’s Business Daily (IBD) It holds high beta / high growth names mostly mid and small caps. I like it for its holdings, very similar to AMEX:ARKK except that the holdings in AMEX:FFTY rotate a little more than $ARKK. Like AMEX:ARKK , this is a good barometer of risk-on / risk-off in the market.
Here is what I see on the chart (most is notated on the chart). Break above both the resistance area and move over the 30 Week SM
Important week for IBD 50 - Growth traders, pay attentionThe IBD 50 broke out of its 7 month long symmetrical triangle yesterday on the daily time frame. How it finishes on Friday will be key for the weekly close
The false break down in July makes me more confident that we'll see follow through to the upside. A lot of growth traders / investors hold companies in this index.
Here's a link to its holdings (updated July 28 2021)
ycharts.com
A lot of names in there look very good - some better than others. Choose wisely.
GL
FFTY and SnP 500 could go hand in hand until mid DecemberWeekly Triple negative divergence in FFTY for the RSI and MFI - not shown here but you can quickly check it.
No trading advice here. Chart and comments are for entertainment and educational purposes only. For Trading Advice, seek out a professional.
Is rotation to growth in the horizon? $FFTYThe Innovators ETF AMEX:FFTY is being underperforming the TVC:SPX since February. This ETF is concentrated in growth stocks; so is a good barometer for that sector of the market. I see a volatility contraction pattern (VCP) with lowering volume, classic pattern before a crazy breakout. This breakout could be upward or downward, the thing is to be reactive.
At the moment its relative strength against the TVC:SPX haven't indicated anything bullish, and the price is below the 20 day and 50
IBD50 (FFTY) vs. S&P 500 (SPY)The Investor's Business Daily IBD 50 is a popular watchlist used by many to pick stocks with bullish momentum. It has been made into an actively managed ETF by Innovator Funds as AMEX:FFTY . This chart compares how the ETF is performing vs. AMEX:SPY YTD. On a quick visual glance, it seems to basically track S&P with higher beta, eyeballing this at maybe 1.25 Beta, slightly higher highs and lower lows, as would be expected by momentum plays. Qualitatively speaking, it seems not to definiti