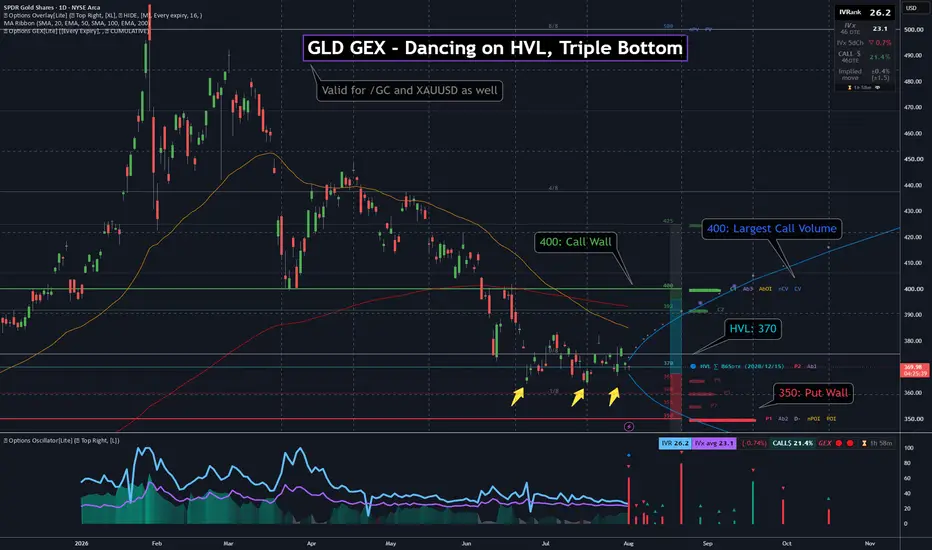
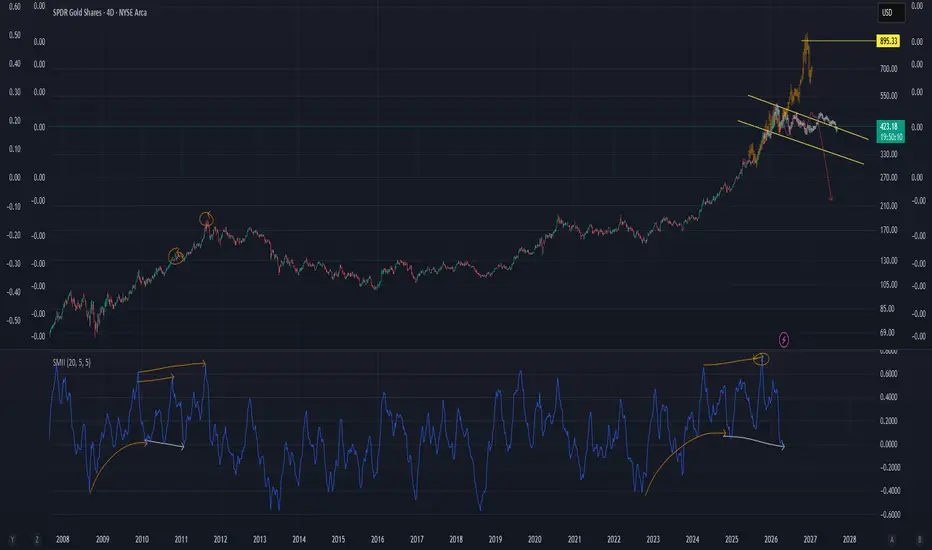
GLD GEX - Dancing on HVL, Triple BottomGLD has carved a triple bottom into the mid-360s / high-360s and is now dancing on the HVL at 370 — the gamma flip. Spot at 370.35 sits just above that pivot, so the tape is still in a positive GEX regime , but only by a hair.
That makes 370 the story: not a random round number, but where absolute gamma (Ab1), the #2 put wall (P2), and the regime line stack together. Price has defended this zone three times. The upside magnet is the 400 call wall (C1) ; the structural floor is the 350 put wall (P1) .
🔶 Regime Context 🔶
Spot is holding above HVL 370 , so the framework stays supportive — but GLD is living on the flip line, not safely extended above it. A clean loss of 370 would flip the regime read and reopen the path toward the put wall cluster below.
🔶 Options Structure Context 🔶
👉 400 – C1 (highest call NETGEX wall)
That is the primary upside reference on this 46 DTE cumulative map. The strongest call flow also landed at 400 ( CV + nCV ) — so the wall and the near-dated call volume peak rhyme.
👉 392 – C2 | 380 – C3 — intermediate call walls on the way up.
🔶 Downside Structure 🔶
👉 370 – HVL / Ab1 / P2 / D−
Confluence at 370:
HVL — gamma flip / regime pivot
Ab1 — largest absolute gamma
P2 — #2 put wall
D− — largest negative delta exposure peak
That is why the triple-bottom defense here matters: it is a multi-metric reaction zone, not just chart pattern geometry.
👉 350 – P1 / POI / nPOI
Confluence at 350:
P1 — highest put NETGEX wall
POI — highest put open interest
nPOI — net put OI peak
Together, 350 is the clear downside put-wall floor if 370 fails.
👉 360 – P3 — next put wall between HVL and P1.
🔶 Options Sentiment 🔶
CALL$ 21.4% (46 DTE) means call options at an equivalent distance from spot are priced 21.4% higher than the corresponding puts — mild call pricing skew , not an extreme bid.
🔶 Key Structure to Watch 🔶
370 — HVL / Ab1 / P2 — hold = triple-bottom thesis alive
400 — C1 call wall + CV/nCV — upside level
350 — P1 / POI — put-wall floor if HVL breaks
For now, GLD is a HVL hold + triple bottom structure inside a clean 350–400 GEX box.
The key question is whether 370 keeps absorbing dips and price can build toward 400 — or whether a break below HVL opens the slide into the 350 put wall.
In-depth trading ideas
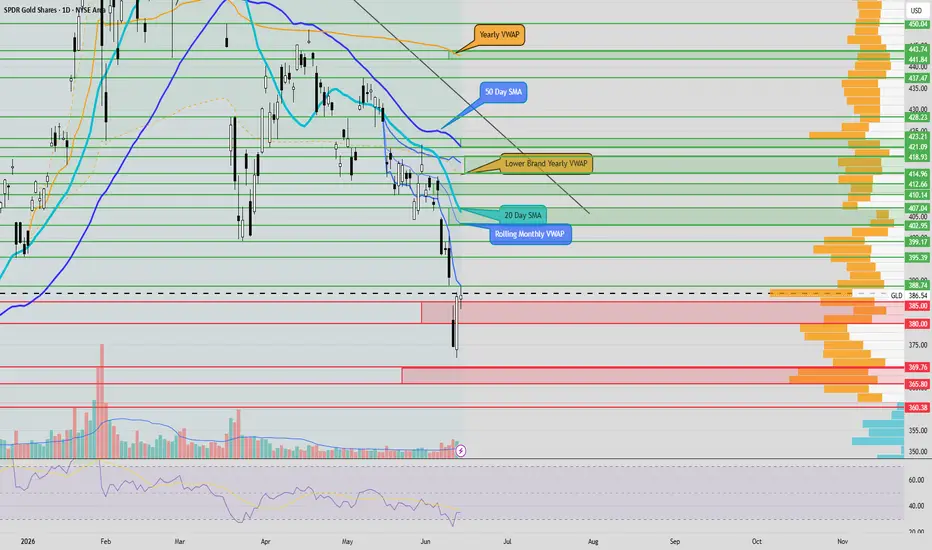
GLD - Week of July 27See levels and key areas for this week:
After you click the link, click “Grab this Chart” at the bottom/right of the chart or Load Live Bars on far middle-right.
“Grab this Chart” opens a copy of the chart environment, but it doesn’t automatically save as a permanent layout in your dashboard. Once the chart opens, you need to manually save it as your own layout by clicking the cloud/save icon at the top of TradingView , “Save As”, name the layout. After that it will show up in your saved layouts/dashboard going forward.
GLD - Week of July 20thSee levels and key areas for this week:
After you click the link, click “Grab this Chart” at the bottom/right of the chart or Load Live Bars on far middle-right.
“Grab this Chart” opens a copy of the chart environment, but it doesn’t automatically save as a permanent layout in your dashboard. Once the chart opens, you need to manually save it as your own layout by clicking the cloud/save icon at the top of TradingView , “Save As”, name the layout. After that it will show up in your saved layouts/dashboard going forward.
GLD - Week of July 13thSee levels and key areas for this week:
After you click the link, click “Grab this Chart” at the bottom/right of the chart or Load Live Bars on far middle-right.
“Grab this Chart” opens a copy of the chart environment, but it doesn’t automatically save as a permanent layout in your dashboard. Once the chart opens, you need to manually save it as your own layout by clicking the cloud/save icon at the top of TradingView , “Save As”, name the layout. After that it will show up in your saved layouts/dashboard going forward.
GLD - Week of July 6thSee levels and key areas for this week:
After you click the link, click “Grab this Chart” at the bottom/right of the chart or Load Live Bars on far middle-right.
“Grab this Chart” opens a copy of the chart environment, but it doesn’t automatically save as a permanent layout in your dashboard. Once the chart opens, you need to manually save it as your own layout by clicking the cloud/save icon at the top of TradingView , “Save As”, name the layout. After that it will show up in your saved layouts/dashboard going forward.
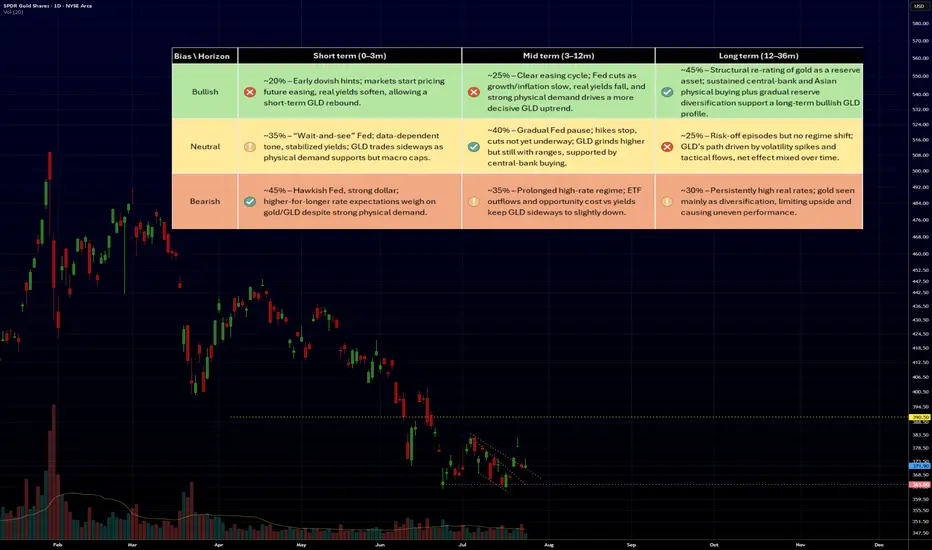
Is Gold's Rally Dead, or Coiled for $7,000?Gold's rally is not dead, but it has cooled sharply. After peaking near $5,589 in late January 2026, the metal corrected about 25% and now trades around $4,200 to $4,500, a slide that included its worst month since 2013. The cause is cyclical rather than structural. A hawkish Federal Reserve has signaled no rate cuts in 2026, and possibly hikes if energy-driven inflation persists, while elevated real yields raise the opportunity cost of holding a non-yielding asset. A firmer dollar and a retreat in ETF and speculative demand have added to the pressure.
Yet the floor under gold has rarely been firmer, which is why this looks like consolidation rather than collapse. Central banks have become the dominant, price-insensitive buyers, purchasing more than 1,000 tonnes a year from 2022 through 2024 and 863 tonnes in 2025, roughly double the pre-2022 norm. They buy as policy, not as a trade, and they do not sell on weak days. Combined with accelerating de-dollarization, with BRICS nations now holding 17.4% of global reserves and gold overtaking the euro as the second-largest reserve asset, plus US debt above $36 trillion, that demand has turned the $4,300 to $4,500 zone into structural support rather than a ceiling.
That tension defines the price debate. The mainstream base case for end-2026 clusters between roughly $4,900 and $6,300, with Goldman Sachs near $4,900, UBS at $5,500, and J.P. Morgan and Wells Fargo around $6,000 to $6,300. The $7,000 headline is a real forecast, but a conditional one. UBS sees $7,200 only if geopolitical risks escalate materially, and Bank of America's $8,000 is a 2027 bull case. Reaching $7,000 requires a fresh catalyst, renewed Fed easing, a geopolitical shock, or a return of ETF inflows, not merely the structural bid already in place.
The honest read is that the rally is neither dead nor charging to $7,000 today. It is consolidating, pinned between a cyclical ceiling and a structural floor, waiting for a catalyst to break the deadlock. The asymmetry is what matters for investors. The downside looks limited because price-insensitive central banks keep absorbing dips, while the upside to $7,000 depends on the Fed pivoting or geopolitics re-escalating. The signals to watch are real yields, the Fed's path, ETF flows, and the resolution of the Iran conflict. Until one of those turns, gold grinds sideways on a firm floor, a coiled spring rather than a dead rally.
GLD Week of June 29See levels and key areas for this week:
After you click the link, click “Grab this Chart” at the bottom/right of the chart or Load Live Bars on far middle-right.
“Grab this Chart” opens a copy of the chart environment, but it doesn’t automatically save as a permanent layout in your dashboard. Once the chart opens, you need to manually save it as your own layout by clicking the cloud/save icon at the top of TradingView , “Save As”, name the layout. After that it will show up in your saved layouts/dashboard going forward.
GOLD GLD JUN - 2026GLD has broken its primary uptrend and is now testing one of the most important institutional distribution zones around $401.
Key levels to monitor:
Major Distribution: $509 (7B Sold)
Resistance: $450
Institutional Distribution: $401 (4.6B Sold)
Gap Zones: $400 and $430
Major Support: $350-$340
Institutional Orders: $300-$280
The $401 level has become the key pivot. A recovery above this zone could trigger a move toward the $430 gap and eventually the $450 resistance. Failure to reclaim $401 increases the probability of a deeper correction into the $350-$340 institutional support zone.
This analysis is based on institutional market structure, volume, liquidity, and support/resistance—not financial advice.
GLD Week of June 22ndSee levels and key areas for this week:
After you click the link, click “Grab this Chart” at the bottom/right of the chart or Load Live Bars on far middle-right.
“Grab this Chart” opens a copy of the chart environment, but it doesn’t automatically save as a permanent layout in your dashboard. Once the chart opens, you need to manually save it as your own layout by clicking the cloud/save icon at the top of TradingView , “Save As”, name the layout. After that it will show up in your saved layouts/dashboard going forward.
GLD Week of June 15See levels and key areas for this week:
After you click the link, click “Grab this Chart” at the bottom/right of the chart or Load Live Bars on far middle-right.
“Grab this Chart” opens a copy of the chart environment, but it doesn’t automatically save as a permanent layout in your dashboard. Once the chart opens, you need to manually save it as your own layout by clicking the cloud/save icon at the top of TradingView , “Save As”, name the layout. After that it will show up in your saved layouts/dashboard going forward.
GLD Week of June 8See levels and key areas for this week:
After you click the link, click “Grab this Chart” at the bottom/right of the chart or Load Live Bars on far middle-right.
“Grab this Chart” opens a copy of the chart environment, but it doesn’t automatically save as a permanent layout in your dashboard. Once the chart opens, you need to manually save it as your own layout by clicking the cloud/save icon at the top of TradingView , “Save As”, name the layout. After that it will show up in your saved layouts/dashboard going forward.
GLD lows for rest of year??I dowse for my information on stocks. Meaning, swinging a pendulum over possibilities & let it show me. I also have an app that flagged it yesterday in an unusual way.
Additionally, yesterday was a date to be aware of in GLD for a buy, but my level was 402 (from a reading back on 5/4.
A new reading yesterday had heavy energy, so I knew we would probably hit it this morning, but the target shifted upward to 405.
It's totally possible they go lower & hit the 402, but regardless, I get that gold & silver are going to have a really nice move up. I'll do an idea for SLV as well.
I did ask for timing to hit the target, though I don't totally trust it, but it gave December this year.
(extra bonus synchronicity, David Bowie Golden Years came on!)
GLD Daily — Buyers Still Have Work To DoAMEX:GLD is bouncing, but I’m not treating this as bullish control yet.
This chart has one main message:
Buyers are not in full control until they remove the bearish sequence.
Right now, price is pressing back into the sellers’ reload zone. That matters because this is the exact area where weak bullish bounces usually get tested. A bounce into resistance is not strength by itself. It only becomes strength when price breaks the structure that is keeping the bearish idea alive.
For me, the key level is simple:
The bearish sequence invalidation point.
Until AMEX:GLD breaks that point, the lower bearish target remains part of the map.
That does not mean price must collapse.
It means the chart has not earned a clean bullish reading yet.
What I’m watching:
If sellers defend this reload zone, the bearish target below becomes the next logical draw.
If buyers break through the invalidation point, then the bearish sequence loses authority and the chart needs to be reassessed from a bullish continuation perspective.
The lower buyer reload area is also important. If price reaches it, I would not treat it as random weakness. I would treat it as a major reaction zone where longer-term buyers may step back in.
So the chart is not about guessing gold.
It is about pressure.
Sellers are defending from the reload zone.
Buyers need to prove they can break the invalidation point.
Until that happens, I’m not giving the bounce more credit than it deserves.
Not financial advice.
Is Gold waking up again?Again, indicators are starting to show bullish signals on gold.
Nothing confirmed yet, but signals are there so I’ll try to front-run the gold comeback.
Note: if I don’t see confirmation will close the trade around $125.
Remember I can’t show my indicators since they are private and TradingView won’t let me publish the trade idea with them on chart.
Cheers