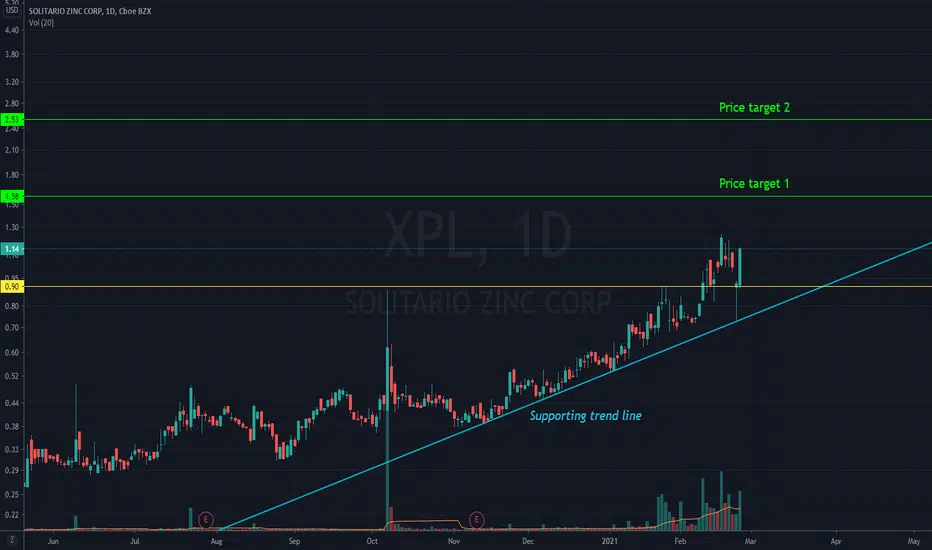
XPL Building Pressure Above $0.81 — Break Could Trigger Quick UpCurrent Price: 0.81
Direction: LONG
Confidence level: 57%(Social sentiment slightly favors bullish positioning and trader commentary highlights strong support and possible breakout momentum, but lack of YouTube and Reddit data lowers conviction.)
Targets
Target 1: 0.83
Target 2: 0.86
Stop Levels
Stop 1: 0.79
Stop 2: 0.76
Wisdom of Professional Traders:
This analysis synthesizes insights from thousands of professional traders and market experts, combining what traders are saying across social sentiment and market intelligence feeds. When many traders discuss similar technical levels or momentum signals, it often helps reveal where the crowd expects price reactions. In the case of XPL, the trader discussions I tracked show a slight bullish lean driven by momentum signals and strong support levels.
Key Insights:
Here's what's driving this setup. Trader commentary repeatedly points to a strong support zone holding beneath current price action. Several traders highlighted a key technical threshold equivalent to the Kijun trend level around the lower support region. As long as price stays above that zone, buyers appear willing to step in.
Another interesting factor is social sentiment. The trading community on X shows more bullish signals than bearish ones, even though conviction isn't extremely strong. Many traders are watching for momentum continuation after recent volatility, and that creates conditions where even modest buying pressure can push price higher in the short term.
The real story here is positioning. When I look at the order flow data and sentiment chatter, it suggests traders are cautiously accumulating rather than aggressively selling. That doesn't guarantee a rally, but it does tilt the probabilities slightly toward upside continuation this week.
Recent Performance:
XPL has been volatile recently, moving sharply within a wide trading band. Over the last several sessions the asset bounced between lower support zones and short‑term resistance areas, reflecting uncertainty among traders. Despite these swings, the price structure is still holding above the key support region that traders keep mentioning. That stability is important because assets that hold support during volatility often attempt another push upward.
Expert Analysis:
Several professional traders I tracked mentioned that momentum indicators have shifted positive compared with earlier bearish conditions. Price is currently positioned above short‑ and medium‑term moving averages, which many traders interpret as early bullish momentum.
At the same time, traders are closely watching the upper resistance band. Multiple traders pointed to a breakout trigger above the nearby resistance cluster. If buyers manage to push through that zone, momentum traders could pile in quickly. That’s why my second target sits slightly higher at $0.86 — it captures the potential short squeeze scenario.
News Impact:
One factor that caught traders’ attention is a large token transfer linked to the project team moving funds to a centralized exchange. Events like that sometimes lead to selling pressure, which explains the volatility we've seen recently. However, market data also shows substantial buying activity from exchange users over the same period. So far, the demand appears strong enough to offset potential selling, which keeps the short‑term bullish setup alive.
Trading Recommendation:
Putting it all together, I’m leaning LONG on XPL for a short‑term trade this week. The reasoning is simple: price is holding above support while trader sentiment tilts slightly bullish. I’d look for entries around the current $0.81 area with upside targets at $0.83 and $0.86. Risk management matters here because confidence isn’t extremely high — a break below $0.79 would weaken the setup, and a deeper drop toward $0.76 would invalidate the bullish trade idea. For traders willing to accept moderate risk, this looks like a reasonable momentum play if buyers defend the current support zone.
Solitario Resources Corp.
No trades
No trades
In-depth trading ideas
XPL | 26' Q2 May | Day ChartXPL - Solitario Resources Corp
"is a mineral exploration company, which engages in the acquisition and exploration of precious metals and zinc-related exploration mineral properties. Its projects include Florida Canyon in Peru, Lik Zinc in Alaska, Cat Creek Critical Metals project, Bright Angel Copper Gold, and Golden Crest Gold Project"
MARKET-BEATING SCORE = 2/10
Solid EPS growth (17.39%) — in line with market leaders.
Declining revenue (-2.8%) is a headwind.
Decent gross margin (34%) — competitive business model.
BEAR CASE — −25%
Net losses burning cash — equity value erodes through any drawdown.
Revenue contraction leads EPS lower by 2–4 quarters
BULL CASE — +25%
EPS growth 17.39% — supports path to +25% rebalance target.
Positive FCF ($27.69M) — real cash generation. Best long-run predictor of value creation.
Strong liquidity — can weather demand slowdown without crisis.
-------------------------
Multiple Time-Frame Analysis; Color Code | Strength favors the higher timeframe.
Yearly timeframe = black
Monthly timeframe = pink
weekly = grey
daily = red
4hr = orange
1hr = yellow
15min = blue
5min = green if they are shown. (Level visibility on intervals is set to timeframe the level was found on and below to keep chart view organized.)
** Candle Science explained **
A Range = two or more consecutive color candles.
There are two types of ranges - accumulation and distribution.
DISTRIBUTION RANGES DEFINED: BackSide (BS) Candle - First distribution candle in a distribution range. Expectation = strong reaction to price. long wicks reaching to or away from level.
FrontSide (FS) Candle - Last distribution candle in a distribution range. Expectation = reversal, create a trend in the opposite direction. Distribution candles are used as support.
ACCUMULATION RANGES DEFINED:
Inverse BS (Inv.BS) - First Accumulation candle in an accumulation range. Expectation. = strong reaction to price. long wicks reaching to or away from level.
Inverse FS (Inv.FS) - Last accumulation candle in an accumulation range. Expectation = reversal, create a trend in the opposite direction. Accumulation candles are used as resistance.
Horizontal Ray tool on BS & FS levels are default support levels when dashed lines, tested when dotted lines and resistance when solid lines.
Horizontal Ray tool on Inverse BS & Inverse FS levels default as resistance and shown with a dashed line, tested when 1x dotted line, and support when solid line.
The inverse is true for the Inv. BS Inv. FS levels, they are resistance as dashed lines, tested as dotted and support as solid lines.
Solitario Zinc losing value. XPL We are not in the business of getting every prediction right, no one ever does and that is not the aim of the game. The Fibonacci targets are highlighted in purple with invalidation in red. Fibonacci goals, it is prudent to suggest, are nothing more than mere fractally evident and therefore statistically likely levels that the market will go to. Having said that, the market will always do what it wants and always has a mind of its own. Therefore, none of this is financial advice, so do your own research and rely only on your own analysis. Trading is a true one man sport. Good luck out there and stay safe
XPL - Bullish - ZINC PRICING HAS RISEN SINCE APRZinc metals company - Zinc pricing has risen since april. The chart is phenomenal, I strongly believe this will be moving very soon. purchase .045 sell between .55 and .65. Long term .90 to 1 dollar stock. Earnings release coming up will be positive. As long as the dollar doesnt continue to strengthen this stock make a leap this week.
Tiny Spike | Andrew AponasDisclaimer: thank you for taking your time to look at my idea please understand that I didn't publish it to influence your decision to invest your money and void myself of any responsibility towards your investments.
Note: I am simply trying to increase the coverage that the company may or may not have by publishing an optimistic guess I don't know anything about the company I am publishing the idea about, I haven't done any research on the company, I don't know what it's operations are, or if it's profitable.
Tip: Check WSJ.com or another professional service if your looking for something you can't find here.
Indicators bullish for Solitario ZincSolitario Zinc Corp. engages in mineral exploration. It focuses on the acquisition of precious and base metal properties with exploration potential, and the purchase of royalty interests. The company was founded on November 15, 1984 and is headquartered in Wheat Ridge, CO.