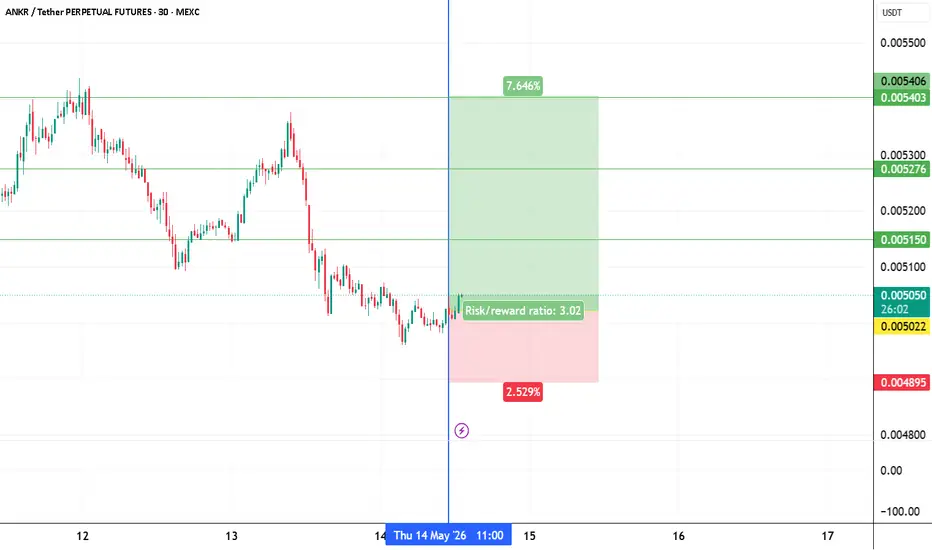
ANKR at macro floor: base recovery toward $0.0043The Macro Picture 🗺️
ANKR unwound a long downtrend from the $0.0056 highs into the $0.003239 macro floor and has flattened into a base just above it. RSI is curling back up toward 50 as the selling exhausts — the tape is starting to turn rather than break lower.
The Setup ⚙️
The Accumulation Zone 🟢
$0.003239–0.003581 is where the selling has dried up. The macro floor has held, and this is the demand shelf a recovery would build from.
The Decision Point 🔴
$0.005589 (Local High) is the far structural gate. Before it, the $0.004339 measured-move target is the first objective — reclaiming it proves buyers are stepping back in.
The Roadmap 🛣️
Hold the $0.003239 floor → recover toward $0.004339 → then work higher. Invalidation is a clean daily close below $0.003239 — that voids the accumulation thesis.
This is a textbook DCA Accumulation Zone setup: scale in across the $0.003239–0.003581 band and let the base do the work.
More setups in profile.
#ANKR #Ankr #crypto #trading #TA #3Commas #DCA
In-depth trading ideas
ANKRusdt Relief Rally Before the Next BreakdownANKR remains trapped in a strong long-term downtrend, with every major recovery being met by aggressive selling pressure. The current structure suggests a short-term bounce from demand, but the broader outlook remains bearish. A relief rally into the highlighted supply zone could provide the final rejection needed to complete the next leg lower toward the projected target around 0.00157 USDT. Until price can break and sustain above key supply levels, the trend continues to favor sellers and lower prices.
ankrusdt longInstructions:
Entry point: yellow
Stop loss: red
Take profit: green
👉Leverage x 5-10-20 for crypto
👉Leverage x 20-50-100 for commodities, stocks, indices, and forex
👉Margin 1-5% max.
Always practice risk and money management.
Invest a maximum of 5% on any trade or across all your trades.
Invest only what you can afford to lose, as no one is in control of the market.
👉Our analyses are primarily based on:
breakouts: two trend lines (ascending and descending) and a line indicating a horizontal breakout.
chart patterns: shoulders and head, triangle parttern, elliott impulse, etc etc.
We don't always have the time to track them at all times or to represent them visibly, given the numerous signals, the number of channels to manage, and especially because of the often rapid pace of market movements.
indicators: We associate at least two indicators with this technique.
👉Depending on the circumstances, we use specific indicators, often setting 3 or more take profit levels.
👉Indeed, there are good days in trading and also bad days. No one can promise to win every trade, and like all traders worldwide, we also experience stop-loss orders. However, we win more than we lose and remain positive.
👉You can close the position before or after the take profit orders indicated by the green lines if you are personally satisfied; the same applies to stop loss orders.
👉We must stay positive, clear-headed, and humble.
we cannot provide all instructions or all trades here on this channel.
Good luck to us all, and may God guide us. Amen.
ankrusdt longInstructions:
Entry point: yellow
Stop loss: red
Take profit: green
👉Leverage x 5-10-20 for crypto
👉Leverage x 20-50-100 for commodities, stocks, indices, and forex
👉Margin 1-5% max.
Always practice risk and money management.
Invest a maximum of 5% on any trade or across all your trades.
Invest only what you can afford to lose, as no one is in control of the market.
👉Our analyses are primarily based on:
breakouts: two trend lines (ascending and descending) and a line indicating a horizontal breakout.
chart patterns: shoulders and head, triangle parttern, elliott impulse, etc etc.
We don't always have the time to track them at all times or to represent them visibly, given the numerous signals, the number of channels to manage, and especially because of the often rapid pace of market movements.
indicators: We associate at least two indicators with this technique.
👉Depending on the circumstances, we use specific indicators, often setting 3 or more take profit levels.
👉Indeed, there are good days in trading and also bad days. No one can promise to win every trade, and like all traders worldwide, we also experience stop-loss orders. However, we win more than we lose and remain positive.
👉You can close the position before or after the take profit orders indicated by the green lines if you are personally satisfied; the same applies to stop loss orders.
👉We must stay positive, clear-headed, and humble.
we cannot provide all instructions or all trades here on this channel.
Good luck to us all, and may God guide us. Amen.
ANKRUSDT Forming Falling WedgeANKRUSDT is forming a clear falling wedge pattern, a classic bullish wave signal that often indicates an upcoming breakout. The price has been consolidating within a narrowing range, suggesting that selling pressure is weakening while buyers are beginning to regain control. With consistent volume confirming accumulation at lower levels, the setup hints at a potential bullish breakout soon. The projected move could lead to an impressive gain of around 40% to 50% once the price breaks above the wedge resistance.
This falling wedge pattern is typically seen at the end of downtrends or corrective phases, and it represents a potential shift in market sentiment from bearish to bullish. Traders closely watching ANKRUSDT are noting the strengthening momentum as it nears a breakout zone. The good trading volume adds confidence to this pattern, showing that market participants are positioning early in anticipation of a reversal.
Investors’ growing interest in ANKRUSDT reflects rising confidence in the project’s long-term fundamentals and current technical strength. If the breakout confirms with sustained volume, this could mark the start of a fresh bullish leg. Traders might find this a valuable setup for medium-term gains, especially as the wedge pattern completes and buying momentum accelerates.
✅ Show your support by hitting the like button and
✅ Leaving a comment below! (What is your opinion about this coin?)
Your feedback and engagement keep me inspired to share more insightful market analysis with you!
ANKRUSDT Massive Reversal Setup Loading ANKR is finalizing a WXY corrective structure, completing near a strong accumulation zone (0.00474-0.00675). A breakout from this wedge could trigger a major bullish cycle with targets around $0.21291 with a potential 3,400% rally from current levels.
Price remains valid for this setup as long as it stays above 0.00474USDT. Any close below invalidates the bullish outlook.
Smart money is likely accumulating here the next impulse may surprise the market.
What’s your take on ANKR’s structure?
Like, Comment and Share.
Short Rekt and Extreme Bull Squeeze Erupts on Full Send VolumeAnkr is delivering a high-conviction breakout signal on Binance. Spot at 0.00601 with futures at 0.00593 — a -1.31% backwardation with Z-score at -5σ Bull, meaning funding is paying longs at 1439% APY annualized. That is an extreme statistical outlier on the funding side, mathematically penalizing every short position held overnight while rewarding spot holders. S/F Vol at 1.89B spot versus 17.18B futures and S/F S at 11.34M versus 103.23M — Spot:Fut reads Full Send, not Ghost Market. The ratio is elevated but within legitimate breakout-move territory, spot is participating meaningfully alongside futures.
Signal count is 54 green to 5 red out of 112 — 85.5% green dominance. Extreme BULL at 70.99% edge at 5.89x. C>T 13:1 confirms near-total trend-price alignment. EMA stack 8:1, Candle 14:0 complete sweep with zero bearish candle signal across all timeframes, Engulf 6:0. Ichi TK 10:3 carries mild resistance overhead. SS/DD 2:8 — the structural backdrop is heavily bearish from prior trend, meaning this bull push is a genuine reversal attempt against established structure, which amplifies the significance of the signal stack. Spread at 71% Extreme confirms wide impulsive bodies. Squeeze FIRED with Bull↑ momentum and BW 38.37% Expanding — the breakout is actively in progress.
Spot Z 2.73 V.High, Fut Z 3.82 Extreme, F+S Z 3.73 Extreme. Combined volume at extreme statistical levels across both markets simultaneously. SpotZ 1:5 reads 2.73 vs -0.34 with 3.07 Accel ▼▼ — the acceleration arrows are pointing down, signaling the volume spike intensity is beginning to ease even as absolute levels remain extreme. This is the primary timing warning in an otherwise clean bull panel. S.Mom 584.5% Exp↑ Normal confirms spot momentum is running hard with no market quality distortion. Bull:Bear Z 3.91 vs -0.48 Bull Dom — buyer volume dominance is statistically extreme.
Leverage at 8.98x Elevated, Percentile at 52.1% Mid. Not at dangerous manipulation ceiling — AT Max was 17.09x at 1249 bars ago, current is roughly half that historical peak. Price at 16% Floor with Hi/Lo at 0.01609 vs 0.00409 — ANKR is trading in the deep bottom range of its history, near the DEMAND zone on chart with SUPPLY visible overhead as the next major resistance. MeanZ at -0.55σ Norm confirms price is below its statistical mean, providing mathematical tailwind for mean reversion. StdDev at 0.226% Volat confirms volatility is expanding to match the move.
SHORT REKT liquidation signal is active — this is the primary catalyst confirmation. Short positions are being forcibly closed, providing forced buying pressure that extends the move mechanically. OBV Z -1.89 Strong↑ with Normal divergence — despite the negative absolute value, the directional read is upward and the divergence is clean. Combined with SHORT REKT active and Bull:Bear Z at extreme bull dominance, the liquidation cascade is feeding directly into OBV accumulation. No whale signal detected, suggesting the move is broad-based rather than single-actor driven. Sqz Div Normal, Mkt Normal — no quality distortions in the signal.
The honest read: ANKRUSDT is producing the confluence that matters — fired squeeze, SHORT REKT active, -5σ backwardation paying longs, Extreme volume Z across both markets, and 14:0 candle sweep. The structural SS/DD 2:8 bearish backdrop actually strengthens the signal: bulls are forcing a reversal against established structure with statistical volume support. The sole caution is Accel ▼▼ on the volume Z short-term — the fuel is burning, not refilling. Clarity at 53% means this is not a crowded trade yet. Entry on any retrace toward the DEMAND zone is the higher-probability play versus chasing the 5.1x bounce already in progress. First target is the SUPPLY zone overhead. Stop below the DEMAND zone low.
Is That Crypto Pump Real? Data Says No. Here's Why.
Stop Losing Money to Fake Volume. Find Real Moves Now.
Trade the REAL Crypto Volume. Stop Getting Faked Out.
ANKR/USDT ,1W ( Ready for 140 % Move ) ANKR is moving inside the Triangle pattern and when it comes to support and breaks a pattern then it is very much possible to give very good move.
and at the same time Bitcoin dominance is decreasing and altcoins dominance is started increasing , so look on all the altcoins.
and follow proper risk management , it has very good chances to move UP side but first we have to protect the down side , where risk management comes into game .
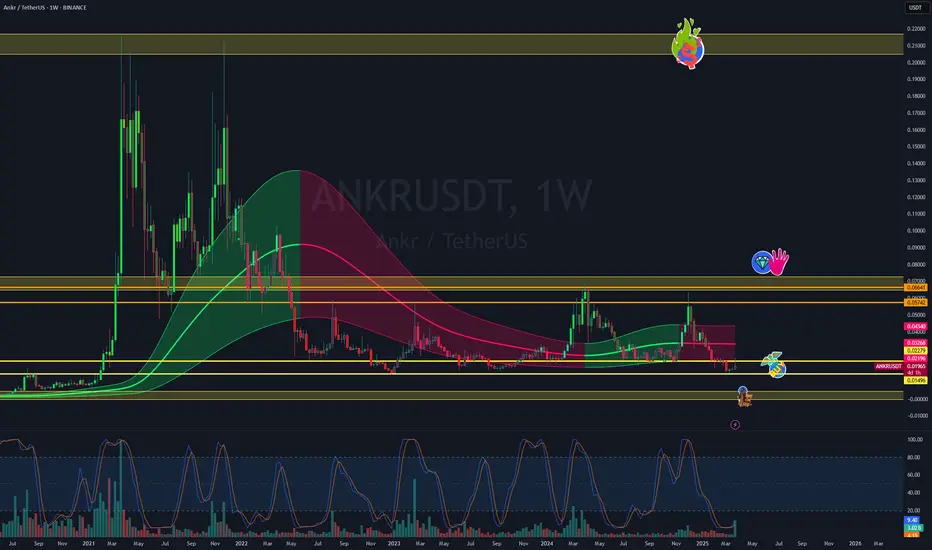
ANKR/USDT – Weekly Macro Reversal from Historical Demand Zone!🧠 Analysis Overview:
ANKR is showing strong signs of a potential macro reversal after bouncing off its historical demand zone around 0.017–0.019 USDT. This zone has proven to be a significant accumulation area in past cycles — fueling major rallies in both 2021 and 2023. The recent reaction at this level could mark the beginning of a substantial bullish leg in the mid-to-long term.
🔍 Pattern & Structure Breakdown:
✅ Demand Zone Re-Tested:
This zone has been tested multiple times over the years and continues to attract buying interest, signaling institutional accumulation.
✅ Potential Weekly Double Bottom:
Price has formed a clear double bottom with a strong bullish rejection candle, indicating buyers are stepping back in.
✅ Macro Accumulation Range:
For nearly two years, ANKR has been ranging between 0.018 – 0.21 USDT. It’s currently at the bottom of that range, providing a high risk-reward opportunity.
✅ Fibonacci Extension Targets:
Well-defined horizontal resistances (in yellow) suggest clear roadmap targets for bullish continuation — ranging from 0.024 to 0.216.
🚀 Bullish Scenario (HIGH PROBABILITY SETUP):
Ideal Entry Zone: 0.018–0.020 USDT
Initial Breakout Confirmation: Above 0.02437
Progressive Targets:
0.03067 – minor resistance
0.04253 – previous swing high
0.06191 – historical supply
0.09808 – 0.12196 – prior distribution zone
0.16708 – 0.21662 – cycle top targets
🎯 Potential Upside: 200% – 1000%+
📈 Trend Reversal Confirmed: Once weekly higher-highs are established
⚠️ Bearish Scenario (RISK MANAGEMENT):
Breakdown below 0.01800 could trigger:
0.01200 (intermediate support)
0.00700 – 0.00446 (macro-level supports)
❗️Bearish Bias Valid: On weekly close below 0.01700 with strong selling volume
🧭 Conclusion:
> ANKR is currently at a critical macro support zone with a technically sound reversal setup.
For swing traders and mid-term investors, this is a strategic area to monitor for potential trend shift.
Tight risk, massive reward.
📌 Strategy Recommendation:
Use DCA (dollar-cost averaging) in the demand zone
Place conservative stop-loss below 0.01700
Watch for breakout with volume above 0.02437 to confirm bullish reversal
#ANKR #ANKRUSDT #CryptoReversal #AltcoinSetup #WeeklyChart #SwingTrade #AccumulationZone #TechnicalAnalysis #LowCapAltcoin #FibonacciTargets
ANKR/USDTKey Level Zone: 0.01655 - 0.01665
HMT v8 detected. The setup looks promising, supported by a previous upward/downward trend with increasing volume and momentum, presenting an excellent reward-to-risk opportunity.
HMT (High Momentum Trending):
HMT is based on trend, momentum, volume, and market structure across multiple timeframes. It highlights setups with strong potential for upward movement and higher rewards.
Whenever I spot a signal for my own trading, I’ll share it. Please note that conducting a comprehensive analysis on a single timeframe chart can be quite challenging and sometimes confusing. I appreciate your understanding of the effort involved.
Important Note :
Role of Key Levels:
- These zones are critical for analyzing price trends. If the key level zone holds, the price may continue trending in the expected direction. However, momentum may increase or decrease based on subsequent patterns.
- Breakouts: If the key level zone breaks, it signals a stop-out. For reversal traders, this presents an opportunity to consider switching direction, as the price often retests these zones, which may act as strong support-turned-resistance (or vice versa).
My Trading Rules
Risk Management
- Maximum risk per trade: 2.5%.
- Leverage: 5x.
Exit Strategy
Profit-Taking:
- Sell at least 70% on the 3rd wave up (LTF Wave 5).
- Typically, sell 50% during a high-volume spike.
- Adjust stop-loss to breakeven once the trade achieves a 1.5:1 reward-to-risk ratio.
- If the market shows signs of losing momentum or divergence, ill will exit at breakeven.
The market is highly dynamic and constantly changing. HMT signals and target profit (TP) levels are based on the current price and movement, but market conditions can shift instantly, so it is crucial to remain adaptable and follow the market's movement.
If you find this signal/analysis meaningful, kindly like and share it.
Thank you for your support~
Sharing this with love!
HMT v2.0:
- Major update to the Momentum indicator
- Reduced false signals from inaccurate momentum detection
- New screener with improved accuracy and fewer signals
HMT v3.0:
- Added liquidity factor to enhance trend continuation
- Improved potential for momentum-based plays
- Increased winning probability by reducing entries during peaks
HMT v3.1:
- Enhanced entry confirmation for improved reward-to-risk ratios
HMT v4.0:
- Incorporated buying and selling pressure in lower timeframes to enhance the probability of trending moves while optimizing entry timing and scaling
HMT v4.1:
- Enhanced take-profit (TP) target by incorporating market structure analysis
HMT v5 :
Date: 23/01/2025
- Refined wave analysis for trending conditions
- Incorporated lower timeframe (LTF) momentum to strengthen trend reliability
- Re-aligned and re-balanced entry conditions for improved accuracy
HMT v6 :
Date : 15/02/2025
- Integrated strong accumulation activity into in-depth wave analysis
HMT v7 :
Date : 20/03/2025
- Refined wave analysis along with accumulation and market sentiment
HMT v8 :
Date : 16/04/2025
- Fully restructured strategy logic
Wyckoff Accumulation In Phase D of the Wyckoff Accumulation pattern, the key sign is strong price rallies aiming for the top of the channel.
To confirm that we’ve entered this phase, we need two main things:
1. A monthly close above the last resistance (now support)
2. Low volume during pullbacks — this shows that sellers are weak
If the price breaks below the last swing low, the bullish outlook is no longer valid.
But if it closes back inside the accumulation range, the pattern is confirmed, and that’s usually a signal to enter right away.
We need to be patient — this is the stage where profits come, but only if you let the move play out.
ANKRUSDT: A Strong Demand Zone or Breakdown Risk?ANKRUSDT is currently sitting at a crucial demand zone, a level that has historically triggered massive price movements. This same area in February 2021 acted as a springboard for huge gains, leading to a double top formation at $0.21 before experiencing a major downtrend. Since August 2022, the price has been stuck in a sideways range, with no clear breakout in sight—until now.
Why This Demand Zone is Key
The weekly support level within the range has proven to be resilient, holding strong since 2021. Additionally, the Stochastic RSI is in oversold territory, signaling a potential loss of selling pressure. This setup suggests that buyers might step in soon, making this zone a prime accumulation area for long-term holders.
Best Buy Zone:
🔹 $0.015 - $0.022 → A historically strong support level, ideal for long-term positions.
Potential Targets:
📌 Short-Term Target: $0.057 - $0.066 (Top of the current range)
📌 Mid-Term Target: $0.097 (Potential supply zone)
📌 Long-Term Target: $0.21 (Previous all-time high)
Bearish Scenario: What If Support Breaks?
While the demand zone is strong, there's always a chance of a breakdown. If price fails to hold support, the next major demand zone lies at $0.008—a crucial level for long-term investors to watch.
Final Thoughts
✅ The setup is strong, with price at weekly support and indicators signaling a potential reversal.
⚠️ But always have a plan—if the demand zone breaks, be ready for lower levels.
💡 Risk management is key—stick to your strategy, and trade with confidence!
What’s your take on ANKR? Are you bullish or waiting for more confirmation? Let’s discuss in the comments! 🚀
Keep it shiny~!
KinaStar
ANKRUSDTANKR/USDT 1D Chart Overview
The ANKR/USDT pair on a 1-day timeframe displays a descending trendline extending from its peak in December 2024. The current price stands at 0.020429, reflecting a 1.69% increase. With Bollinger Bands and buy/sell signals in play, the chart suggests a possible short-term bounce near critical support levels. Check the chart for more insights!
ANKRUSDT – Watching Key Support Zones!I’ve marked the blue boxes as potential strong support levels—this is where smart money might step in! But remember, just because a level looks good doesn’t mean we blindly buy.
📊 How I’m Trading This:
✅ Step 1: Watch for CDV confirmation—is volume supporting the move?
✅ Step 2: Look for LTF market structure shifts—is price breaking upwards on lower time frames?
✅ Step 3: If support holds + volume confirms = I take the trade. No confirmation? I wait.
💡 Patience Pays:
The market doesn’t care about emotions. Most traders jump in too early and get stopped out. I let the market show its hand first. That’s why I catch moves before they happen.
🔥 Final Thought:
If price suddenly breaks below without support forming, I will not insist on a long. But if we get a strong reaction + a retest? Then it’s game time.
📈 Follow for precision trades—because guessing is for amateurs. 🔥
A tiny part of my runners:
🎯 ZENUSDT.P: Patience & Profitability | %230 Reaction from the Sniper Entry
🐶 DOGEUSDT.P: Next Move
🎨 RENDERUSDT.P: Opportunity of the Month
💎 ETHUSDT.P: Where to Retrace
🟢 BNBUSDT.P: Potential Surge
📊 BTC Dominance: Reaction Zone
🌊 WAVESUSDT.P: Demand Zone Potential
🟣 UNIUSDT.P: Long-Term Trade
🔵 XRPUSDT.P: Entry Zones
🔗 LINKUSDT.P: Follow The River
📈 BTCUSDT.P: Two Key Demand Zones
🟩 POLUSDT: Bullish Momentum
🌟 PENDLEUSDT.P: Where Opportunity Meets Precision
🔥 BTCUSDT.P: Liquidation of Highly Leveraged Longs
🌊 SOLUSDT.P: SOL's Dip - Your Opportunity
🐸 1000PEPEUSDT.P: Prime Bounce Zone Unlocked
🚀 ETHUSDT.P: Set to Explode - Don't Miss This Game Changer
🤖 IQUSDT: Smart Plan
⚡️ PONDUSDT: A Trade Not Taken Is Better Than a Losing One
💼 STMXUSDT: 2 Buying Areas
🐢 TURBOUSDT: Buy Zones and Buyer Presence
🌍 ICPUSDT.P: Massive Upside Potential | Check the Trade Update For Seeing Results
🟠 IDEXUSDT: Spot Buy Area | %26 Profit if You Trade with MSB
📌 USUALUSDT: Buyers Are Active + %70 Profit in Total
🌟 FORTHUSDT: Sniper Entry +%26 Reaction
🐳 QKCUSDT: Sniper Entry +%57 Reaction
📊 BTC.D: Retest of Key Area Highly Likely
📊 XNOUSDT %80 Reaction with a Simple Blue Box!
ANKR/USDT Will Bulls Take Control or Are We Heading Lower?
Yello Paradisers! Are we about to see #ANKRUSDT break out, or is another rejection incoming? Let’s break it down this is a crucial moment in the market, and you don’t want to miss it.
💎Right now, the 4-hour chart shows SEED_DONKEYDAN_MARKET_CAP:ANKR sitting above the EMA 50, signaling a short-term bullish push. But don’t get too excited just yet—price is still below the EMA 200, which keeps the overall market bias neutral to bearish. For the bulls to take over, a clean breakout above the EMA 200 resistance is needed. If ANKR fails here, we could see another test of the supply zone between 0.02019 - 0.02271, followed by a potential pullback toward the 0.01504 support level.
💎Now, zooming out to the 1-day chart, the picture gets even more interesting. The price is still trading below both the EMA 50 and EMA 200, confirming that the bigger trend remains bearish. What does this mean? Any bullish moves on the 4-hour chart could just be temporary retracements within a larger downtrend. With this structure, selling pressure is still dominant, and unless we see a major reversal, further downside remains on the table.
💎So, what’s the key takeaway? Short-term bullish opportunities exist, but they’re facing strong resistance from the EMA 200 and supply zone. Meanwhile, the longer-term trend remains bearish, meaning any failure to break higher could increase the risk of a deeper drop possibly toward the 0.01294 support area.
Patience and precision are key in these conditions wait for strong confirmation before making your moves.
MyCryptoParadise
iFeel the success🌴