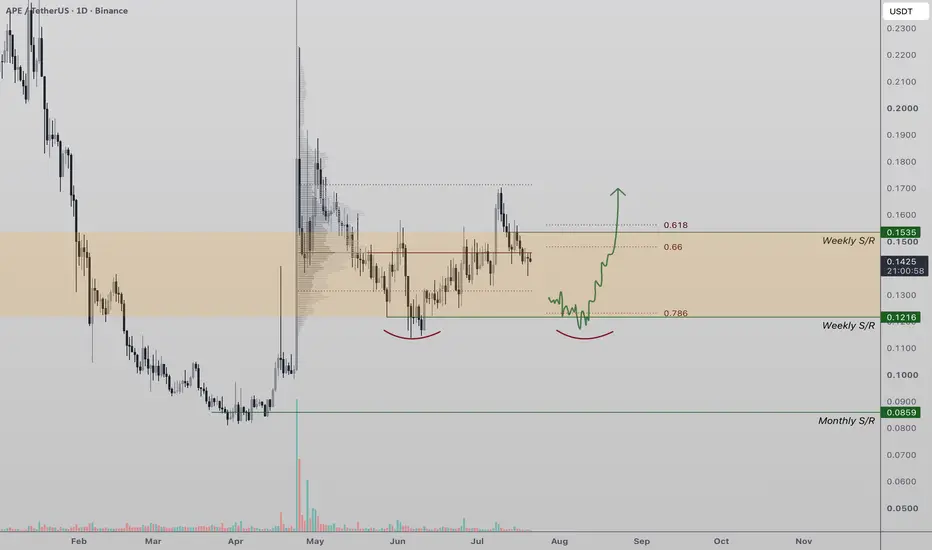
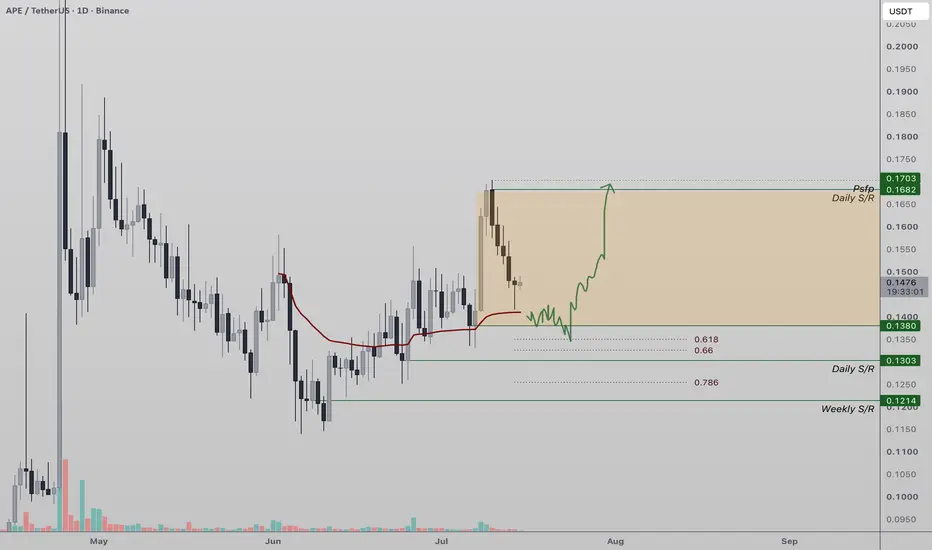
APE Double Bottom Formation ? APE is trading back into a key high-timeframe support zone where weekly support converges with the 0.786 Fibonacci retracement, creating a strong area of technical confluence. This region is likely to attract buying interest and could serve as the foundation for a meaningful trend reversal if buyers
APE USDT LONG SIGNAL#110 APE/USDT – Trade Setup (LONG)
📈 Position Type: LONG
🕒 Timeframe: 1H
📊 Market: Futures
💰 Entry Zone:
0.1450
0.1390
🛑 Stop-Loss:
0.1360
🎯 Take-Profit Targets:
• TP1: 0.15
• TP2: 0.1559
• TP3: 0.1618
• TP4: 0.1672
⚙️ Leverage:
5 *3
▫️ After TP1, move SL to Entry + 0.2%.
▪️ Exit P
#APEUSDT chart (1-hour timeframe)#APE
The price is moving within a descending channel on the 1-hour timeframe and has reached the lower boundary. It is now poised for a bounce and is expected to retest this boundary.
The Relative Strength Index (RSI) indicates a downward trend, which is likely to continue given the overbought con
APE: local squeeze with $0.19 destinationThe Macro Picture 🗺️
After the April spike to $0.2777 unwound, APE settled into a defined range and carved out a higher low at $0.1134 in June. Price has recovered to $0.1484 and is now coiling just beneath the $0.1579 decision line — energy compressing ahead of the next move.
The Setup ⚙️
The Ra
#APEUSDT chart (1-hour timeframe)#APE
The price is moving within a descending channel on the 1-hour timeframe and has reached the lower boundary. It is now poised for a bounce and is expected to retest this boundary.
The Relative Strength Index (RSI) indicates a downward trend, which is likely to continue given the overbought con
APE Approaches High-Timeframe SupportAPE has rejected from a key high-timeframe resistance, prompting a corrective move toward an important area of support. The recent rejection suggests buyers were unable to sustain momentum at higher prices, shifting the market into a healthy pullback rather than an immediate continuation of the uptr
APE: Accumulation Pattern BreakoutAPE: Accumulation Pattern Breakout – Setting Up an Optimal Long Position with Outstanding RR Ratio
APE has just flashed a highly potent trend shift signal, marking the official return of buyers taking control of the market. Following a tight consolidation phase, APE's technical chart executed a co
APE Testing Point of ControlAPE is currently trading near its Point of Control (POC), a key high-volume resistance level that is likely to determine the next short-term move. Price has rallied into this region, but unless buyers can reclaim the POC, the probability increases for a corrective rotation toward lower support.
The
See all ideas
Summarizing what the indicators are suggesting.
Oscillators
Neutral
SellBuy
Strong sellStrong buy
Strong sellSellNeutralBuyStrong buy
Oscillators
Neutral
SellBuy
Strong sellStrong buy
Strong sellSellNeutralBuyStrong buy
Summary
Neutral
SellBuy
Strong sellStrong buy
Strong sellSellNeutralBuyStrong buy
Summary
Neutral
SellBuy
Strong sellStrong buy
Strong sellSellNeutralBuyStrong buy
Summary
Neutral
SellBuy
Strong sellStrong buy
Strong sellSellNeutralBuyStrong buy
Moving Averages
Neutral
SellBuy
Strong sellStrong buy
Strong sellSellNeutralBuyStrong buy
Moving Averages
Neutral
SellBuy
Strong sellStrong buy
Strong sellSellNeutralBuyStrong buy
Displays a symbol's price movements over previous years to identify recurring trends.