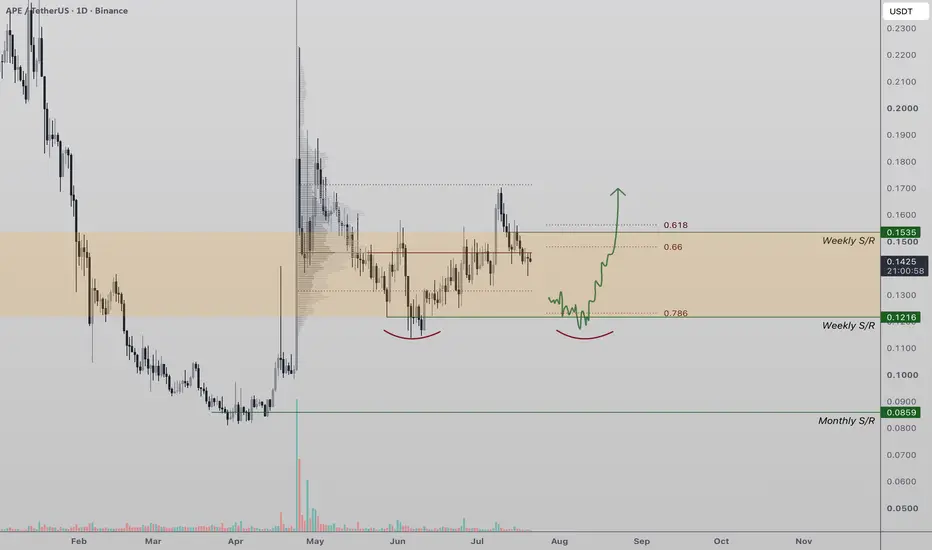
APE Double Bottom Formation ? APE is trading back into a key high-timeframe support zone where weekly support converges with the 0.786 Fibonacci retracement, creating a strong area of technical confluence. This region is likely to attract buying interest and could serve as the foundation for a meaningful trend reversal if buyers defend it successfully.
A hold above this support would also establish a potential double bottom formation, one of the more reliable bullish reversal patterns in technical analysis. However, the pattern is only confirmed if price rallies from this level and breaks above the neckline resistance. Until then, traders should view the setup as a developing opportunity rather than a confirmed reversal.
Volume will play a crucial role in determining whether this bounce has enough strength to continue. A sharp increase in buying volume would indicate renewed market participation and improve the probability of a sustained move higher. Without strong volume, any initial rebound could simply be a temporary relief rally before sellers regain control.
As long as APE remains above this key support zone, the bullish case stays intact. Confirmation through higher lows, increasing volume and a break above resistance would strengthen the outlook and open the door for a larger recovery toward the previous swing highs. Until then, patience and confirmation remain key.
In-depth trading ideas
APE USDT LONG SIGNAL#110 APE/USDT – Trade Setup (LONG)
📈 Position Type: LONG
🕒 Timeframe: 1H
📊 Market: Futures
💰 Entry Zone:
0.1450
0.1390
🛑 Stop-Loss:
0.1360
🎯 Take-Profit Targets:
• TP1: 0.15
• TP2: 0.1559
• TP3: 0.1618
• TP4: 0.1672
⚙️ Leverage:
5 *3
▫️ After TP1, move SL to Entry + 0.2%.
▪️ Exit Plan:
• 40% at TP1
• 20% at TP2
• 20% at TP3
20% at. TP4
📌 Risk Management:
Risk only 1–2% of your capital per trade.
⚠️ Always check and confirm the setup on your chart before entering the trade.
#APEUSDT chart (1-hour timeframe)#APE
The price is moving within a descending channel on the 1-hour timeframe and has reached the lower boundary. It is now poised for a bounce and is expected to retest this boundary.
The Relative Strength Index (RSI) indicates a downward trend, which is likely to continue given the overbought conditions.
There is a key support zone in green at 0.1356, and the price has bounced off this zone several times, making it a strong support level.
The price is trending towards the 100-period moving average, which we are approaching. This trend supports an upward move.
Entry Price: 0.1455
Target 1: 0.1477
Target 2: 0.1505
Target 3: 0.1542
Stop Loss: At the resistance zone in green
Remember this simple rule: Money management.
Any questions? Please leave a comment.
Thank you.
APE: local squeeze with $0.19 destinationThe Macro Picture 🗺️
After the April spike to $0.2777 unwound, APE settled into a defined range and carved out a higher low at $0.1134 in June. Price has recovered to $0.1484 and is now coiling just beneath the $0.1579 decision line — energy compressing ahead of the next move.
The Setup ⚙️
The Range Floor 🟢
$0.1134 (Local Low) is the demand base. Buyers stepped in there in June and the recovery since has held above it. That's the floor this setup pivots on.
The Decision Point 🔴
$0.1579 (Local High) is the gate. A daily close above it flips the local structure bullish and clears the path to the $0.1901 measured-move target.
The Roadmap 🛣️
Hold equilibrium at $0.1484 → break $0.1579 → run toward $0.1901. Invalidation is a clean daily close below $0.1134 — that breaks the higher-low structure.
This is a GRID Range Play: a defined $0.1134–0.1579 band to rotate, buying the lower half and scaling out into the breakout.
More setups in profile.
#APE #ApeCoin #crypto #trading #TA #3Commas #GRID
#APEUSDT chart (1-hour timeframe)#APE
The price is moving within a descending channel on the 1-hour timeframe and has reached the lower boundary. It is now poised for a bounce and is expected to retest this boundary.
The Relative Strength Index (RSI) indicates a downward trend, which is likely to continue given the overbought conditions.
There is a key support zone in green at 0.1350, and the price has bounced off this zone several times, making it a strong support level.
The price is trending towards the 100-period moving average, which we are approaching. This trend supports an upward move.
Entry Price: 0.1430
Target 1: 0.1468
Target 2: 0.1505
Target 3: 0.1552
Stop Loss: At the resistance zone in green
Remember this simple rule: Money Management.
Any questions? Please leave a comment.
Thank you.
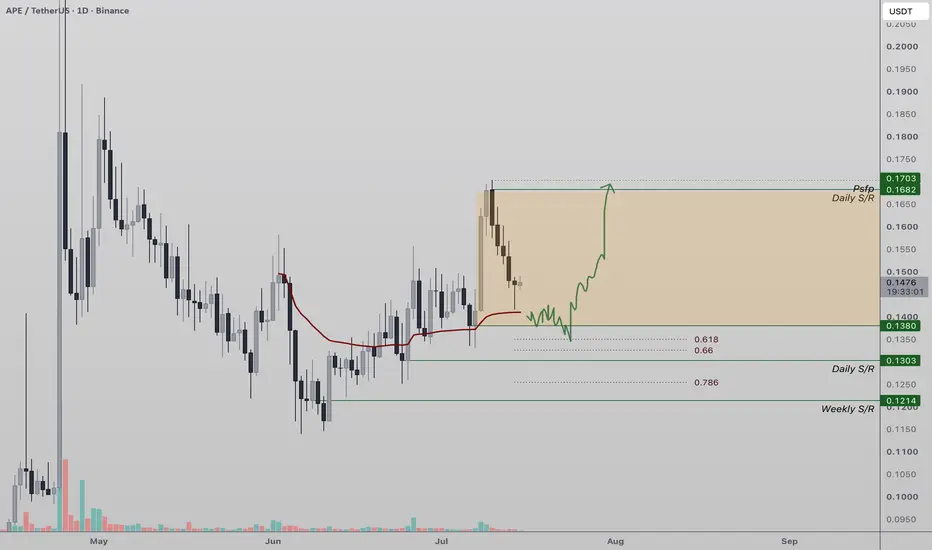
APE Approaches High-Timeframe SupportAPE has rejected from a key high-timeframe resistance, prompting a corrective move toward an important area of support. The recent rejection suggests buyers were unable to sustain momentum at higher prices, shifting the market into a healthy pullback rather than an immediate continuation of the uptrend.
The focus now turns to the high-timeframe support, which is in strong technical confluence with the 0.618 Fibonacci retracement. This combination creates a high-probability demand zone where buyers are expected to defend the current market structure. Confluence between Fibonacci support and higher-timeframe levels often produces significant market reactions, making this one of the most important areas on the chart.
As long as APE continues to hold above this support region, the broader technical outlook remains constructive. A bullish reaction from this zone would establish a higher low and increase the probability of a rotational move back toward the recent highs. Such a move would suggest that the current decline is simply a corrective retracement within a larger bullish trend.
However, failure to hold the 0.618 Fibonacci and high-timeframe support would weaken the current structure and increase the likelihood of a deeper correction.
For now, APE is approaching a decisive technical region. The reaction around the 0.618 Fibonacci and high-timeframe support will likely determine whether buyers can regain control and drive the next bullish expansion.
APE: Accumulation Pattern BreakoutAPE: Accumulation Pattern Breakout – Setting Up an Optimal Long Position with Outstanding RR Ratio
APE has just flashed a highly potent trend shift signal, marking the official return of buyers taking control of the market. Following a tight consolidation phase, APE's technical chart executed a convincing breakout above the upper resistance boundary of the ascending triangle. This price action was confirmed by a decisive candle close, establishing a solid short-term bullish structure.
Based on the visual data from chart , this upward impulse becomes even more reliable as the price has crossed and sits fully above the MA100 trend moving average line. Breaking above this key technical barrier indicates that buying demand is surging, ending the previous stagnant phase. This represents a classic buy (Long) setup with a high probability of success now that the primary direction is clearly defined.
The biggest advantage of this trade setup is that it offers an incredibly ideal risk-to-reward (RR) ratio. Since the breakout point lies right next to the newly formed support area, we can position a very tight stop-loss just underneath the recently breached upper line of the triangle to safeguard capital. With the potential profit target looking toward the next major resistance cluster around the $0.27 mark, this is an optimized opportunity worth considering.
Disclaimer: This is not financial advice, DYOR.
APE USDT SHORT SIGNAL#..APE
APE/USDT – Trade Setup (SHORT)
📈 Position Type: SHORT
🕒 Timeframe: 1 H
📊 Market: Futures
💰 Entry Zone:
0.1612
🛑 Stop-Loss:
0.1689
🎯 Take-Profit Targets:
• TP1: 0.1590
• TP2: 0.1560
• TP3: 0 .1528
• TP4: 0.1492
TP5: 0.1448
TP6: 0.14
⚙️ Leverage:
5- 10
⚠️ After reaching TP1, move Stop-Loss to Entry Price.
📌 Risk Management:
Risk only 1–2% of your capital per trade.
Always confirm the setup on your chart before entry
APE Testing Point of ControlAPE is currently trading near its Point of Control (POC), a key high-volume resistance level that is likely to determine the next short-term move. Price has rallied into this region, but unless buyers can reclaim the POC, the probability increases for a corrective rotation toward lower support.
The key area to monitor on any pullback is the daily support, which aligns with the 0.618 Fibonacci retracement and the Value Area Low (VAL). This creates a strong zone of technical confluence where buyers are expected to step back into the market. Such a pullback would be considered a healthy correction rather than a bearish breakdown, provided the support holds.
From a technical perspective, this support region represents an important accumulation zone. If price reacts positively and establishes a higher low, it would reinforce the current market structure and increase the probability of a rally toward the $16 resistance and potentially higher levels. Holding above this confluence would signal continued strength and confirm that buyers remain in control of the broader trend.
However, failure to defend this support would weaken the bullish outlook and increase the risk of a deeper corrective move. For now, the focus remains on how price reacts between the Point of Control resistance and the major support confluence below, as this will likely determine APE's next directional move.
#APEUSDT#APE
The price is moving within a descending channel on the 1-hour timeframe and has reached the lower boundary. It is now poised for a bounce and is expected to retest this boundary.
The Relative Strength Index (RSI) indicates a downward trend, which is likely to continue given the overbought conditions.
There is a key support zone in green at 0.1323, and the price has bounced off this zone several times, making it a strong support level.
The price is trending towards the 100-period moving average, which we are approaching. This trend supports an upward move.
Entry Price: 0.1383
Target 1: 0.1400
Target 2: 0.1423
Target 3: 0.1448
Stop Loss: At the resistance zone in green
Remember this simple rule: Money management.
Any questions? Please leave a comment.
Thank you.
apeusdt long Roddy01-SIGNALSPROVIDERInstructions:
Entry point: yellow
Stop loss: red
Take profit: green
👉Leverage x 5-10-20 for crypto
👉Leverage x 20-50-100 for commodities, stocks, indices, and forex
👉Margin 1-5% max.
Always practice risk and money management.
Invest a maximum of 5% on any trade or across all your trades.
Invest only what you can afford to lose, as no one is in control of the market.
👉Our analyses are primarily based on:
breakouts: two trend lines (ascending and descending) and a line indicating a horizontal breakout.
chart patterns: shoulders and head, triangle parttern, elliott impulse, etc etc.
We don't always have the time to track them at all times or to represent them visibly, given the numerous signals, the number of channels to manage, and especially because of the often rapid pace of market movements.
indicators: We associate at least two indicators with this technique.
👉Depending on the circumstances, we use specific indicators, often setting 3 or more take profit levels.
👉Indeed, there are good days in trading and also bad days. No one can promise to win every trade, and like all traders worldwide, we also experience stop-loss orders. However, we win more than we lose and remain positive.
👉You can close the position before or after the take profit orders indicated by the green lines if you are personally satisfied; the same applies to stop loss orders.
👉We must stay positive, clear-headed, and humble.
we cannot provide all instructions or all trades here on this channel.
Good luck to us all, and may God guide us. Amen
APEUSD compression breakout: targeting $0.22The Macro Picture 🗺️
ApeCoin has resolved its four-week compression coil to the upside, with the $0.145 ceiling that capped the entire post-floor recovery now broken and flipped into the first layer of support. The June 24 thesis called the patient phase as energy building rather than weakness; two sessions later the chart has done exactly that — RSI lifted from the mid-40s toward 60, supply absorption is visible at every recent low, and the path of least resistance has rotated structurally bullish. The multi-leg story that began on May 19 — defended floor, post-floor recovery, compression, breakout — has reached the leg where the $0.16 trigger that anchored every Idea is finally within arm's reach.
The Setup ⚙️
The Breakout: The clean break of the $0.145 compression ceiling on rising RSI confirms that the four-week coil has resolved upward, with the former ceiling now becoming the first flipped-support shelf that defines the breakout structure.
The Retest: As indicated by the white projection, a pullback into the $0.13–$0.145 zone would typically retest the broken ceiling as support before the continuation leg — this is the textbook breakout-retest-continuation sequence that confirms structural buyers have taken over and locks in the new floor for the move.
The Trigger: A clean reclaim of the $0.16 Local High flips the post-spike ceiling into support and confirms the full structural reset is complete, opening the path of least resistance into the macro shelf that has capped every Idea in the series.
The Roadmap: Primary target sits at $0.22 — the roadmap points directly into structural resistance once $0.16 is reclaimed, with no defensive footing for bears across the corridor between the trigger and the target. Invalidation: a sustained daily close back below $0.10 would invalidate this bullish framework and signal the macro accumulation base has structurally failed, exposing the macro floor at $0.08.
APEUSDT Forming Falling WedgeAPEUSDT is forming a clear falling wedge pattern, a classic bullish wave signal that often indicates an upcoming breakout. The price has been consolidating within a narrowing range, suggesting that selling pressure is weakening while buyers are beginning to regain control. With consistent volume confirming accumulation at lower levels, the setup hints at a potential bullish breakout soon. The projected move could lead to an impressive gain of around 60% to 70% once the price breaks above the wedge resistance.
This falling wedge pattern is typically seen at the end of downtrends or corrective phases, and it represents a potential shift in market sentiment from bearish to bullish. Traders closely watching APEUSDT are noting the strengthening momentum as it nears a breakout zone. Strong trading volume adds confidence to this pattern, showing that market participants are positioning early in anticipation of a reversal.
Investors’ growing interest in APEUSDT reflects rising confidence in the project's long-term fundamentals and current technical strength. If the breakout confirms with sustained volume, this could mark the start of a fresh bullish leg. The current market structure suggests that buyers are gradually taking control while bearish pressure continues to fade.
Traders might find this a valuable setup for medium-term gains, especially as the falling wedge pattern nears completion and buying momentum accelerates. A confirmed breakout could attract additional buying interest and potentially drive the price toward significantly higher levels over the coming weeks.
✅ Show your support by hitting the like button!
✅ Leave a comment below! (What is your opinion about this coin?)
Your feedback and engagement keep me inspired to share more insightful market analysis with you!
APEUSDT 1D#APE is moving inside a bullish flag pattern on the daily chart. It has bounced off the daily SMA100 and the middle line of the flag, and is now facing the flag resistance along with the daily SMA50.
In case of a breakout above these levels, the potential upside targets are:
🎯 $0.1596
🎯 $0.1878
🎯 $0.2107
🎯 $0.2335
🎯 $0.2660
⚠️ Always remember to use a tight stop-loss and maintain proper risk management.
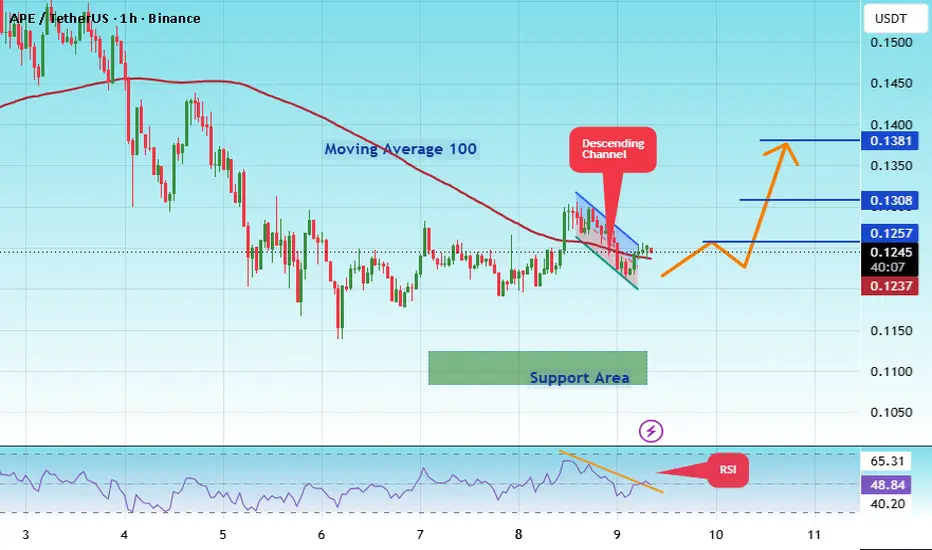
#APEUSDT chart (1-hour timeframe)#APE
The price is moving within a descending channel on the 1-hour timeframe and has reached the lower boundary. It is now poised for a bounce and is expected to retest this boundary.
The Relative Strength Index (RSI) indicates a downward trend, which is likely to continue given the overbought conditions.
There is a key support zone in green at 0.1080. The price has bounced off this zone several times, making it a strong support level.
The price is trending towards the 100-period moving average, which we are approaching. This trend supports an upward move.
Entry Price: 0.1233
Target 1: 0.1257
Target 2: 0.1310
Target 3: 0.1381
Stop Loss: At the resistance zone in green
Remember this simple rule: Money management.
Any questions? Please leave a comment.
Thank you.
APE USDT SHORT SIGNALAPE/USDT – Trade Setup (SHORT)
📈 Position Type: SHORT
🕒 Timeframe: 15M
📊 Market: Futures
💰 Entry Zone:
0.1336
🛑 Stop-Loss:
0.1358
🎯 Take-Profit Targets:
• TP1: 0.1319
• TP2: 0.1294
• TP3: 0.1265
• TP4: 0.1237
TP5:
⚙️ Leverage:
5–10
⚠️ After reaching TP1, move Stop-Loss to Entry Price.
📌 Risk Management:
Risk only 1–2% of your capital per trade.
Always confirm the setup on your chart before entry
APE USDT SHORT SIGNALAPE/USDT – Trade Setup (SHORT)
📈 Position Type: SHORT
🕒 Timeframe: 15M
📊 Market: Futures
💰 Entry Zone:
0.1336
🛑 Stop-Loss:
0.1358
🎯 Take-Profit Targets:
• TP1: 0.1319
• TP2: 0.1294
• TP3: 0.1265
• TP4: 0.1237
TP5:
⚙️ Leverage:
5–10
⚠️ After reaching TP1, move Stop-Loss to Entry Price.
📌 Risk Management:
Risk only 1–2% of your capital per trade.
Always confirm the setup on your chart before entry
Apeusdt longInstructions:
Entry point: yellow
Stop loss: red
Take profit: green
👉Leverage x 5-10-20 for crypto
👉Leverage x 20-50-100 for commodities, stocks, indices, and forex
👉Margin 1-5% max.
Always practice risk and money management.
Invest a maximum of 5% on any trade or across all your trades.
Invest only what you can afford to lose, as no one is in control of the market.
👉Our analyses are primarily based on:
breakouts: two trend lines (ascending and descending) and a line indicating a horizontal breakout.
chart patterns: shoulders and head, triangle parttern, elliott impulse, etc etc.
We don't always have the time to track them at all times or to represent them visibly, given the numerous signals, the number of channels to manage, and especially because of the often rapid pace of market movements.
indicators: We associate at least two indicators with this technique.
👉Depending on the circumstances, we use specific indicators, often setting 3 or more take profit levels.
👉Indeed, there are good days in trading and also bad days. No one can promise to win every trade, and like all traders worldwide, we also experience stop-loss orders. However, we win more than we lose and remain positive.
👉You can close the position before or after the take profit orders indicated by the green lines if you are personally satisfied; the same applies to stop loss orders.
👉We must stay positive, clear-headed, and humble.
we cannot provide all instructions or all trades here on this channel.
Good luck to us all, and may God guide us. Amen.
APEUSD at macro floor: bullish reaction toward $0.22The Macro Picture 🗺️
ApeCoin's May spike to $0.28 was the structural reset that cleared overhead supply across the multi-month downtrend, and the patient three-week digestion since has carried price into the upper edge of the macro accumulation zone for the first time since the spike. This is the make-or-break visit to the structural floor that has anchored the entire post-spike thesis — bulls now have to defend the level that built the foundation back in February. The $0.08–$0.10 accumulation base remains the gravitational anchor that has shaped this entire chapter of price action.
The Setup ⚙️
The Floor: The $0.08–$0.10 accumulation zone absorbed every retest across four months and now faces its first stress test since the May spike — a structural support shelf where sidelined demand has parked and where the multi-month thesis lives or dies.
The Reaction: Price is reacting at the upper edge of the macro accumulation zone with RSI cooled into the mid-40s, signalling that the slow grind from the post-spike highs has fully exhausted seller momentum and that buyers are stepping in to defend the structural anchor.
The Trigger: A clean reclaim of the $0.16 Local High flips the post-spike ceiling into support and confirms the macro accumulation has done its job once again, opening the path of least resistance toward the next macro shelf.
The Roadmap: Primary target sits at $0.22 — as indicated by the white projection, a reaction off the macro accumulation zone reopens the corridor through $0.16 and into structural resistance, completing the multi-leg bullish thesis. Invalidation: a sustained daily close back below $0.10 would invalidate this bullish framework and signal the macro accumulation base has structurally failed, exposing deeper territory beneath the multi-month floor.