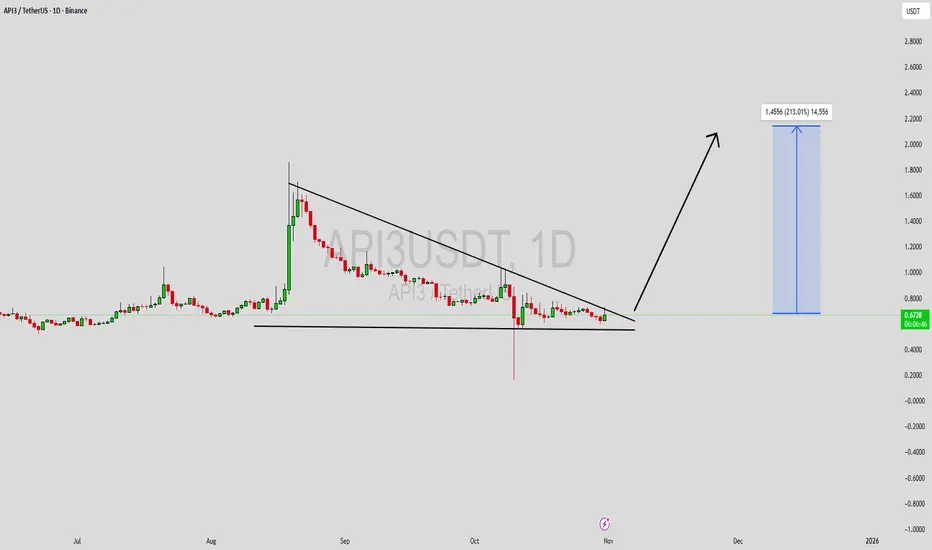
API3/USDT (1d) Consolidating Inside a Long-Term Falling WedgeAPI3/USDT remains inside a large falling wedge on the daily chart following an extended downtrend. Price is currently stabilizing above the lower part of the structure.
A confirmed breakout above the descending resistance could signal a bullish reversal. A breakdown below wedge support would invali
API3USDT Forming Falling WedgeAPI3USDT is forming a clear falling wedge pattern, a classic bullish reversal signal that often indicates an upcoming breakout. The price has been consolidating within a narrowing range, suggesting that selling pressure is weakening while buyers are beginning to regain control. With consistent volum
API3 ULTRA BULLISH HERE🔥 Fortune AI Radar — CRYPTOCAP:API3
Fresh activity detected on CRYPTOCAP:API3 today.
Data suggests increasing market interest & buyers stepping in.
Technicals currently lean bullish, with momentum trending upward.
Whales showing hints of accumulation and hype rising among traders.
This coin is
API3USDT 1DKeep an eye on the #API3 daily chart. Price is trading near the descending resistance. The first attempt to break above the trendline was rejected by the daily SMA50, but we believe a breakout is likely soon. If a breakout occurs, the potential upside targets are:
🎯 $0.4977
🎯 $0.5753
🎯 $0.6381
🎯 $0
API3USDT 4H ChartThe price has successfully broken out of the descending trendline, showing early signs of bullish momentum.
If this breakout holds, potential targets are:
🎯 TP1: 0.7695
🎯 TP2: 0.8462
Support levels to watch for possible retest:
🟥 0.6620 and 0.6010
A healthy retest followed by strong volume confirm
Possible Double Bottom Breakout FormingThe chart shows a clear Double Bottom pattern around the 0.60 zone, indicating a potential bullish reversal.
Price is now testing the descending trendline (neckline), and a confirmed 4H candle close above 0.69 with strong volume could trigger a breakout move.
🎯 Targets:
TP1: 0.7412
TP2: 0.8462
API3USDT Forming Bullish MomentumAPI3USDT is currently showing an impressive bullish pennant pattern, which often serves as a strong continuation signal in technical analysis. After a sharp upward move, the price has entered a brief consolidation phase, forming a tight pennant shape that indicates market indecision before the next
API3/USDT (4H)Price has just bounced perfectly from the ascending trendline, showing strong support and renewed buying pressure.
If momentum continues, we could see a breakout above the triangle and 200 EMA soon.
🟢 Entry idea: Entry can be considered now after the bounce from the trendline, or on confirmation ab
See all ideas
Summarizing what the indicators are suggesting.
Oscillators
Neutral
SellBuy
Strong sellStrong buy
Strong sellSellNeutralBuyStrong buy
Oscillators
Neutral
SellBuy
Strong sellStrong buy
Strong sellSellNeutralBuyStrong buy
Summary
Neutral
SellBuy
Strong sellStrong buy
Strong sellSellNeutralBuyStrong buy
Summary
Neutral
SellBuy
Strong sellStrong buy
Strong sellSellNeutralBuyStrong buy
Summary
Neutral
SellBuy
Strong sellStrong buy
Strong sellSellNeutralBuyStrong buy
Moving Averages
Neutral
SellBuy
Strong sellStrong buy
Strong sellSellNeutralBuyStrong buy
Moving Averages
Neutral
SellBuy
Strong sellStrong buy
Strong sellSellNeutralBuyStrong buy
Displays a symbol's price movements over previous years to identify recurring trends.