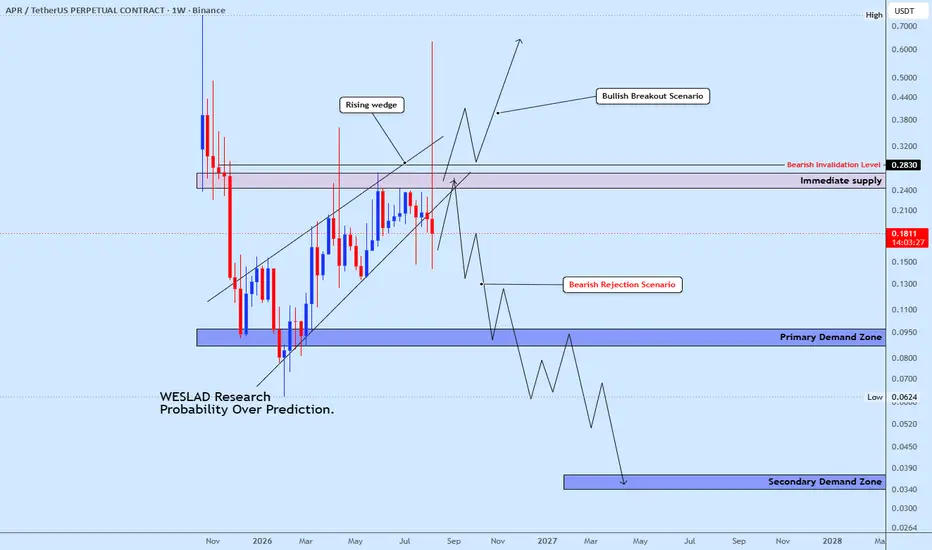
APR | Supply Breakout or Deeper Correction?APR continues to develop within a rising structure but is now approaching the 0.24โ0.26 immediate supply zone, creating a major decision point. A sustained breakout and acceptance above 0.2830 would invalidate the bearish scenario and strengthen the probability of further upside. Conversely, rejection from supply could trigger a deeper correction toward the 0.085โ0.095 primary demand zone, with 0.034โ0.037 secondary demand becoming relevant if primary demand fails.
WESLAD Research โ Probability Over Prediction.
In-depth trading ideas
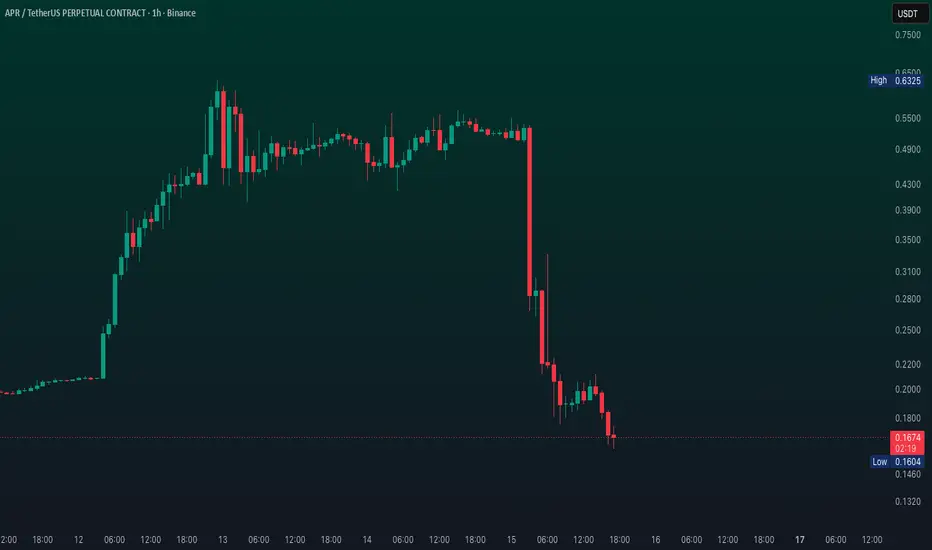
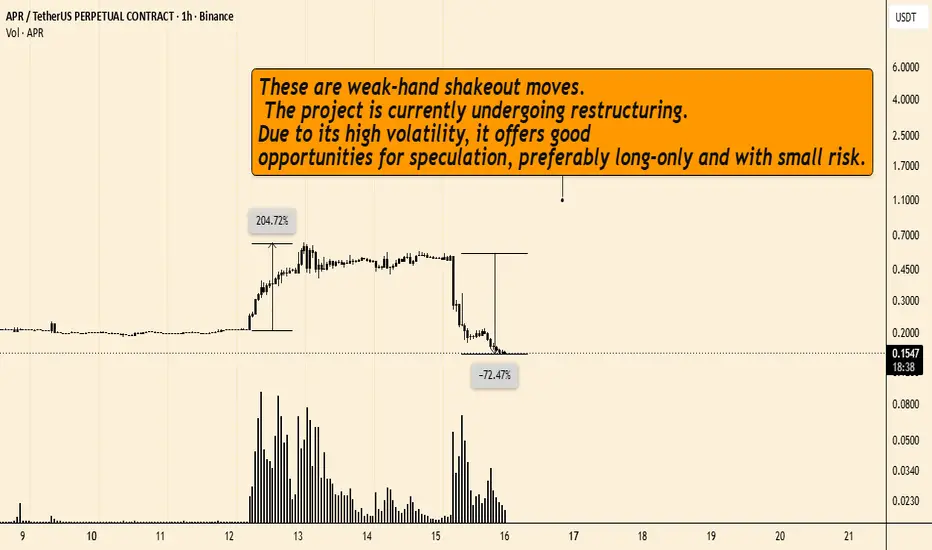
๏ปฟAPR Concentrated Sell Off & Social SentimentOSL:APR price collapsed over 68% with trading volume surging. Social media chatter repeatedly highlighted APR as a top loser, with terms like "RUGGED" and "dumped very hard" dominating. This indicates a fear-driven sell-off, potentially triggered by profit-taking gain on 14 August. What it means: The move was driven by market sentiment and trader behavior, not a verified fundamental event. Watch for A slowdown in negative social mentions and a reduction in selling volume. While specific derivatives data is lacking, social traders openly discussed shorting APR with leverage. This can create a feedback loop, initial selling triggers liquidations, forcing more sells and attracting momentum shorts. Leverage likely accelerated the downward move, turning a correction into a cascade. Watch for Shifts in funding rates or open interest data to confirm if short positioning is being unwound. The crash leaves APR in a technically weak position. The key near-term trigger is whether the intense selling exhausts itself. The trend is strongly bearish, but oversold conditions may lead to a brief pause or bounce. Watch for A daily close to signal selling pressure is easing, or a break below for continuation. Bearish Pressure The dramatic drop was a sentiment driven sell-off amplified by leverage, with no apparent fundamental news to halt the decline. Monitor if trading volume normalizes in the next 24-48 hours.
APR / APRUSDT Long Setup | Breaker Block ReclaimMARKET ANALYSIS
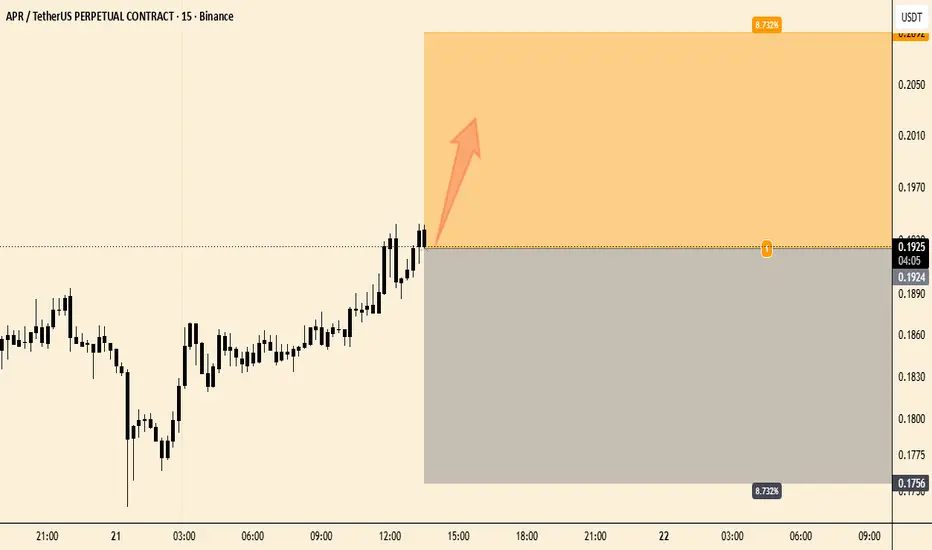
APR is currently reacting from a key technical area highlighted on the chart.
As long as the protected support zone remains intact, the bullish market structure remains valid and higher liquidity targets may continue to attract price action.
A breakdown below the invalidation level would weaken the current bullish scenario and require a reassessment of market conditions.
๐ Entry, Stop Loss and Take Profit levels are marked directly on the chart.
โโโโโโโโโโโโโโ
โ ๏ธ DISCLAIMER
This publication is provided solely for educational and market observation purposes.
Nothing contained in this analysis should be considered financial advice, investment advice, or a recommendation to buy or sell any financial instrument.
All trading and investment decisions remain solely the responsibility of the individual trader.
Always conduct your own research and apply proper risk management before entering any position.
โโโโโโโโโโโโโโ
๐ฏ PARALOG
โช๏ธCrypto Market Analysis
โช๏ธBTC Futures Signals
โช๏ธBitcoin & Altcoin Market Analysis
Precision โข Momentum โข Timing
โโโโโโโโโโโโโโ
Exchange: #MEXC Futures
#bitcoin #btc #crypto #futures #technicalanalysis
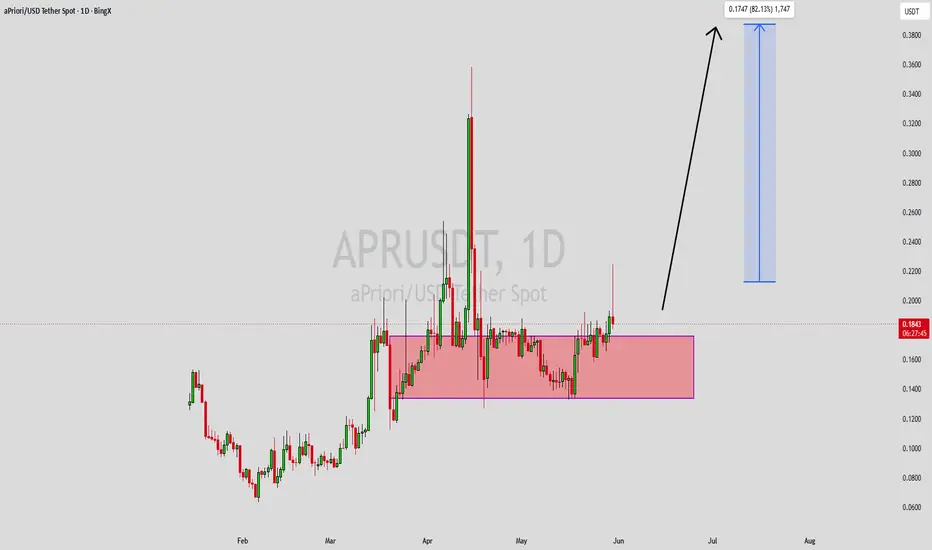
APRUSDT Forming Bullish MomentumAPRUSDT is forming a clear bullish momentum pattern, a classic bullish wave signal that often indicates an upcoming breakout. The price has been consolidating within a tightening range, suggesting that selling pressure is gradually weakening while buyers are steadily regaining control. With consistent volume supporting accumulation at lower levels, the current setup points toward the possibility of a strong bullish breakout in the near future. The projected move could result in an impressive gain of around 70% to 80% once the price successfully breaks above the key resistance zone.
This bullish momentum pattern is commonly observed near the end of corrective phases or prolonged downtrends, often signaling a transition in market sentiment from bearish to bullish. Traders closely watching APRUSDT are noticing the strengthening price structure as it approaches a critical breakout area. Healthy trading volume further reinforces the setup, indicating that market participants may be positioning themselves ahead of a potential upward move.
Growing interest in APRUSDT reflects increasing confidence in both its technical outlook and broader market potential. If the breakout is confirmed with sustained buying volume, it could mark the beginning of a fresh bullish trend. For traders seeking medium-term opportunities, this setup may offer an attractive risk-to-reward scenario as momentum continues to build and buying pressure accelerates.
โ
Show your support by hitting the like button!
โ
Leaving a comment below! (What is your opinion about this coin?)
Your feedback and engagement keep me inspired to share more insightful market analysis with you! ๐๐
#APR
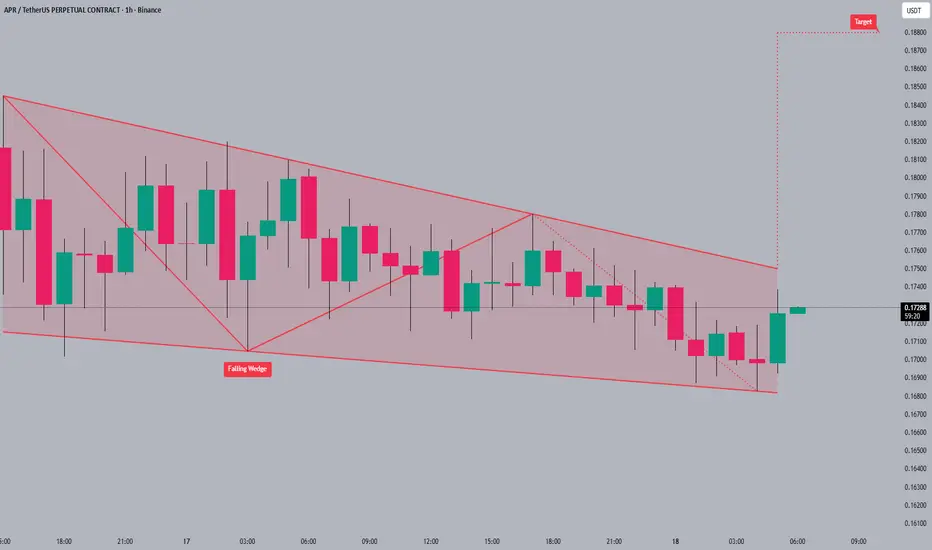
#APR is currently consolidating within a falling wedge pattern ๐ง, hinting at a potential bullish reversal. The falling wedge formation ๐ suggests decreasing selling pressure as it nears the apex. A breakout could target the 0.188 level ๐ฏ, offering a significant upside.
Patience is key; wait for confirmation before entering a trade ๐ก.
#APR #crypto #trading #altcoins
APRUSDT Strong Bull 70% Price at Floor With OBV Turning InflowAPRUSDT Strong Bull 70% Price at Floor With OBV Turning Inflow
APRUSDT
Overview
APRUSDT is building a case for reversal from the floor. Price sits at just 14.3% of its 200-bar range while the bias reads strong bull at 70.9% with a 4.3x breakout recovery ratio. The most telling signal is OBV. Despite sitting at negative 0.87, it has turned to inflow and is rising. Money is quietly flowing back in before volume Z-scores confirm it. Leverage is manageable at 6.62x in the lower percentile zone. A price squeeze is building at 4 bars with bull momentum. The ingredients for a move are assembling but the volume confirmation has not arrived yet.
Price
Spot prints 0.10214 with futures at 0.10180, placing the pair in backwardation at negative 0.33%. The retrace from recent highs is negative 9.3% with a 39.6% bounce, producing a 4.3x recovery ratio classified as breakout. Buyers have reclaimed more than four times the pullback. The 200-bar range shows a high of 0.31299 and a low of 0.0669, placing price at 14.3% in the floor zone. There is enormous structural room above. Mean Z sits at negative 0.74 sigma in normal territory, confirming price is below its statistical average but not at an extreme deviation. Standard deviation is 0.194%, a relatively tight regime.
Bias
The multi-timeframe grid reads strong bull at 70.9% with 49% clarity. Out of 112 signals, 39 are bullish against 16 bearish. EMA structure is a clean sweep at 6 to 0. Candle patterns favor bulls 9 to 5. Ichimoku crosses lean bullish 9 to 3. The three soldiers pattern fired at 3 to 1 with star patterns at 2 to 0 and total patterns at 5 to 1. Deep timeframes lean bullish with close-over-trend at 8 to 5 and engulfing split at 2 to 2. The spread sits at 41.8%, classified as strong. The holdout is in the slowest structural indicators. SS/DD reads 1 to 3 bearish, showing higher timeframe structure has not caught up. This is the same pattern seen across many reversals where momentum indicators lead and structural indicators lag.
Volume
Quiet across the board but with an important undercurrent. Spot Z-score is negative 0.7 quiet, futures negative 0.27 steady, combined negative 0.33 steady. Momentum is negative 0.04 and falling, essentially flat. Bull versus bear Z-scores read 0.14 against negative 0.47, mildly favoring bulls but below any actionable threshold. No whale activity, no liquidations, clear on both sides. The one-bar-to-five comparison shows negative 0.7 versus negative 0.66, virtually unchanged. No volume squeeze on either spot or futures, and squeeze divergence reads normal. Spot squeeze momentum is contracting at 187.9%. The headline number here is OBV. At negative 0.87 with inflow direction rising, this tells you accumulation has begun even though it is not showing up in raw volume Z-scores yet. OBV leads volume. The turn from outflow to inflow while price is at the floor is the earliest possible signal of a base forming.
Leverage
Leverage sits at 6.62x, classified as elevated but well within normal range. The percentile reads 38% in the lower zone. This pair has seen dramatic leverage swings. The all-time max was 68.8x from 236 bars ago while the all-time min was just 0.98x only 30 bars ago. Going from near spot dominant at 0.98x to 6.62x in 30 bars shows speculative interest is returning but has not reached dangerous levels. Futures to spot dollar volume runs 14.34M against 2.16M. The lower percentile means there is room for leverage to expand without hitting danger zones, which could provide additional fuel if the move develops.
Premium
Futures trade at a 0.33% discount in backwardation. The premium Z-score is negative 1.9, significantly below its mean. This is a strong contrarian bull signal from the premium perspective. Annualized yield reads negative 364% APY at negative 1.9 sigma. The deep backwardation means futures traders are pricing the asset meaningfully lower than spot holders, creating an arbitrage dynamic that favors convergence toward spot price. When premium Z is this negative while bias is bullish, it historically resolves through futures rallying to catch up with spot rather than spot falling to meet futures.
Squeeze
A price squeeze has been building for 4 bars at the elevated stage with bull momentum and upward direction. Bollinger bandwidth is at 38.3%. This is early stage compression. The squeeze needs more bars to build into imminent territory for highest conviction, but the direction of momentum is already set as bullish. No volume squeeze is building on either side, which means the price squeeze will need a volume catalyst to fire with conviction. The OBV inflow turn could be the precursor to that catalyst.
Scenarios
1. Base building into squeeze resolution, 45% probability. OBV continues rising, the squeeze builds from elevated toward imminent over the coming bars, and volume gradually activates. The 4.3x breakout ratio holds as the floor zone becomes established support. Price targets the lower-mid range around 0.15 to 0.18 on the first leg. Leverage stays in the lower zone confirming spot-led accumulation.
2. Early breakout on premium convergence, 30% probability. The negative 1.9 sigma premium Z forces a convergence event where futures rally to close the gap with spot. This triggers volume activation and accelerates the squeeze timeline. The strong bull bias carries price higher quickly but the move is partially futures-driven rather than purely organic. Watch for leverage percentile climbing above 50% as the signal this scenario is playing out.
3. Failed base with drift lower, 25% probability. Volume remains quiet and OBV inflow stalls. The squeeze dissipates without firing as selling pressure slowly resumes. Price drifts toward the 200-bar low at 0.0669. The SS/DD reading of 1 to 3 bearish proves to be the correct structural read. This scenario becomes likely if OBV flips back to outflow within the next several bars.
Watch List
1. OBV trajectory. Currently negative 0.87 with inflow rising. Sustained inflow pushing OBV Z toward zero would confirm accumulation is real. A reversal back to outflow would invalidate the base thesis.
2. Squeeze progression. Currently at elevated 4 bars. Building toward 8 bars high or 15 bars imminent increases conviction. A collapse of the squeeze without firing is bearish.
3. Spot volume activation. Z-score needs to cross above zero to confirm real participation is entering. The OBV turn should precede this by several bars.
4. Premium normalization. At negative 1.9 sigma, the convergence trade is significant. Watch for premium Z moving toward zero as futures catch up.
5. Leverage trajectory. Currently 38% lower with room to expand. A gradual rise toward mid is healthy fuel. A spike toward ceiling would change the risk profile entirely.
Risk
The primary risk is premature entry into a market with no volume confirmation. The bias is strong and the recovery ratio is convincing, but raw volume is quiet across every metric. OBV inflow is the leading signal, not confirmation. Entering now means trusting the OBV turn and the squeeze build before they deliver results. The floor zone price at 14.3% provides natural risk definition since a break below the 200-bar low at 0.0669 would invalidate the thesis entirely. The deep backwardation at negative 1.9 sigma premium Z adds an asymmetric element where the convergence payoff is significant if the base holds. Size for the possibility that this base takes time to develop and use the OBV direction as the ongoing health check. If inflow persists and the squeeze builds, add on confirmation. If OBV flattens or reverses, stand aside.
More analysis on my profile.
Tags: APRUSDT, APR, crypto, bullish, floor, volume analysis, leverage, premium, squeeze, market structure, accumulation
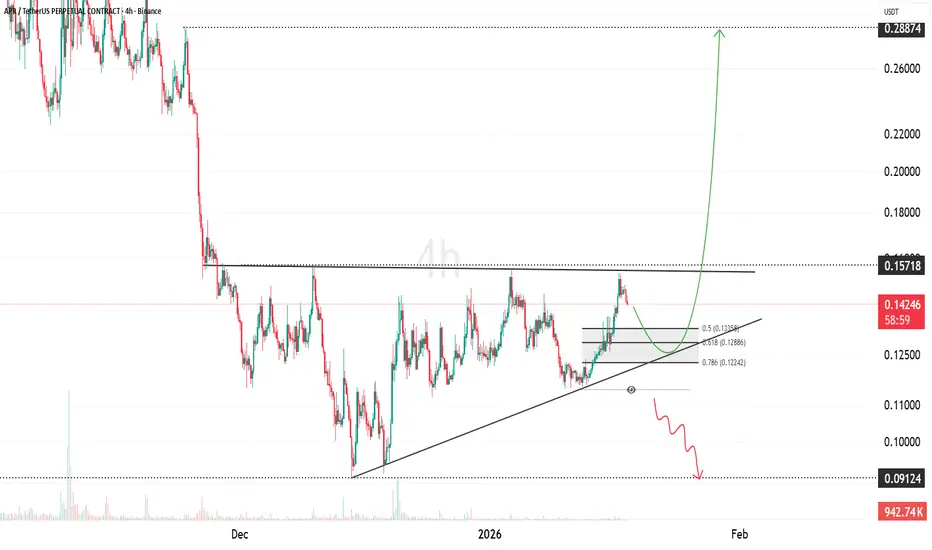
APR - Ascending Support Holding | Break Above Range Can Trigger APR on the 4H timeframe is forming a rising base after a sharp selloff, with price respecting an ascending trendline from the December low. Higher lows are developing while price consolidates below the key horizontal resistance at 0.157โ0.160.
The pullback is holding within the 0.618โ0.786 retracement zone (0.128โ0.122), which aligns with the rising trend support, strengthening this area as a demand region. As long as price holds above the trendline, the structure remains constructive.
A clean break and acceptance above 0.157 can open the path toward the higher resistance near 0.288. Failure to hold the ascending support would invalidate the setup and expose downside toward 0.091.
$APR is holding strong at the 0.225 support and squeezing under GETTEX:APR is holding strong at the 0.225 support and squeezing under a falling wedge pattern, which is typically a bullish reversal setup. Selling pressure has weakened and volume has dried up near support, showing possible accumulation.
If buyers step in, a push toward the 0.28 resistance is likely. A clean breakout above that level would confirm the wedge breakout and could trigger momentum quickly.
As long as 0.225 holds, the chart keeps its bullish setup alive.