Aptos Builds Momentum, Bullish H&S Pattern Aptos (APT) continues to show signs of accumulation after establishing support above the key high timeframe level around $0.57.
This region is supported by multiple technical confluences, including the Value Area Low of the current range and the 0.618 Fibonacci retracement, making it a significant
Compare with APT/USDT
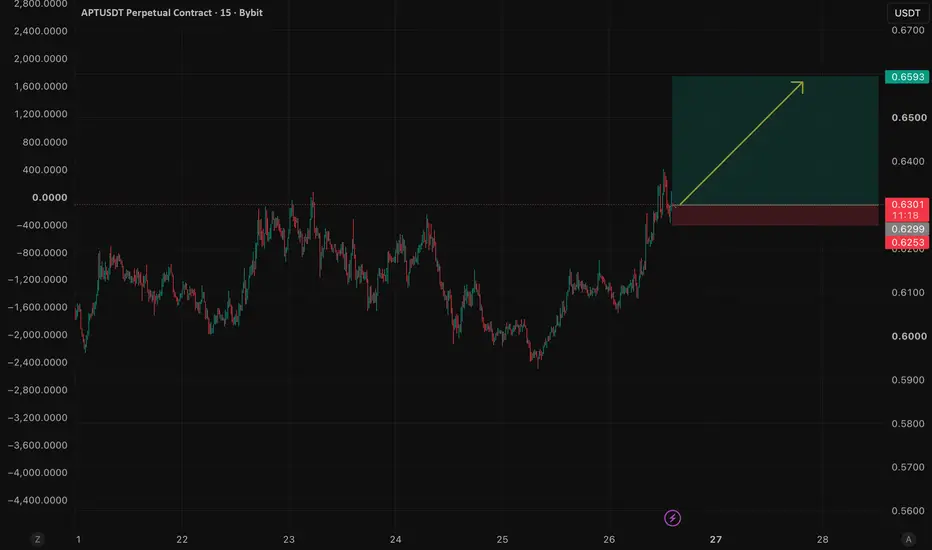
APTUSDT: Bullish Breakout Signals Potential for Further UpsideAPTUSDT has broken above its recent consolidation range with strong bullish momentum, suggesting buyers are regaining control. The impulsive move higher, followed by price holding above the breakout area, indicates the previous resistance has the potential to act as new support.
As long as 0.6253 h
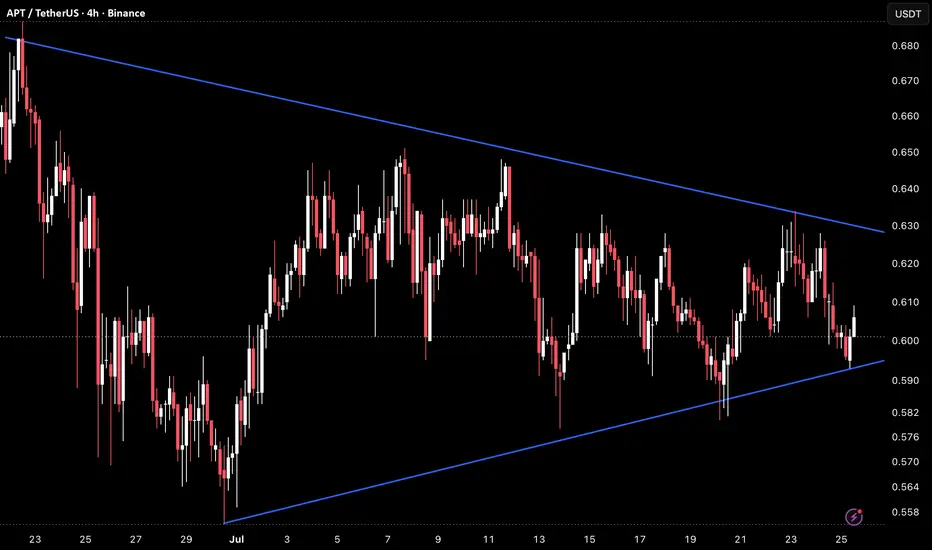
APT 4H – Symmetrical Triangle Compressing at ApexAPT on the 4H timeframe is currently trading around 0.661 after oscillating inside a symmetrical triangle since late June, with the descending upper trendline and rising lower trendline now converging tightly as the structure approaches its apex and the 0.600–0.607 horizontal pivot continues to defi
APT 1D – Descending Channel at Lower BoundaryAPT on the 1D timeframe is currently trading around 1.766 after a sustained decline from the January high near 2.000, with price now pressing into the lower boundary of a descending channel that has defined the macro structure across the entire visible chart, currently sitting near 0.540–0.570.
The
APTUSDT 3D Bullish Reversal Setuphi traders
This technical analysis outlines a highly compelling bullish reversal setup for APTUSDT on the macro 3-Day (3D) time frame. The asset has been grinding down in a corrective structure, but several major technical indicators suggest that a bottom is either in or extremely close to forming.
#APTUSDT is currently strongly bullish#APT
The price is moving within a descending channel on the 1-hour timeframe and has reached the lower boundary. It is now poised for a bounce and is expected to retest this boundary.
The Relative Strength Index (RSI) indicates a downward trend, which is likely to continue given the overbought con
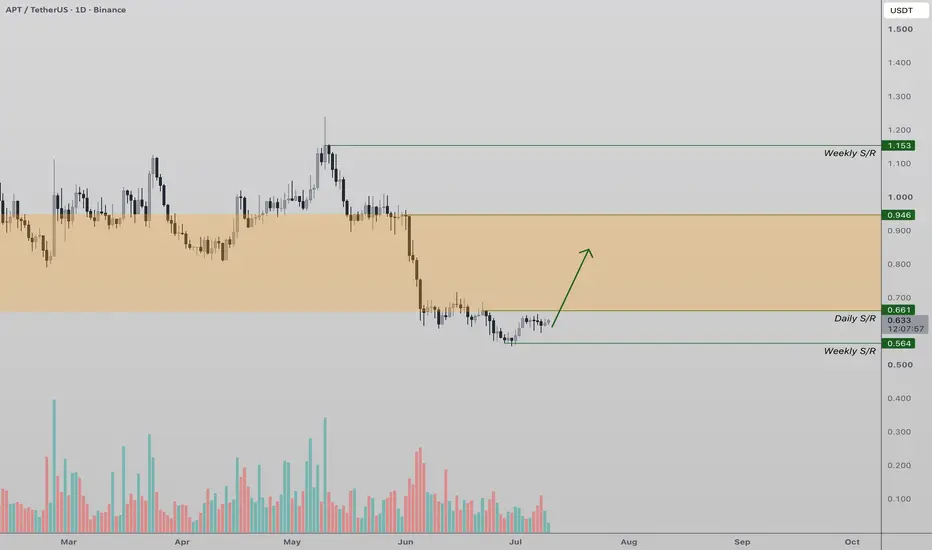
Aptos Tests Critical ResistanceAptos (APT) is currently trading just below a major daily resistance, placing price at a pivotal technical level that could determine the next directional move. Following the recent decline, the market is attempting to stabilize, but buyers must reclaim this overhead resistance before any meaningful
APT / USDT — Market StructureAPT continues to consolidate beneath resistance while buyers continue to defend higher lows.
Selling pressure has gradually weakened, while demand remains resilient during pullbacks, suggesting improving absorption around current levels.
Liquidity continues to build as price approaches a key decis
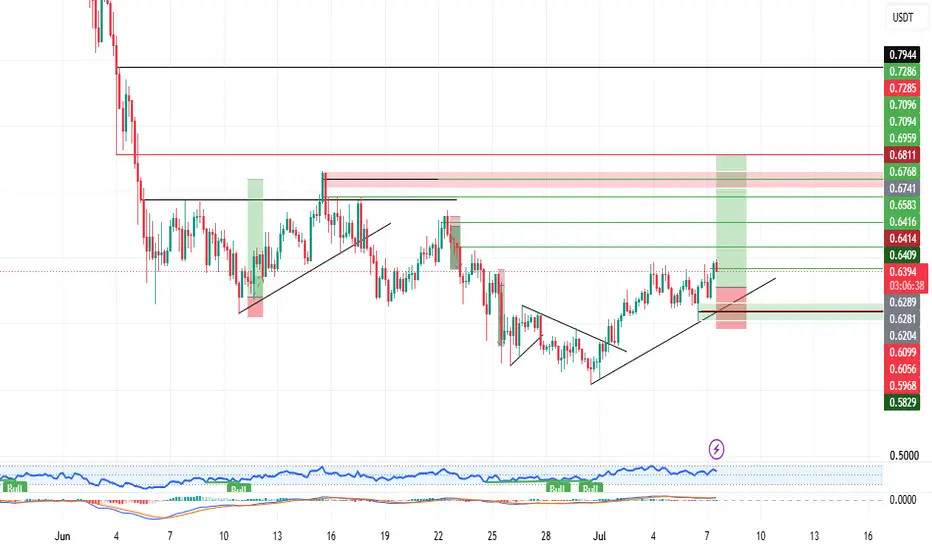
APT: recovery base eyeing the $0.70 decisionThe Macro Picture 🗺️
APT broke down hard through June, collapsing from the $0.95 shelf into a $0.55 liquidity sweep that dragged RSI into deep oversold and flushed the over-leveraged longs. Buyers stepped in at the lows and have since rebuilt a base above $0.58, curling up from the $0.62 equilibri
See all ideas
Summarizing what the indicators are suggesting.
Oscillators
Neutral
SellBuy
Strong sellStrong buy
Strong sellSellNeutralBuyStrong buy
Oscillators
Neutral
SellBuy
Strong sellStrong buy
Strong sellSellNeutralBuyStrong buy
Summary
Neutral
SellBuy
Strong sellStrong buy
Strong sellSellNeutralBuyStrong buy
Summary
Neutral
SellBuy
Strong sellStrong buy
Strong sellSellNeutralBuyStrong buy
Summary
Neutral
SellBuy
Strong sellStrong buy
Strong sellSellNeutralBuyStrong buy
Moving Averages
Neutral
SellBuy
Strong sellStrong buy
Strong sellSellNeutralBuyStrong buy
Moving Averages
Neutral
SellBuy
Strong sellStrong buy
Strong sellSellNeutralBuyStrong buy
Displays a symbol's price movements over previous years to identify recurring trends.
Frequently asked questions
The current price of APT / USDT Spot Trading Pair (APT) is 0.605 USDT — it has fallen −0.34% in the past 24 hours. Try placing this info into the context by checking out what coins are also gaining and losing at the moment and seeing APT price chart.
APT / USDT Spot Trading Pair price has fallen by −2.31% over the last week, its month performance shows a 2.07% increase, and as for the last year, APT / USDT Spot Trading Pair has decreased by −87.40%. See more dynamics on APT price chart.
Keep track of coins' changes with our Crypto Coins Heatmap.
APT / USDT Spot Trading Pair (APT) reached its highest price on Jan 30, 2023 — it amounted to 20.076 USDT. Find more insights on the APT price chart.
See the list of crypto gainers and choose what best fits your strategy.
APT / USDT Spot Trading Pair (APT) reached the lowest price of 0.554 USDT on Jun 30, 2026. View more APT / USDT Spot Trading Pair dynamics on the price chart.
See the list of crypto losers to find unexpected opportunities.
The safest choice when buying APT is to go to a well-known crypto exchange. Some of the popular names are Binance, Coinbase, Kraken. But you'll have to find a reliable broker and create an account first. You can trade APT right from TradingView charts — just choose a broker and connect to your account.
Crypto markets are famous for their volatility, so one should study all the available stats before adding crypto assets to their portfolio. Very often it's technical analysis that comes in handy. We prepared technical ratings for APT / USDT Spot Trading Pair (APT): today its technical analysis shows the strong sell signal, and according to the 1 week rating APT shows the sell signal. And you'd better dig deeper and study 1 month rating too — it's sell. Find inspiration in APT / USDT Spot Trading Pair trading ideas and keep track of what's moving crypto markets with our crypto news feed.
APT / USDT Spot Trading Pair (APT) is just as reliable as any other crypto asset — this corner of the world market is highly volatile. Today, for instance, APT / USDT Spot Trading Pair is estimated as 4.30% volatile. The only thing it means is that you must prepare and examine all available information before making a decision. And if you're not sure about APT / USDT Spot Trading Pair, you can find more inspiration in our curated watchlists.
You can discuss APT / USDT Spot Trading Pair (APT) with other users in our public chats, Minds or in the comments to Ideas.