APTUSDT SPOT
No trades
No trades
In-depth trading ideas
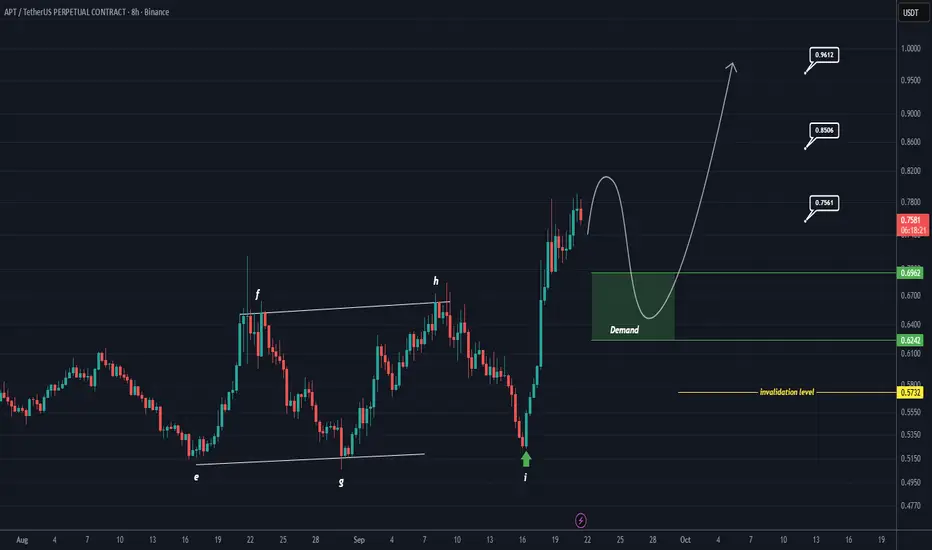
APT May Be Ready for a Major Bounce (8H)After a bearish CH formed on the chart, both the internal and external structures turned bearish. Price is now approaching the discount zone of the previous impulse move, which is also the origin of a strong bullish movement. We are looking for buying opportunities (Buy/Long) at the marked demand zone.
This is a swing trade setup, so it may take time to develop and reach its targets. Make sure to manage your risk properly and keep your time expectations realistic. Patience is essential for this
#APTUSDT Can Price Break the Descending Channel and Target $0.61#APT
he recent decline in Bitcoin has triggered selling pressure across most cryptocurrencies, including the asset under analysis.
On the 12-hour timeframe, the price has declined toward a major support zone at $0.4770, which represents a key level to monitor for the upcoming price action.
From a technical perspective, the price is currently trading within a descending channel and has reached its lower boundary, coinciding with the major support zone. This confluence increases the technical s
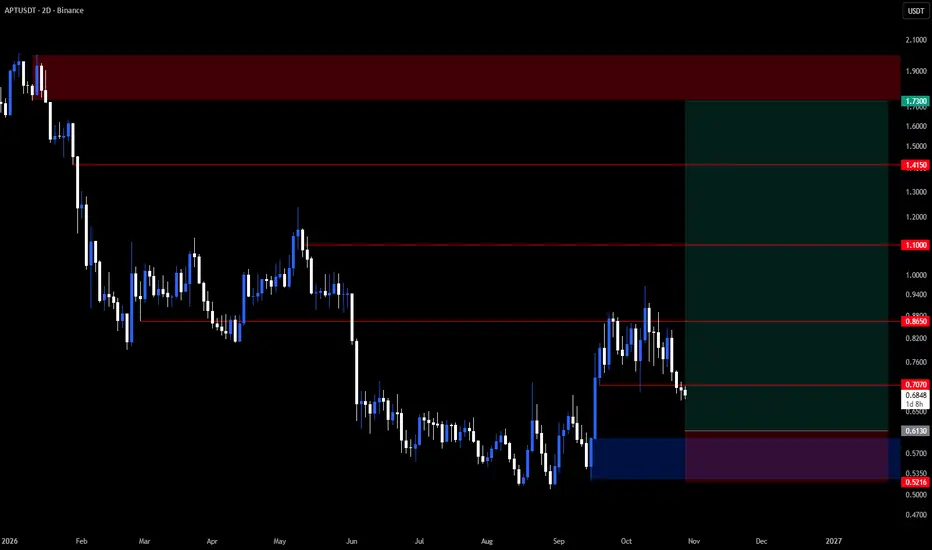
APT/USDT analysisAPT appears to be recovering from its previous bearish structure after establishing a potential bottom around the $0.50 demand area.
Following the initial bullish rally towards the $0.8650 resistance level, the price is now declining towards the $0.6130 demand area, where a potential bullish reversal could develop.
If the demand area holds, APT could continue its bullish recovery towards $0.8650, followed by $1.1000 and $1.4150.
For the final target, we will use the supply area at $1.7300.
T
#APTUSDT The triangle has broken out Will the rally continue?#APT
Interestingly, this coin is holding up well after its rally, without dropping alongside Bitcoin, suggesting strong price action on the chart.
Two triangle patterns are visible: the first delivered a gain of approximately 12%, while the second has broken upward, targeting 0.8150.
The price is bouncing from strong support at 0.6600, a former resistance level that has now turned into support.
The bullish outlook is supported by the RSI breaking above its descending trendline, holding above
#APTUSDT #8h (Binance) Ascending trendline break retest [SHORT]APT (Aptos) is pulling back to 50MA resistance, a slight deviation above it then a rejection would make sense.
⚡️⚡️ #APT/USDT ⚡️⚡️
Exchanges: Binance Futures, Bitget Futures
Signal Type: Regular (SHORT)
Leverage: Isolated (9.0X)
Amount: 5.3%
Entry Targets:
1) 0.8266 - 100.0%
Take-Profit Targets:
1) 0.7218 - 50.0%
2) 0.6173 - 50.0%
Stop Targets:
1) 0.8615 - 100.0%
Trailing Configuration:
Stop: Breakeven -
Trigger: Target (1)
Published By: @TradingOn
$CRYPTOCAP:APT BINANCE:APTUSDT.P #8h #
APTUSDT: Volatility Compresses Near the Lower BoundaryAPT/USDT on Binance is in a confirmed volatility compression on the four-hour chart. The Volatility Pressure alert belongs to the candle closed at 20:00 UTC on 22 October. Its quiet score was 96.7 out of 100 and the compression had lasted the required six bars. On the live chart the indicator remains visible, labels the state ACTIVE COMPRESSION and rounds the quiet score to 97. This describes subdued price movement, not a directional signal.
The alert defines a compression zone from 0.7531 to 0
APTUSDT - real trader never miss this!The weekly chart reveals something very important.
The coin previously formed a triangle pattern, broke down to the downside, and then experienced a massive sell-off — dropping more than 96% over approximately 45 months.
However, the price action we’ve seen over the past few days could be a strong bullish signal. The coin has finally broken above a descending trendline after spending a long time forming a major bottom.
There’s just one major resistance level left to watch: $1.23, which aligns
APT Rejection Could Trigger a Deeper DropYello Paradisers! Is #APTUSDT about to trap late buyers before another aggressive move lower?
💎#APTUSDT is currently trading around $0.834, directly below a critical 1H resistance zone around $0.835–$0.842. This area also aligns closely with the Volume Profile POC near $0.843, making it an important decision zone where buyers may struggle to regain control.
💎The broader structure remains cautious. The 1W and 1D outlooks suggest a pullback, while both the 4H and 1H structures remain bearish. Pr
$APT now 75% up from our entry and still 10x Potential ?AMEX:APT IS DOWN 97.5%… BUT WHAT IF THIS IS THE ULTIMATE 50X OPPORTUNITY?
Aptos Is Approaching A Potential Generational Accumulation Zone!
➡️ Multi-Year Downtrend
➡️ High-Risk Accumulation Zone: $0.65–$0.50 Filled
➡️ Bullish Confirmation Above $1.24
➡️ Price now 75% Up from Our Accumulation Zone
UPSIDE MACRO ROADMAP: $1.24 | $2 | $3.50 | $7 | $20
AMEX:APT Could Deliver A Massive Mean-Reversion Rally If The Market Structure Flips Bullish.
I'm Watching This Zone Closely. The Next Major Cryp
$APTUSDT is EXPECTED TO BE BULLISH📈 BREAKOUT IN PROGRESS
APT has broken above the descending trendline with strong momentum and increased volume.
Price is now retesting the $0.815–$0.820 support zone, which is key for validating the breakout.
Bullish scenario:
Hold $0.815–$0.820 → reclaim $0.83 → break $0.84 for continuation.
Invalidation:
1H close below $0.815, with further weakness below $0.80.
Key: The breakout is not fully confirmed yet — the current retest will determine whether the former resistance becomes support.
APT / USDT (DOUBLE TOP FORMATION)Market Structure & Trade Setup
Price has been in a clear uptrend, consistently forming Higher Highs (HHs) and Higher Lows (HLs). However, a bearish divergence developed on the 1H RSI, indicating weakening bullish momentum. This divergence was further supported by the formation of a Double Top reversal pattern.
Following the reversal, price began printing Lower Highs (LHs) and Lower Lows (LLs), indicating a potential shift in market structure from bullish to bearish.
An instant sell entry was
APTUSDT 3D Bullish Reversal Setuphi traders
This technical analysis outlines a highly compelling bullish reversal setup for APTUSDT on the macro 3-Day (3D) time frame. The asset has been grinding down in a corrective structure, but several major technical indicators suggest that a bottom is either in or extremely close to forming.
1. Macro Falling Wedge Structure
The price action is currently compressed within a falling wedge pattern (defined by the downward-sloping yellow support and resistance lines). Falling wedges are inh
APT/USDT (1D) — Multi-Month Descending Trendline Breakout & MacrMarket Structure & Technical View:
Aptos (APT) has initiated a massive technical breakout from a multi-month falling wedge/descending channel structure that dominated price action throughout the cycle. Following an extended rounded accumulation base around the cycle lows, price has pushed aggressively above the local consolidation range.
Daily RSI has surged above 74, crossing cleanly over its moving average to confirm dominant buyer momentum and the onset of a macro reversal. Holding above th
Aptos likely to explode violentlyAptos' introduction to the crypto markets led alot of investors excited, bouncing around in the $3-20 range for 3 years, only to bleed to absolute lows along with alot of other alts.
Now I'm not normally an altcoin person, but looking at this chart, the volume inversion is simply incredible.
Not only do I believe there is a strong reversion to the upside, I believe it might carry much further once people get Aptos in their scope again.
My own targets are in the $2-5 range, and not expecting a
APTOS Finished the Bearish Pattern (4H)A large and time-consuming Symmetrical pattern appears to have been completed on APTOS, and after this long consolidation phase, the price is now showing signs of entering the first bullish wave of a potential new structure.
From the current market structure, the next important area to watch is the green zone marked on the chart. If APTOS experiences a pullback toward this area, we will be looking for an opportunity to catch the next bullish move. The plan is to build a buy position in this zon
APTUSDT is bullishWe have broken from above of an horizontal rectangle, expecting to see further move to the upside from here.
The resistances will be around the range of $0.9 - $1
Enjoy the accuracy, take a look on how our previous charts. are successful, and follow to get yourself an accurate source of prediction.
APT Buyers Trapped Again?Yello Paradisers, are #APTUSDT buyers about to get trapped again while price continues struggling directly below a critical intraday resistance zone?
💎#APTUSDT has already shown us an important sequence. Price first pushed above the previous highs around the $0.77 area, attracting breakout buyers and taking liquidity resting above those highs. Instead of continuing higher, that move was aggressively rejected and followed by a sharp sell-off toward $0.70.
💎That rejection is important because it
APTUSDT — Watching a Repeated Demand Zone for a LONGOn APT, the area between 0.5149 and 0.5216 continues to stand out.
This zone has already produced several strong buyer reactions. The latest test also resulted in a fast expansion higher.
If price returns there again, I’ll be watching for another possible LONG.
LONG zone: 0.5149–0.5216
Invalidation: 0.4973
Potential: roughly 3–40% clean price movement
One important point: repeated tests make a level obvious, but every additional test can also weaken it.
So if APT returns to the zone, the qu