#ARBUSDT | Testing Wedge Breakout Amid Key Support
#ARB
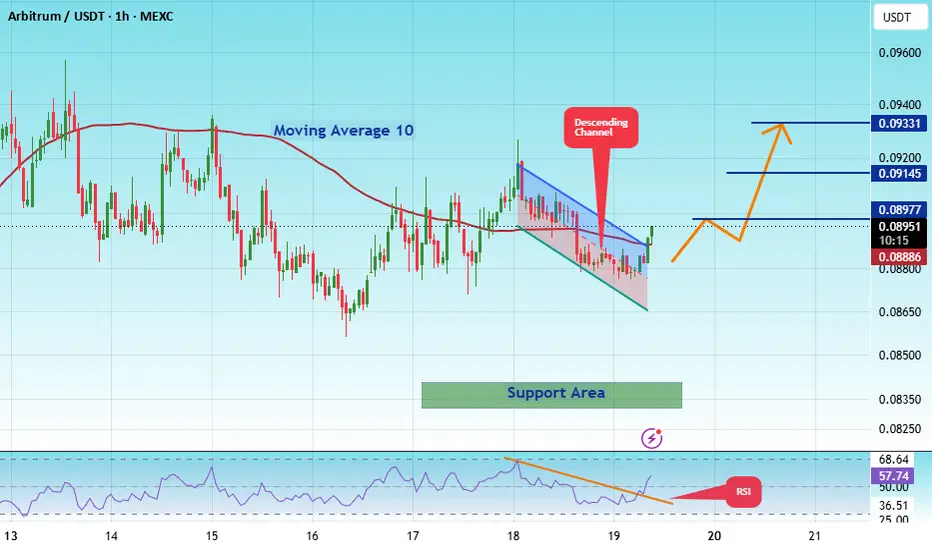
The price is moving within a descending channel on the 1-hour timeframe and has reached the lower boundary. It is now poised for a bounce and is expected to retest this boundary.
The Relative Strength Index (RSI) indicates a downward trend, which is likely to continue given the overbought conditions.
There is a key support zone in green at 0.08325, and the price has bounced off this zone several times, making it a strong support level.
The price is trending towards the 100-period moving average, which we are approaching. This trend supports an upward move.
Entry Price: 0.08880
Target 1: 0.08977
Target 2: 0.09145
Target 3: 0.09330
Stop Loss: At the resistance zone in green
Remember this simple rule: Money management.
Any questions? Please leave a comment.
Thank you.
In-depth trading ideas
๏ปฟARB: local squeeze with $0.0973 destinationThe Macro Picture ๐บ๏ธ
ARB unwound from the $0.1495 macro ceiling into a summer base and now sits at $0.0783, holding above the $0.0740 local low. Price is coiling in the lower half of the range with the floor intact โ a base rebuilding, not a breakdown.
The Setup โ๏ธ
The Range Floor ๐ข
$0.0740 (Local Low) is the demand shelf, with $0.0705 (Macro Support) as the deeper backstop just below. Both have held, and that's the base this range pivots on.
The Decision Point ๐ด
$0.1013 (Local High) is the gate. A daily close above it flips the local structure bullish; the $0.0973 measured-move target sits just under it as the first objective.
The Roadmap ๐ฃ๏ธ
Hold above $0.0740 โ push $0.0973 โ break $0.1013. Invalidation is a clean daily close below $0.0705 โ that breaks the range.
This is a GRID Range Play: a defined band to rotate, buying the lower half and scaling out into the breakout.
#ARB #Arbitrum #crypto #trading #TA #3Commas #GRID
#ARBUSDT | Testing Wedge Breakout Amid Key Support#ARB
The price is moving within a descending channel on the 1-hour timeframe and has reached the lower boundary. It is now poised for a bounce and is expected to retest this boundary.
The Relative Strength Index (RSI) indicates a downward trend, which is likely to continue given the overbought conditions.
A key support zone has been identified in green at 0.08350. The price has bounced off this zone several times, making it a strong support level.
The price is trending towards the 100-period moving average, which we are approaching. This trend supports an upward move.
Entry Price: 0.08850
First Target: 0.08971
Second Target: 0.09129
Third Target: 0.09330
You can close at the second target or wait for the third target. The choice is yours.
Stop Loss: At the resistance zone in green.
Remember this simple rule: Money Management.
Any questions? Please leave a comment.
Thank you.
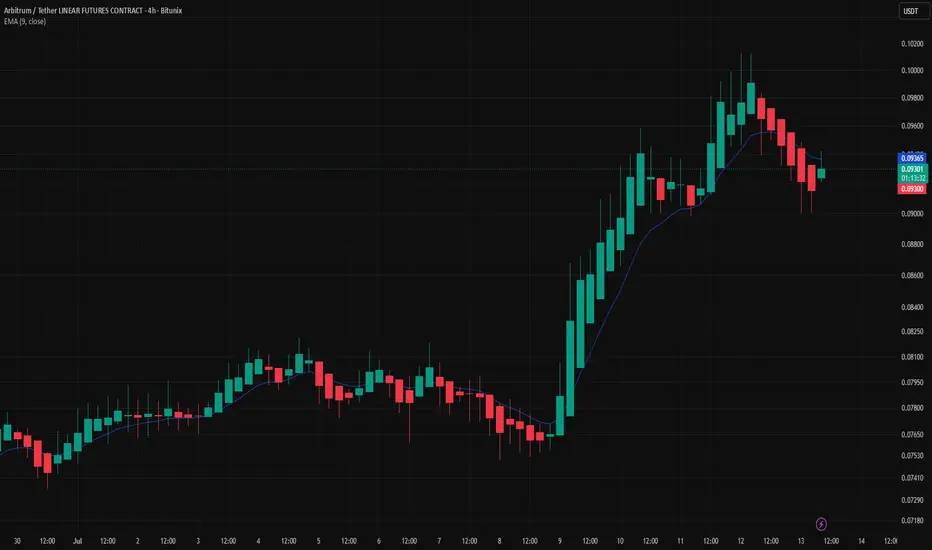
ARBUSDT: Strong Trend, Weak Risk-to-Reward | FOX Journal #8The trend is clearly bullish on the 4H chart, but execution is about more than following momentum.
Price has already made an extended move and is now pulling back. At the current level, the available risk-to-reward no longer meets my trading rules.
A good-looking chart does not automatically become a good trade.
For me, preserving capital is just as important as growing it.
No trade is often the best trade.
Discipline above all.
ARB: local squeeze with $0.11 destinationThe Macro Picture ๐บ๏ธ
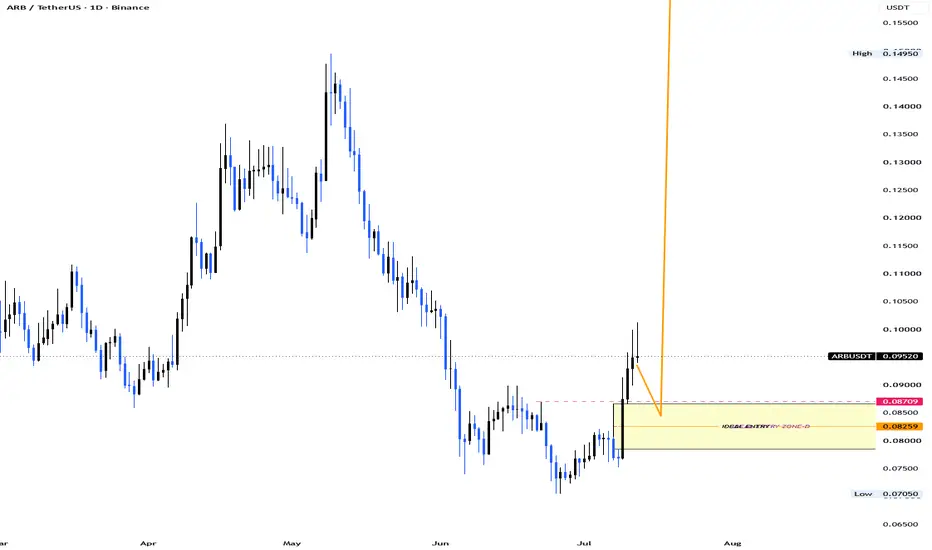
ARB spent two months bleeding from the May $0.15 highs down to $0.072, a descending structure that finally bottomed in early July. What changed the character of the tape is the recovery: price didn't just drift back up, it broke out with conviction, tagging $0.10 on a high-momentum push that dragged RSI from oversold all the way to 65. That kind of impulsive move off a base is how downtrends end and reversals begin. Price is now consolidating the breakout at $0.093, and the path of least resistance has flipped in favor of the bulls.
The Setup โ๏ธ
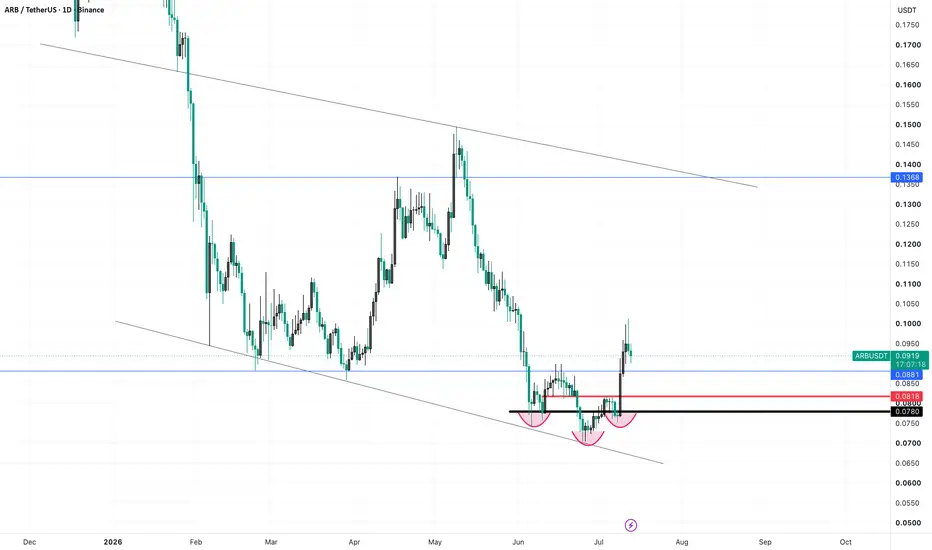
The Support Flip: The $0.078 shelf that capped the base has now flipped into support. As marked on the chart, price is holding above it, and this level is the pivot the whole bullish case rests on.
The Reaction: The initial breakout to $0.10 met sellers, which is normal โ the first tag of resistance rarely breaks clean. The shallow pullback to $0.093 shows buyers are defending the move rather than abandoning it.
The Ceiling: The $0.10 decision line is the trigger. A clean reclaim confirms the breakout and opens the path directly toward the $0.11 macro resistance above.
The Roadmap: Primary target sits at $0.11 โ the green roadmap points there as momentum carries price out of the base. Invalidation: a clean daily close below $0.072 would invalidate this bullish thesis and signal the breakout was a trap.
More setups in profile.
#ARB #CRYPTO #Arbitrum #Layer2 #TechnicalAnalysis
ZONE 0.1368 0.0881 IS VITAL FOR $ARBUSDT #ARB #ARBUSDT ZONE 0.1368 0.0881 IS VITAL FOR BINANCE:ARBUSDT #ARB #ARBUSDT
NEWS FOR AMEX:ARB :
Along with the news coming up for AMEX:ARB this week :
1. US Retail Sales
2. AMEX:ARB ย Unlock ($8.87M) what do you think will happen ?? Comment your opinion or analysis ..
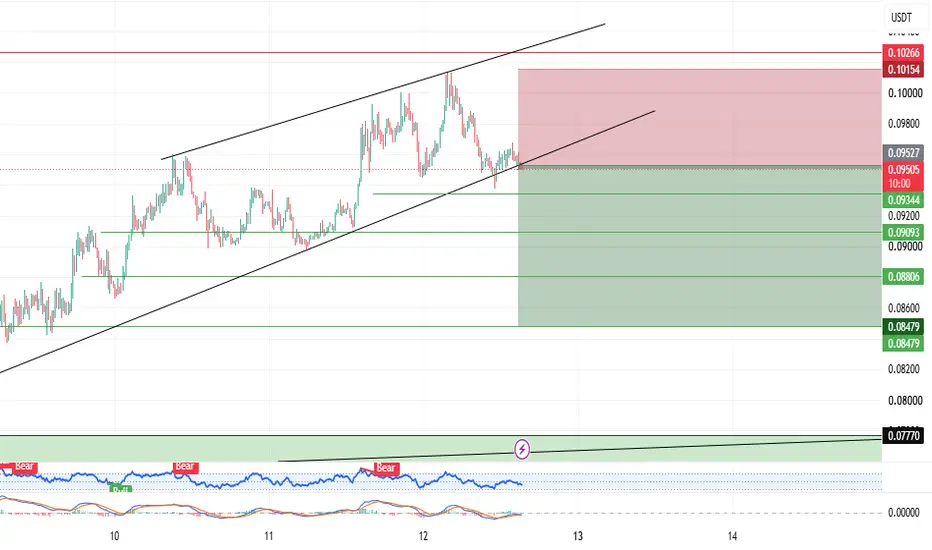
ARB USDT SHORT SIGNAL#56. ARB/USDT โ Trade Setup (SHORT)
๐ Position Type: SHORT
๐ Timeframe: 1 H
๐ Market: Futures
๐ฐ Entry Zone:
0.09528
0.09870
๐ Stop-Loss:
0.10165
๐ฏ Take-Profit Targets:
โข TP1:ย 0.09344
โข TP2:ย 0.09095
โข TP3:ย 0.08801
โข TP4:ย 0.08481
TP5:ย
TP6:ย
โ๏ธ Leverage:
5-
โ ๏ธ After reaching TP1, move Stop-Loss to Entry Price.
๐ Risk Management:
Risk only 1โ2% of your capital per trade.
Always confirm the setup on your chart before entry
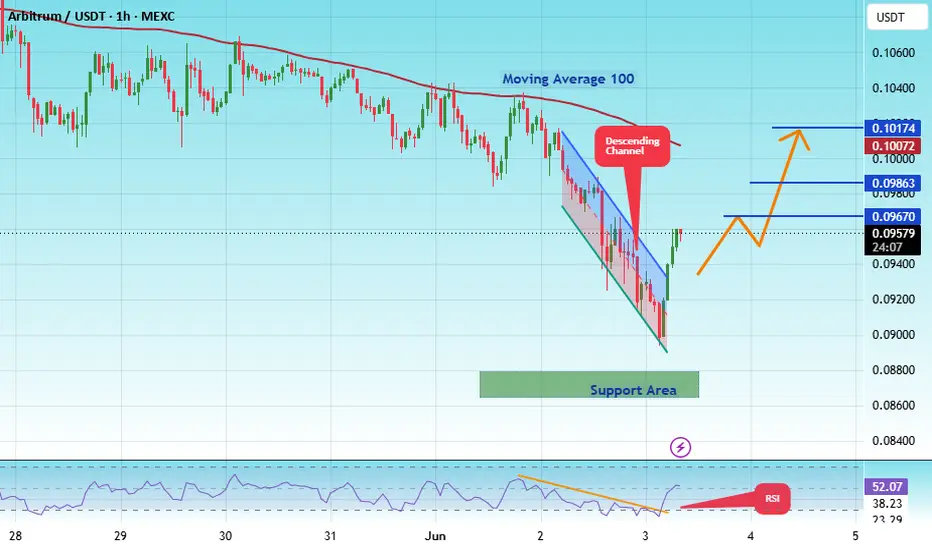
#ARBUSDT | Testing Wedge Breakout Amid Key Support#ARB
The price is moving within a descending channel on the 1-hour timeframe and has reached the lower boundary. It is now poised for a bounce and is expected to retest this boundary.
The Relative Strength Index (RSI) indicates a downward trend, which is likely to continue given the overbought conditions.
There is a key support zone (in green) at 0.08654. The price has bounced off this zone several times, making it a strong support level.
The price is trending towards the 100-period moving average, which we are approaching. This trend supports an upward move.
Entry Price: 0.09540
First Target: 0.09670
Second Target: 0.09860
Third Target: 0.1017
You can stop at the first and second targets and close the price, or continue towards the third target. Stop Loss: At the resistance zone (in green).
Remember this simple rule: Money Management.
Any questions? Please leave a comment.
Thank you.
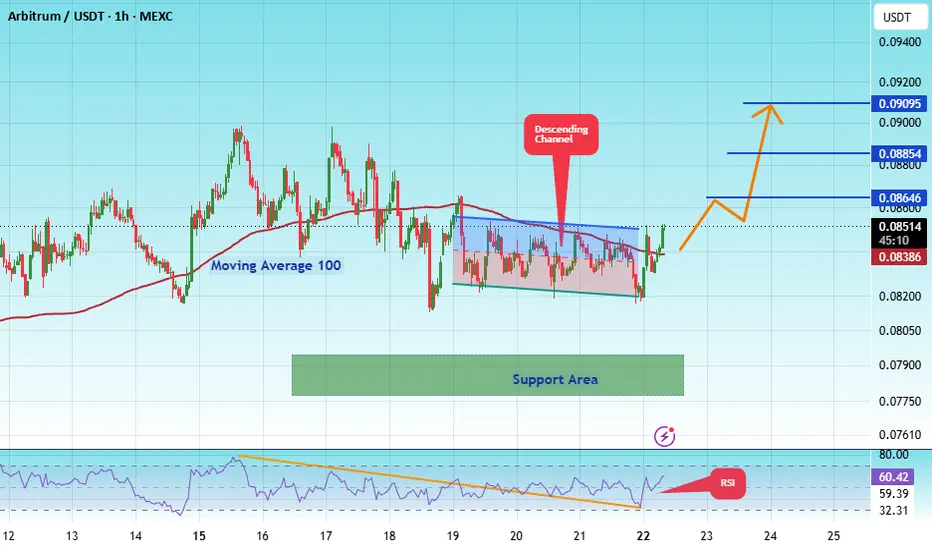
#ARBUSDT | Testing Wedge Breakout Amid Key Support#ARB
The price is moving within a descending channel on the 1-hour timeframe and has reached the lower boundary. It is now poised for a bounce and is expected to retest this boundary.
The Relative Strength Index (RSI) indicates a downward trend, which is likely to continue given the overbought conditions.
There is a key support zone in green at 0.07800. The price has bounced off this zone several times, making it a strong support level.
The price is trending towards the 100-period moving average, which we are approaching. This trend supports an upward move.
Entry Price: 0.08400
Target 1: 0.08646
Target 2: 0.08854
Target 3: 0.09095
Stop Loss: At the resistance zone in green
Remember this simple rule: Money management.
Any questions? Please leave a comment.
Thank you.
ARBUSDT - Descending TrendLine! Breakout or Another Fakeout?๐ Technical Analysis
๐ต Coin: AMEX:ARB #ARB
โณ Time Frame: 3D
๐ Pattern: ๐ป Descending TrendLine (Major Downtrend Resistance)
---
๐ Chart Analysis ๐ง
๐ป ARBUSDT remains in a medium- to long-term downtrend, clearly defined by a well-established Descending TrendLine extending from the previous major high. This trendline has acted as a strong resistance multiple times, making it a highly significant technical level. ๐ช
๐ Price is now climbing and approaching this major resistance, placing ARB at a critical decision zone. The next move could determine whether the market is ready for a bullish trend reversal or another continuation of the bearish trend. โ๏ธ
๐ฐ The recent recovery suggests that buyers are gradually regaining momentum. However, as long as the price remains below the Descending TrendLine, the overall market structure is still considered bearish. ๐ป
---
๐ Pattern Explanation: Descending TrendLine ๐
A ๐ป Descending TrendLine is a dynamic resistance line connecting a series of Lower Highs, indicating that sellers continue to dominate the market.
โจ Key Characteristics:
๐ป Reflects strong selling pressure and bearish market sentiment.
๐ Every rally tends to be rejected near the trendline resistance.
๐ A confirmed breakout often signals the beginning of a trend reversal.
๐ The longer the trendline remains valid and the more times it is respected, the stronger the potential move once a breakout finally occurs.
๐ก In this chart, the trendline has remained intact for several months, meaning a confirmed breakout could trigger a significant price expansion.
---
๐ข Bullish Scenario ๐
โ
The bullish outlook strengthens if ARB successfully breaks above the Descending TrendLine and closes above it, supported by a noticeable increase in trading volume. ๐๐ฅ
If the breakout is confirmed, the next upside targets are:
๐ฏ Target 1: 0.1150 USDT
๐ฏ Target 2: 0.1430 USDT
๐ฏ Target 3: 0.1850 USDT
๐ฏ Target 4: 0.2220 USDT
๐ช The stronger the breakout volume, the greater the probability that ARB will continue its rally toward these resistance levels.
---
๐ด Bearish Scenario ๐
โ If the price is rejected once again at the Descending TrendLine, sellers will likely remain in control.
In this scenario:
โ ๏ธ A fakeout becomes a possibility.
๐ The downtrend may continue.
๐ก๏ธ The previous swing low could be revisited as the next key support level.
๐จ Until a confirmed breakout occurs, traders should remain cautious of continued selling pressure.
---
๐ Conclusion ๐
โ๏ธ ARBUSDT is currently trading in a major decision zone.
๐ฅ The Descending TrendLine remains the most critical resistance that must be broken to shift the market structure from bearish to bullish.
โณ Until a breakout is confirmed, traders should stay cautious of potential rejection.
๐ However, if buyers manage to break above the trendline with strong volume confirmation, ARB could open the door for a sustained rally toward the marked resistance levels.
#ARB #ARBUSDT #Arbitrum #Crypto ๐ #Cryptocurrency #Altcoins #TechnicalAnalysis ๐ #TradingView #PriceAction #DescendingTrendLine #Breakout #TrendReversal #Bullish ๐ข #Bearish ๐ด #Support #Resistance #Trendline #Binance #CryptoTrading #ChartAnalysis #SwingTrading #MarketAnalysis #DYOR
ARB STRONG CATALYST REVERSALAMEX:ARB is surging after Robinhood Chain gained early traction
Robinhood launched using Arbitrum tech, joining the Arbitrum stack (Orbit).
Massive win for Arbitrum from technical, reputational, and BD perspective but also from liquidity via Orbit
Robinhood Chain 8% on chain revenue goes to Arbitrum DAO treasury
A strong catalyst for the ecosystem
ARB USDT SHORT SIGNAL#38. ARB/USDT โ Trade Setup (SHORT)
๐ Position Type: SHORT
๐ Timeframe: 1 H
๐ Market: Futures
๐ฐ Entry Zone:
0.09346
0.098
๐ Stop-Loss:
0.10
๐ฏ Take-Profit Targets:
โข TP1:ย 0.09047
โข TP2:ย 0.08773
โข TP3:ย 0.08498
โข TP4:ย 0.08188
TP5:ย
TP6:ย
โ๏ธ Leverage:
5- 3
โ ๏ธ After reaching TP1, move Stop-Loss to Entry Price.
๐ Risk Management:
Risk only 1โ2% of your capital per trade.
Always confirm the setup on your chart before entry
ARBUSDT 1D#ARB is moving inside a falling wedge pattern on the daily chart. In case of a breakout above the wedge resistance and the Ichimoku cloud, the potential upside targets are:
๐ฏ $0.1079
๐ฏ $0.1296
๐ฏ $0.1472
๐ฏ $0.1647
๐ฏ $0.1896
๐ฏ $0.2214
โ ๏ธ Always remember to use a tight stop-loss and maintain proper risk management.
ARBUSDT โ Breakout to New Highs or Breakdown Toward Key Support?On the 4-hour timeframe, ARB/USDT continues to trade within a well-defined Ascending Channel that has been developing since the previous bottom. This pattern indicates that the Higher Low (HL) and Higher High (HH) market structure remains intact, suggesting that the short-term trend is still bullish. ๐ข
However, the price has recently moved into the middle-to-lower section of the channel, indicating that bullish momentum is beginning to slow and the market is entering a critical decision zone. โ๏ธ
The chart also shows several rejections near the upper channel resistance, suggesting that sellers are still active at higher levels. As long as the price remains above the main ascending support trendline, the potential for another upward move remains valid. ๐
---
๐๐ Pattern Overview: Ascending Channel ๐
An Ascending Channel is a bullish continuation pattern where price moves between two upward-sloping parallel trendlines.
โจ Key Characteristics on This Chart:
โ
Higher Lows continue to form consistently.
โ
Higher Highs remain intact.
โ
Dynamic support is provided by the lower channel trendline (red line). ๐ด
โ
Dynamic resistance is located at the upper channel trendline (yellow line). ๐ก
โ
The current price is trading around the middle of the channel, meaning the next move could develop toward either side. ๐
As long as the price remains inside the channel, the overall bullish structure is considered valid. ๐ช
---
๐ข๐ Bullish Scenario
The bullish outlook becomes stronger if:
โ
Price successfully holds above the Ascending Channel support trendline.
โ
A strong bounce occurs from the support area with increasing trading volume. ๐
โ
Price breaks above the upper channel resistance with a strong candle close. ๐ฅ
If this breakout is confirmed, ARB could continue its uptrend and establish a new Higher High, opening the door for further bullish momentum. ๐๐
Volume confirmation will be essential to reduce the risk of a false breakout. โ ๏ธ
---
๐ด๐ Bearish Scenario
The bearish scenario becomes more likely if:
โ Price loses the Ascending Channel support.
โ A 4H candle closes below the primary support trendline.
โ The breakdown is accompanied by increased selling volume. ๐
If a confirmed breakdown occurs, the price could retrace toward the key horizontal support levels marked on the chart:
๐ฏ 0.0770
๐ฏ 0.0743
๐ฏ 0.0730
๐ฏ 0.0715
๐ฏ 0.0705 (Major Support) ๐ก๏ธ
If 0.0705 fails to hold, selling pressure could intensify and shift the short-term market structure from bullish to bearish. ๐
---
๐๐ Conclusion
Overall, ARB/USDT continues to maintain a bullish market structure as long as the price remains inside the Ascending Channel. ๐ข๐
However, with the price currently trading near channel support, this area represents a crucial decision point that traders should monitor closely. ๐
โ
As long as the channel support holds, the probability favors another bullish continuation.
โ ๏ธ On the other hand, a confirmed breakdown below the channel would increase the likelihood of a deeper correction toward the support levels below.
Traders should wait for a confirmed breakout or breakdown, while using trading volume as the primary confirmation before entering a position. ๐๐ก
---
โ ๏ธ๐ข Disclaimer
This analysis is based solely on Price Action and Technical Analysis and should not be considered financial advice. Always conduct your own research (DYOR โ Do Your Own Research) ๐ง and apply proper risk management ๐ก๏ธ before making any trading decisions.
---
#ARB #ARBUSDT #Arbitrum #Crypto ๐ #Cryptocurrency #TechnicalAnalysis ๐ #TradingView #PriceAction #AscendingChannel ๐ #Bullish ๐ข #Bearish ๐ด #Support #Resistance #Breakout #Breakdown #Altcoin #CryptoTrading #Binance #DYOR #RiskManagement
ARB at macro floor: reaction toward $0.088The Macro Picture ๐บ๏ธ
ARB has been grinding down the entire quarter, sliding from the $0.15 May high through a descending structure that finally bottomed on the $0.069 macro floor in late June. That kind of extended flush is what clears out the last of the over-leveraged longs before a floor can spark a reaction. Price is now basing just above the floor at $0.076, and RSI has lifted out of oversold โ the first sign momentum is trying to turn after weeks of one-way selling.
The Setup โ๏ธ
The Reaction: The $0.069 macro floor caught the flush and price has reclaimed higher ground at $0.076, printing the first stack of demand candles of the down-leg. Bulls are defending the floor, and while $0.069 holds on a closing basis the immediate pressure is a rotation back toward the supply overhead.
The Accumulation Zone: The $0.069โ$0.073 pocket resting on the macro floor is the structurally honest place to build exposure in layers rather than in one entry โ the floor has absorbed every test so far, and staggered, averaging-based entries fit how a base like this gets carved out.
The Roadmap: Primary target sits at $0.088 โ the red supply zone and the lower high that capped June's bounce, where the green roadmap points once the $0.08 decision level flips to support and the buy stops above it trigger. Invalidation: a sustained 1D close below $0.069 would invalidate this bullish reaction and open a breakdown toward $0.066 and the open air beneath the floor.
Satoshi Frame | ARB Holds 0.0714$ Low, Eyes 0.0774$ Breakout๐ฆ Welcome Yo SatoshiFrame Tradingview Channel.
โณ๏ธ Lets dive into a Arbitrum analysis.
๐ Arbitrum has formed a daily low at 0.0714$ with support from market buyers, and is now showing a reaction toward the 0.0774$ resistance with some increase in buying volume.
๐ If price drops from here and sellers manage to break the 0.0714$ low, price could move down to the next market buyer levels.
๐ฆด If buyers manage to break the 0.0774$ resistance, the chance of breaking the 0.0817$ resistance increases.
๐งฎ The RSI oscillator is currently below the overbought level of 57.98, and also has an oversold level around 42.
โ ๏ธ Risk management and capital management are essential in trading. Always trade based on your own strategy and risk tolerance. Every trading decision and its outcome are entirely your own responsibility.
ARB: bearish breakdown toward $0.06500The Macro Picture ๐บ๏ธ
ARB is still trapped inside the broad macro range beneath the $0.15000 ceiling, but the character of the last two weeks has shifted from recovery to distribution. The mid-June bounce off the $0.07350 floor never had the strength to reclaim the $0.09500 Local High โ it stalled into supply and has spent the back half of the month coiling in a tight range just above the floor. When a bounce fails to take back the level that broke it and instead grinds sideways on fading momentum, the path of least resistance points down, not up.
The Setup โ๏ธ
The Rejection: The relief attempt was capped at the $0.09000โ$0.09500 supply band โ the same zone that triggered the original breakdown โ confirming sellers are still defending overhead and the reclaim thesis has failed.
The Distribution: Price has been pinned in a narrow range above $0.07350 while the RSI rolls back over from its mid-range bounce. This is the textbook coil of a market building orders for the next leg, not basing for a reversal.
The Trigger: The $0.07350 Macro Floor is the line in the sand. A clean 1D close below it breaks the multi-month range low, triggers the sell stops stacked beneath the most-tested support on the chart, and opens the untested liquidity pocket below.
The Roadmap: Primary target sits at $0.06500, as indicated by the white projection โ the first pocket of air once the floor gives way and trapped longs are flushed. Invalidation: a sustained 1D close back above $0.09500 would invalidate this bearish thesis and put the failed-reclaim scenario back in play.
ARB 8H โ Trendline Bounce Into Descending ResistanceARB on the 8H timeframe is currently trading around 0.0890 after a prolonged sell-off from the May highs near 0.1500 that pushed price all the way to a low near 0.0745 before the rising trendline from the June lows stepped in and produced a recovery.
Price has since bounced from the trendline and is now pressing toward the 0.0860โ0.0890 horizontal resistance zone while the descending resistance trendline from the May highs continues to press down from above, now sitting near 0.0980โ0.1000.
The structure remains bearish overall but the trendline bounce is the first sign of potential stabilization.
Key Levels To Watch
0.1500 โ Prior high, major resistance above
0.1100โ0.1150 โ Prior support zone, now resistance
0.0980โ0.1000 โ Descending resistance trendline, overhead ceiling
0.0860โ0.0890 โ Horizontal resistance, current test
0.0820โ0.0840 โ Minor support, prior consolidation zone
0.0780 โ Rising trendline support (dynamic, climbing)
Below 0.0745 โ Trendline low, new lows if lost
The rising trendline has provided the first meaningful floor since the May sell-off began and the current push toward 0.0860โ0.0890 is the first real resistance test of the recovery.
A clean break and hold above 0.0890 would open room toward the descending resistance trendline near 0.0980โ0.1000, which is the key level that must be cleared for any structural shift.
Failure to hold above 0.0860 and a return toward the rising trendline near 0.0780 would keep the bearish structure intact.
This is a key first resistance test after the trendline bounce.
Break above 0.0890 โ recovery continues, eyes on 0.0980โ0.1000.
Reject at 0.0890 โ back toward trendline at 0.0780.
Bearish dominant below descending resistance.
Structure only shifts on confirmed break above 0.0980โ0.1000.
#ARBUSDT | Testing Wedge Breakout Amid Key Support#ARB
The price is moving within a descending channel on the 1-hour timeframe and has reached the lower boundary. It is now poised for a bounce and is expected to retest this boundary.
The Relative Strength Index (RSI) indicates a downward trend, which is likely to continue given the overbought conditions.
There is a key support zone (in green) at 0.07390. The price has bounced off this zone several times, making it a strong support level.
The price is trending towards the 100-period moving average, which we are approaching. This trend supports an upward move.
Entry Price: 0.08000
Target 1: 0.08200
Target 2: 0.08540
Target 3: 0.08920
Stop Loss: At the resistance zone (in green)
Remember this simple rule: Money management.
Any questions? Please leave a comment.
Thank you.
ARB: bullish reclaim toward $0.10500The Macro Picture ๐บ๏ธ
ARB remains locked inside the broad macro range beneath the $0.15000 ceiling that capped price in early May, but the June leg redrew the floor. The obvious low gave way and price was driven into a fresh liquidity pocket, bottoming at $0.07350 โ a deeper sweep than the structure had shown all year, and the kind of flush that clears out over-leveraged longs before the range resolves. Daily RSI printed its most stretched reading since the February capitulation, and price has since lifted off that low rather than rolling over.
The Setup โ๏ธ
The Sweep: The drop to $0.07350 wicked below every prior support and snapped back inside the range โ textbook stop-run behavior at the lower boundary, not a clean structural breakdown.
The Reaction: Momentum has turned up off oversold while price holds the recovery; the same RSI condition marked the base of the April rally, not the middle of a decline.
The Reclaim: The first real test is the $0.09500 Local High โ the level that capped the breakdown candle. A daily close back above it flips the recent supply into support and confirms the bulls are defending the reclaimed floor.
The Roadmap: Primary target sits at $0.10500 โ the Macro Decision Zone where the prior break level and trapped breakout sellers converge, making it the natural magnet for the relief leg once $0.09500 is reclaimed. Invalidation: a clean 1D close back below $0.07350 would invalidate this bullish thesis and reopen the path of least resistance into the lower pocket.
ARB USDT LONG SIGNALARB /USDT โ Trade Setup (long)
๐ Position Type: LONG
๐ Timeframe: 15M
๐ Market: Futures
๐ฐ Entry Zone:
0.0784
0.0758
๐ Stop-Loss:
0.0735
๐ฏ Take-Profit Targets:
โข TP1:ย 0.0811
โข TP2:ย 0.0859
โข TP3:ย 0.0903
โข TP4:ย 0.0937
. TP5:ย
โ๏ธ Leverage:
5โ3
โ ๏ธ After reaching TP1, move Stop-Loss to Entry Price.
๐ Risk Management:
Risk only 1โ2% of your capital per trade.
Always confirm the setup on your chart before entry.