ARKM: local squeeze with $0.1358 destinationThe Macro Picture 🗺️
ARKM has been rotating in a range between the $0.0914 floor and the $0.1654 ceiling. Price has pulled back to $0.1115 and is holding just above the $0.1056 local-low shelf — coiling in the lower half of the range as it sets up the next move.
The Setup ⚙️
The Range Floor 🟢
$0.0914 (Macro Support) is the demand base, with $0.1056 (Local Low) as the nearer shelf. Both have held, and that's the floor this range pivots on.
The Decision Point 🔴
$0.1264 (Local High) is the gate. A daily close above it flips the local structure bullish and opens the path to the $0.1358 measured-move target.
The Roadmap 🛣️
Hold above $0.1056 → break $0.1264 → run toward $0.1358. Invalidation is a clean daily close below $0.0914 — that breaks the range.
This is a GRID Range Play: a defined band to rotate, buying the lower half and scaling out into the breakout.
More setups in profile.
#ARKM #Arkham #crypto #trading #TA #3Commas #GRID
In-depth trading ideas
ARKM Triple Top Rejection Keeps Bears in ControlARKM continues to struggle under its long-term descending resistance after multiple failed attempts to push higher. The recent price structure shows repeated rejections around the same upper region, forming a potential triple top and highlighting strong seller presence.
Price is now compressing near the 0.1056 support area, while the descending trendline continues to pressure the structure from above. A clean breakdown below this support could confirm bearish continuation and expose lower levels inside the broader descending structure.
However, reclaiming 0.1237 would weaken the immediate bearish pressure, while 0.1556 remains the key level bulls need to break before any meaningful trend reversal can be considered.
Key Levels
🟢 Support: 0.1056 → 0.0850
🔴 Resistance: 0.1132 → 0.1237 → 0.1556
📉 Bias: Bearish while price remains below the descending resistance.
⚠️ A confirmed loss of 0.1056 could trigger the next downside expansion.
TradeCityPro | ARKMUSDT Spot Buy Opportunity🚀 Analysis of ARKMUSDT | Spot Buy Opportunity
Let's take a look at Arkham, the largest on-chain transaction analytics platform, which has recently launched its own centralized exchange and continues expanding its ecosystem.
🌟 Weekly Updates:
Starting from Monday to Wednesday, we'll cover:
• Monday: Bitcoin & Dominance Analysis
• Tuesday: Ethereum & ETH/BTC Analysis
• Wednesday: Gold Analysis
These are in addition to our daily analyses.
🎉 Channel Milestone 800 Followers:
Thank you all for helping this channel reach 800 followers! Our next goal is 1,000 followers. Let's keep growing together!
🪙 Project Overview:
Arkham is one of the leading on-chain intelligence platforms, allowing users to track wallet activity, identify major market participants, and analyze blockchain transactions in real time.
Recently, the project has also launched its own centralized exchange, adding another utility to the ecosystem and increasing its long-term growth potential.
📅 Weekly Time Frame:
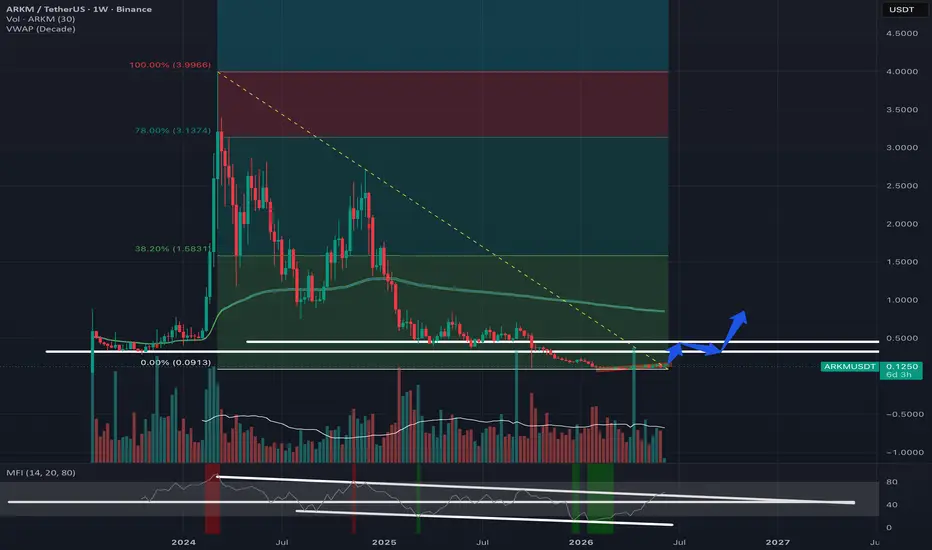
After experiencing a 97% correction from its all-time high—similar to the majority of altcoins—we've finally reached a major long-term support area.
Following the decline, price has been ranging for the past 21 weeks between 0.0914 and 0.1463.
A breakout above the upper boundary of this range could confirm that this entire structure has been an accumulation zone.
🎯 Long & Spot Strategy:
For long positions, lower time frames can provide more precise entry opportunities.
For spot investors, an aggressive entry can be considered after a confirmed breakout above 0.1463.
🛡️ Stop Loss Strategy:
A higher-risk stop loss can be placed below the breakout candle, provided the breakout candle is strong, shows clear buyer dominance, and successfully absorbs selling pressure.
🔑 Key Support and Resistance Levels:
Supports:
• 0.0914
Resistances:
• 0.1463
📝 Final Thoughts
Stay calm, trade wisely, and let's capture the market's best opportunities!
This analysis reflects our opinions and is not financial advice.
Share your thoughts in the comments, and don’t forget to share this analysis with your friends!
ARKMUSDT — Long-Term Compression With Major Recovery PotentialARKMUSDT — Long-Term Compression With Major Recovery Potential 🚀
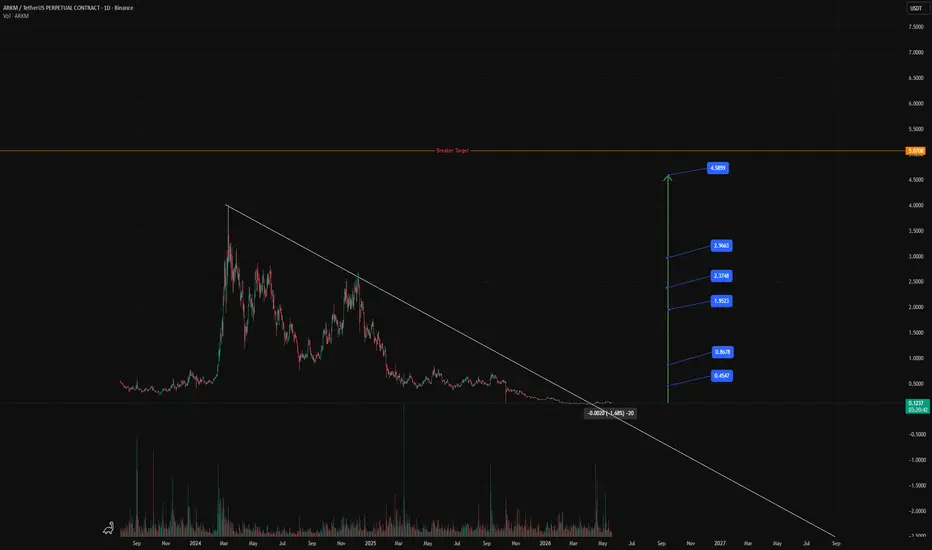
ARKMUSDT has spent an extended period trading inside a strong macro downtrend, consistently respecting a descending resistance trendline while printing lower highs and lower lows. After aggressive sell pressure and prolonged weakness, price is now approaching a key compression phase near historical lows.
The structure suggests a potential bottoming process where downside momentum is gradually fading while risk-to-reward becomes increasingly attractive for a possible recovery play.
Why This Setup Is Interesting
• Price has respected a long-term descending resistance structure for months.
• Selling momentum appears exhausted after prolonged downside expansion.
• The market is consolidating near lows, often an early sign of accumulation.
• Compression near support increases the probability of a strong breakout move.
• Current positioning offers an attractive asymmetric risk-to-reward opportunity.
Technical Structure Analysis
📉 Macro Descending Trendline
The major trendline continues to define the bearish market structure. Every major rally has failed near resistance, making a breakout above this zone highly important for confirming trend reversal.
📍 Historical Base Formation
Price is currently stabilizing near an important low-value region. Long consolidations after heavy sell-offs frequently indicate accumulation before expansion.
⚡ Momentum Exhaustion
The steep decline has transitioned into sideways compression, showing reduced volatility and weakening bearish pressure. Markets often transition from expansion → compression → breakout.
📈 Breakout Confirmation
A clean reclaim of descending resistance would confirm structural recovery and potentially trigger stronger momentum toward higher resistance zones.
Target Levels
🎯 TP1 — 0.4547
First recovery objective and initial resistance reclaim. A move here would confirm early bullish momentum.
🎯 TP2 — 0.8678
Major resistance zone where volatility and profit-taking may increase.
🎯 TP3 — 1.9523
Strong higher timeframe resistance level and confirmation of a larger recovery structure.
🎯 TP4 — 2.3748
Intermediate breakout target aligned with previous market reaction zones.
🎯 TP5 — 2.9663
Key expansion level showing sustained bullish continuation.
🎯 TP6 — 4.5859
Macro breaker target and full recovery projection if momentum accelerates aggressively.
Risk Management
🛑 Invalidation Zone:
A sustained breakdown below the current accumulation/support area would invalidate the bullish thesis and increase the probability of continuation downside.
This setup remains attractive because:
• Limited downside exposure near lows
• Strong long-term compression structure
• High upside potential versus current risk
• Multiple resistance targets for scaling profits
Summary
ARKMUSDT is currently trading at a critical stage where prolonged bearish momentum appears to be slowing. The market has compressed near historical lows while respecting a long-term descending resistance trendline.
If buyers successfully reclaim the descending structure, ARKM could transition from accumulation into a strong recovery phase with upside potential toward multiple higher timeframe targets, including the marked breaker zone.
Patience is important here — confirmation above resistance matters more than anticipation.
Trade safe and manage risk properly.
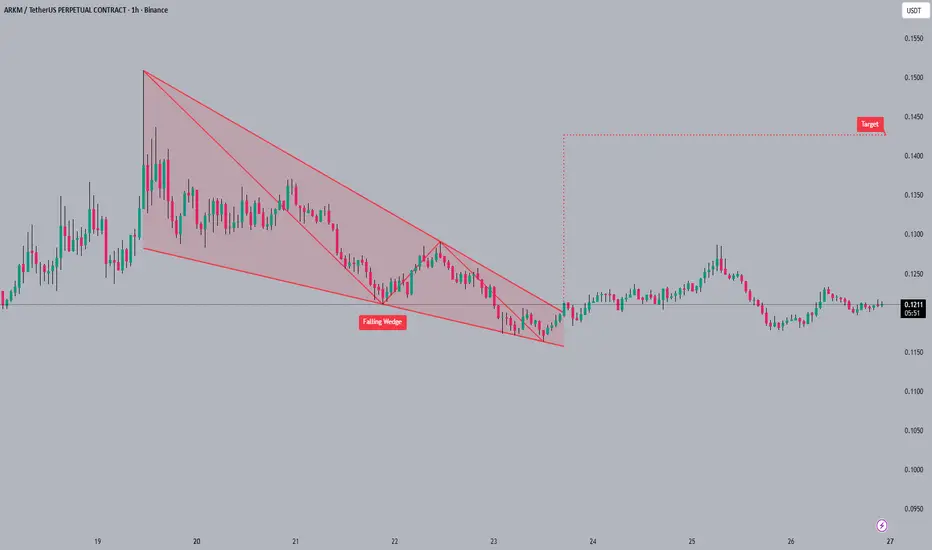
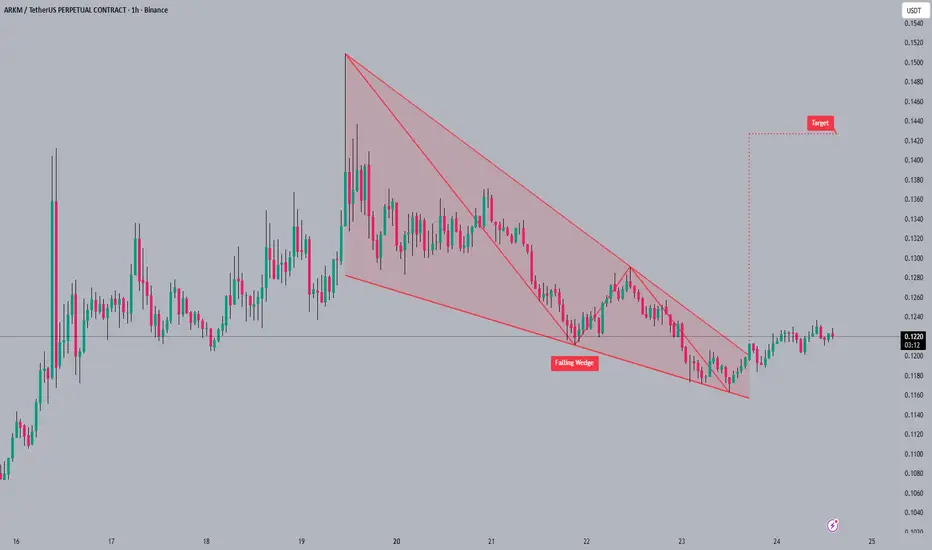
#ARKM#ARKM has broken out from its falling wedge pattern 📈 and is now consolidating above the resistance. A clear target for this bullish move is indicated around the 0.1420 level 🎯. Recognizing chart patterns helps anticipate trend shifts and market sentiment 🧠.
#ARKM #altcoin #chartpatterns #cryptotrading
ARKMUSDT Forming Bullish MomentumARKMUSDT is forming a clear bullish momentum pattern, a classic bullish reversal signal that often indicates an upcoming breakout. The price has been consolidating within a narrowing range, suggesting that selling pressure is weakening while buyers are beginning to regain control. With consistent volume confirming accumulation at lower levels, the setup hints at a potential bullish breakout soon. The projected move could lead to an impressive gain of around 140% to 150% once the price breaks above the wedge resistance.
This bullish momentum pattern is typically seen at the end of downtrends or corrective phases, and it represents a potential shift in market sentiment from bearish to bullish. Traders closely watching ARKMUSDT are noting the strengthening momentum as it nears a breakout zone. The good trading volume adds confidence to this pattern, showing that market participants are positioning early in anticipation of a reversal.
Investors’ growing interest in ARKMUSDT reflects rising confidence in the project’s long-term fundamentals and current technical strength. If the breakout confirms with sustained volume, this could mark the start of a fresh bullish leg. Traders might find this a valuable setup for medium-term gains, especially as the pattern completes and buying momentum accelerates.
✅ Show your support by hitting the like button and
✅ Leaving a comment below! (What is your opinion about this Coin?)
Your feedback and engagement keep me inspired to share more insightful market analysis with you!
ARKMUSDT – Start of a Reversal or Just a Relief Rally?On the 1D timeframe, ARKM/USDT is moving within a clear Descending Channel pattern since the distribution phase at the top.
The resistance line (red) consistently forms lower highs
The support line (yellow) forms lower lows
Price respects the channel structure → indicating a structured bearish trend
However, currently price is starting to:
Approach the upper channel area
Form an impulsive move upward from the low (~0.09)
Potentially attempt a breakout from the bearish structure
---
📐 Pattern: Descending Channel
A Descending Channel is typically:
Considered a bullish reversal pattern if a breakout to the upside occurs
But while price remains inside the channel → still treated as a bearish continuation
📌 Key characteristics:
Consistent lower highs & lower lows
Volume usually declines during channel formation
Breakouts are often followed by strong impulses
---
🚀 Bullish Scenario
Bullish confirmation occurs if:
✅ Price breaks and closes above the channel resistance (red line)
✅ A successful retest confirms new support from previous resistance
Upside targets (based on horizontal levels in the chart):
0.1650
0.1800
0.1970
0.2250
📈 If momentum strengthens:
Potential continuation toward mid-term resistance levels
🔥 Narrative: A breakout from a descending channel often signals the beginning of a major trend reversal, especially when supported by volume and the formation of higher lows.
---
⚠️ Bearish Scenario
Bearish outlook remains valid if:
❌ Price fails to break out and gets rejected at channel resistance
❌ Strong rejection occurs at the red trendline
Downside potential:
Return to mid-channel
Retest of lower support (~0.09)
Possible breakdown → continuation of the broader downtrend
📉 Narrative: As long as price remains inside the channel, the overall structure is still bearish.
---
📌 Conclusion
ARKM is currently at a critical decision zone
Breakout = potential reversal
Rejection = bearish continuation
📊 This is a key moment: Traders should wait for clear breakout or rejection confirmation, rather than entering speculative positions near resistance.
#ARKM #ARKMUSDT #CryptoAnalysis #TechnicalAnalysis #Altcoin #Breakout #DescendingChannel #BullishSetup #BearishScenario #CryptoTrading #PriceAction #Altcoins2026
ARKMUSDT 1D#ARKM has broken above the descending resistance and the SMA50 on the daily chart. Consider buying a small bag here and adding on the retest of the broken trendline. The targets are:
🎯 $0.1411
🎯 $0.1709
🎯 $0.1950
🎯 $0.2191
🎯 $0.2533
🎯 $0.2970
⚠️ Always remember to use a tight stop-loss and maintain proper risk management.
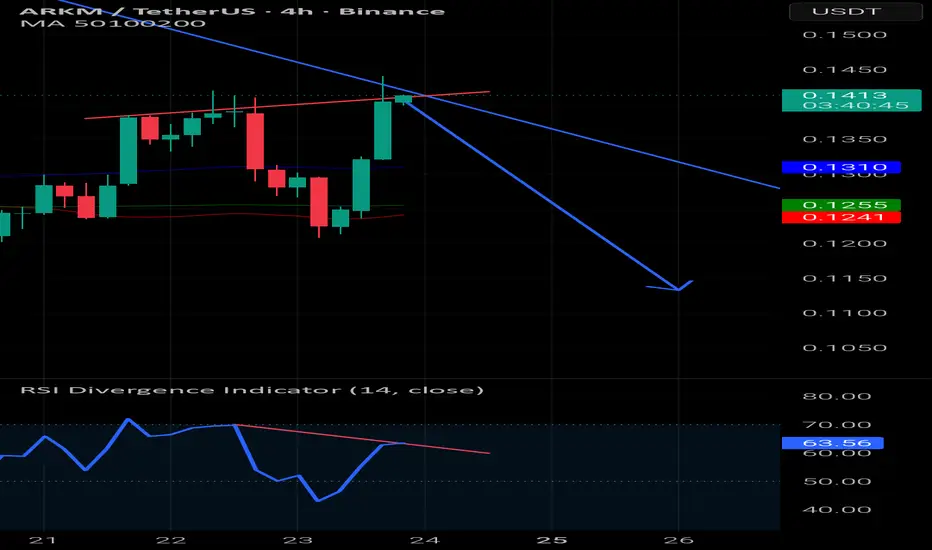
ARKM Approaching Broadening Wedge Target – Reversal Zone AheadARKM is currently developing a descending broadening formation, with price gradually approaching the lower boundary of the structure and the projected bearish target. The immediate resistance level remains the key area to watch. Any rejection from this level could push price further toward the downside target highlighted on the chart.
If price reaches the target zone, strong accumulation interest may emerge, potentially triggering a bullish reversal toward the $0.775 region as illustrated. For now, the focus remains on resistance reaction and price behavior near the projected target zone.
ARKM/USDT — Bearish Continuation Below Key Channel ResistanceARKM/USDT on the daily timeframe (1D) remains in a strong and well-structured downtrend. Since printing the peak around the 0.71 area, price has consistently formed lower highs and lower lows, confirming sustained selling pressure.
The current price movement is not an accumulation phase, but rather a bearish continuation within a valid descending channel. As long as price stays below the channel resistance, the bearish structure remains intact.
---
Price Structure & Pattern Formation
1. Descending Channel (Bearish Continuation Pattern)
Price is moving cleanly within a descending channel (red line as resistance and yellow line as support).
Every rebound has failed to break above the upper channel, indicating active sellers at resistance.
The channel remains valid and respected, with no structural breakout so far.
2. Valid Lower High – Lower Low Structure
A clear sequence of lower highs can be observed from 0.71 → 0.56 → 0.42 → 0.29 → 0.22.
Lower lows continue down to the 0.114 area, reinforcing bearish dominance.
3. Channel Midline as Dynamic Resistance
The channel midline (green dashed line) has repeatedly acted as minor resistance.
Price consistently fails to hold above this midline, signaling weak buyer strength.
---
Key Support & Resistance Zones (Based on Chart)
Layered Resistance:
0.225 – 0.255 (minor resistance & pullback area), 0.290, 0.363, 0.420, 0.560, 0.667 – 0.712 (major supply zone)
Critical Support:
0.173 (current minor support), 0.145, 0.114 (major low / extreme low)
---
Bullish Scenario (Technical Rebound Only)
The bullish scenario remains counter-trend, not a major trend reversal.
Bullish confirmation requires:
A daily close above the upper channel resistance.
A successful reclaim of the 0.225 – 0.255 area as support.
A structural shift from lower high to higher high.
Potential upside targets after a valid breakout:
0.290
0.363
0.420
Without a channel breakout, any upside move should be treated as a technical rebound / dead cat bounce.
---
Bearish Scenario (Primary Scenario)
The bearish scenario remains the dominant and most logical outlook.
Bearish continuation is confirmed if:
Price is rejected again at channel resistance.
A breakdown occurs below the 0.173 support level.
Downside targets:
0.145
0.114 (previous low)
A breakdown below 0.114 opens the door for a new lower low.
As long as price remains inside the descending channel, bearish trend continuation remains valid.
---
Conclusion
ARKM/USDT is still in a distribution phase and bearish continuation structure. The clearly defined descending channel confirms full seller control. There is no valid major reversal signal unless price breaks and holds above the channel structure.
Traders should:
Avoid bullish bias without a confirmed breakout.
Treat all rallies as pullbacks until proven otherwise.
#ARKM #ARKMUSDT #CryptoAnalysis #TechnicalAnalysis #BearishTrend #DescendingChannel #Downtrend #AltcoinAnalysis #PriceAction
ARKMUSDT 1D#ARKM is moving inside a falling wedge on the daily chart. It may retest the wedge support one more time before the next leg up. In case of a successful bounce from the support and a breakout above the wedge, the potential targets are:
🎯 $0.281
🎯 $0.328
🎯 $0.366
🎯 $0.403
🎯 $0.457
🎯 $0.526
❌ Invalidation: a daily candle closing below the wedge.
⚠️ Always remember to use a tight stop-loss and maintain proper risk management.
ARKM/USDT – Bullish Continuation Pattern with Upside Potential
Date: July 18, 2025
ARKM/USDT is showing renewed bullish momentum after a prolonged accumulation phase. The price has broken out of a tight range and is now pushing above key moving averages with volume support, indicating a potential trend reversal and upside continuation.
📊 Technical Overview:
Current Price: $0.601
EMA Alignment: Price is currently above the 4EMA, 50EMA, and 100EMA, suggesting growing short-term strength. Still trading below the 200EMA (~$0.695), which could act as resistance.
Structure: Strong breakout from a horizontal consolidation range. The pattern resembles an accumulation zone followed by an impulsive move.
📉 Support Zones:
$0.585 (minor support – recent breakout level)
$0.400 (major accumulation base and demand zone)
📈 Resistance/Target Zones:
Immediate Target: $0.749–$0.793 (horizontal resistance from past price action)
Mid-Term Target: $1.328–$1.409 (projected target based on height of the accumulation box)
📊 Indicators:
RSI: 67.84 – bullish momentum increasing, nearing overbought territory but not yet exhausted
Volume: Volume increasing on green candles – confirms buyer interest and breakout legitimacy
🔍 Chart Structure:
Price spent several months inside a wide consolidation box between ~$0.40 and ~$0.75.
The recent breakout from a smaller mini-range inside the larger zone suggests a renewed push toward upper resistance.
The pattern projection points to a possible move back to the $1.30+ zone in the medium term.
🎯 Upside Projections:
Short-Term Target: $0.749–$0.793
Mid-Term Target: $1.328–$1.409
These levels correspond to past structural resistances and measured breakout moves.
📉 Invalidation:
Breakdown below $0.585 would invalidate the short-term bullish setup.
Falling back into the $0.40–$0.50 zone would indicate weakness and likely further consolidation.
ARKM LONG1. Chart Context
Pair: ARKM/USDT
Timeframe: 1h
Current Price: ≈ 0.386 USDT
The market has recently consolidated after a drop and is showing signs of holding support.
2. Trade Setup
This is a long position (expecting price to rise).
The colored box (green/red) represents the Risk/Reward (R:R) setup:
Entry Zone: Around 0.386 USDT (current price sitting at support).
Stop Loss (SL): 0.358 USDT (bottom of the red box).
If price falls below this support zone, the long trade is invalidated.
Take Profit (TP): 0.427 USDT (top of the green box).
Targeting a push back to resistance above 0.42.
3. Risk/Reward Ratio
Risk (SL distance): ~0.028 USDT
Reward (TP distance): ~0.041 USDT
R:R ratio ≈ 1.46:1
A solid setup, with more potential reward than risk.
4. Support & Resistance
Support Zone: 0.36 – 0.37 (highlighted in light grey below the entry).
Price has tested this area and bounced.
Resistance Zone: 0.42 – 0.43 (upper target).
This is where price may stall or reverse.
✅ In summary:
This is a long trade setup on ARKM/USDT, where the trader enters at ~0.386, sets a stop loss below 0.358 (to protect from breakdowns), and targets 0.427. The idea is that the support at 0.36–0.37 will hold and push the price back toward resistance near 0.42+.
ARKM/USDT — Major Reversal Incoming or Final Breakdown?Overview
ARKM is now trading at its most critical level since the explosive rally of 2024.
The latest 5D candle shows a sharp drop followed by a long lower wick, briefly breaking below the $0.375–$0.280 support zone before rebounding — a classic sign of a liquidity sweep and potential buyer absorption at a major demand area.
This yellow zone represents the “last line of defense” for bulls.
If the price holds, a medium-to-long-term reversal could be forming.
However, if this zone breaks with a decisive close below $0.280, ARKM may enter a capitulation phase, signaling further downside risk.
---
Structure & Price Pattern
Since the 2024 peak near $3.996, ARKM has formed a series of lower highs and lower lows, confirming a mid-term downtrend.
Price is currently hovering around the major accumulation base ($0.375–$0.280), the same area that once launched its previous rally.
The long lower wick signals stop-hunting and liquidity collection below key support — often a precursor to reversal when followed by buyer strength.
If price sustains above this zone and starts forming higher lows, a trend reversal could be confirmed.
---
Key Technical Levels
Major Support (yellow zone): $0.375 – $0.280
Next Resistances: $0.616 → $0.730 → $0.894
Major Upside Targets: $1.575 → $2.493 → $3.188
All-Time High: $3.996
Extreme Wick Low (liquidity sweep): $0.050
---
Bullish Scenario
If ARKM holds and closes above $0.375, the $0.280–$0.375 zone could act as a strong demand base.
A clear break and close above $0.616 would confirm the start of a potential trend reversal.
With increasing volume and momentum, targets at $0.894 – $1.575 become achievable.
Bullish Confirmation Signals:
5D candle close above $0.375 with strong rejection wicks below.
Break and close above $0.616 with rising volume.
Structure shift to higher lows.
Bullish Targets:
$0.616 → $0.894 → $1.575 → $2.493
---
Bearish Scenario
If the price breaks below $0.280 and closes beneath it, bearish momentum will likely intensify.
This would indicate that bulls have lost control, opening the door to a deeper correction toward $0.20 – $0.10, or even $0.05 in an extreme capitulation event.
In that case, the $0.375–$0.280 zone could flip into new resistance.
Bearish Confirmation Signals:
5D candle close below $0.280 with no strong rebound.
Failed retest of $0.280–$0.375 as resistance.
Volume spike on sell-side pressure.
Bearish Targets:
$0.20 → $0.10 → $0.05
---
Market Psychology
ARKM’s recent movement perfectly illustrates fear vs. opportunity in the market cycle.
While retail traders panic-sold during the wick breakdown, smart money often takes advantage of such extreme liquidity sweeps to accumulate at discounted levels.
The liquidity flush below $0.280 suggests that weak hands have been shaken out, potentially paving the way for a new impulsive move — whether up or down will depend on how price reacts in the next few candles.
---
Conclusion
The $0.375–$0.280 zone is ARKM’s make-or-break level.
A strong defense here could trigger a large-scale reversal, while a confirmed breakdown would mark the start of another deep correction.
Traders should:
Wait for clear confirmation (breakout or breakdown).
Apply strict risk management due to high volatility.
Focus on volume and candle structure around this zone to gauge market intent.
---
#ARKM #ARKMUSDT #CryptoAnalysis #SupportZone #LiquiditySweep #CryptoTrading #TechnicalAnalysis #MarketStructure #ReversalZone #SmartMoneyConcepts #CryptoMarket #SwingTrade