In-depth trading ideas
ARKM Descending Trendline, Breakout or Another Rejection?Time Frame: 4D
Pair: CRYPTOCAP:ARKM
Pattern: 📉 Descending Trendline / Downtrend Structure
🔎 Chart Overview
ARKM/USDT on the 4D timeframe continues to show a clearly defined long-term downtrend. Since reaching a high around 2.70 USDT, price has consistently formed a series of Lower Highs (LH) and Lower Lows (LL).
📉 The yellow trendline connecting several resistance points represents the Descending Trendline, which has continued to act as a major dynamic resistance.
💡 As long as price remain
ARKM / ARKMUSDT Long Setup | Breaker Block ReclaimMARKET ANALYSIS
ARKM is currently reacting from a key technical area highlighted on the chart.
As long as the protected support zone remains intact, the bullish market structure remains valid and higher liquidity targets may continue to attract price action.
A breakdown below the invalidation level would weaken the current bullish scenario and require a reassessment of market conditions.
📍 Entry, Stop Loss and Take Profit levels are marked directly on the chart.
━━━━━━━━━━━━━━
⚠️ DISCL
ARKM / ARKMUSDT Long Setup | Breaker Block ReclaimMARKET ANALYSIS
ARKM is currently reacting from a key technical area highlighted on the chart.
As long as the protected support zone remains intact, the bullish market structure remains valid and higher liquidity targets may continue to attract price action.
A breakdown below the invalidation level would weaken the current bullish scenario and require a reassessment of market conditions.
📍 Entry, Stop Loss and Take Profit levels are marked directly on the chart.
━━━━━━━━━━━━━━
⚠️ DISCL
ARKM: local squeeze with $0.1358 destinationThe Macro Picture 🗺️
ARKM has been rotating in a range between the $0.0914 floor and the $0.1654 ceiling. Price has pulled back to $0.1115 and is holding just above the $0.1056 local-low shelf — coiling in the lower half of the range as it sets up the next move.
The Setup ⚙️
The Range Floor 🟢
$0.0914 (Macro Support) is the demand base, with $0.1056 (Local Low) as the nearer shelf. Both have held, and that's the floor this range pivots on.
The Decision Point 🔴
$0.1264 (Local High) is the gate
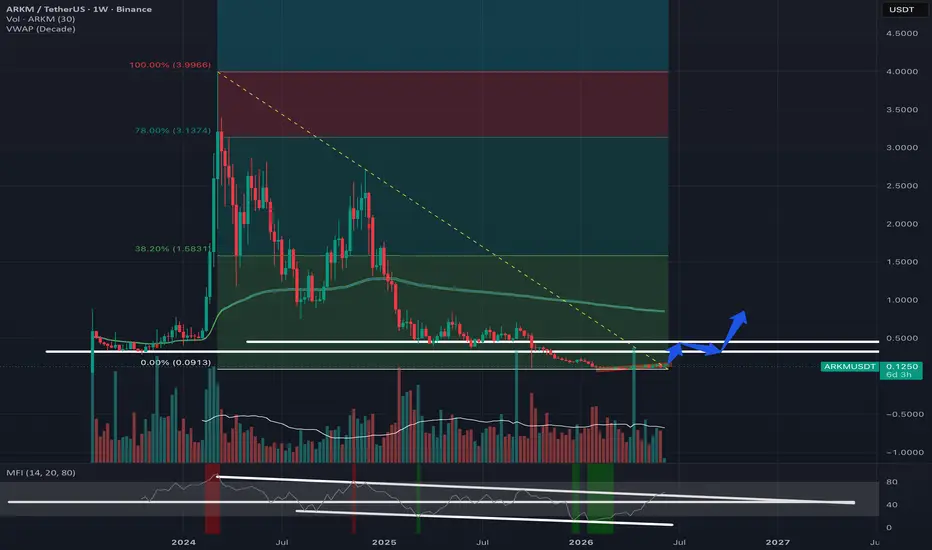
ARKM Triple Top Rejection Keeps Bears in ControlARKM continues to struggle under its long-term descending resistance after multiple failed attempts to push higher. The recent price structure shows repeated rejections around the same upper region, forming a potential triple top and highlighting strong seller presence.
Price is now compressing near the 0.1056 support area, while the descending trendline continues to pressure the structure from above. A clean breakdown below this support could confirm bearish continuation and expose lower level
TradeCityPro | ARKMUSDT Spot Buy Opportunity🚀 Analysis of ARKMUSDT | Spot Buy Opportunity
Let's take a look at Arkham, the largest on-chain transaction analytics platform, which has recently launched its own centralized exchange and continues expanding its ecosystem.
🌟 Weekly Updates:
Starting from Monday to Wednesday, we'll cover:
• Monday: Bitcoin & Dominance Analysis
• Tuesday: Ethereum & ETH/BTC Analysis
• Wednesday: Gold Analysis
These are in addition to our daily analyses.
🎉 Channel Milestone 800 Followers:
Thank you all for hel
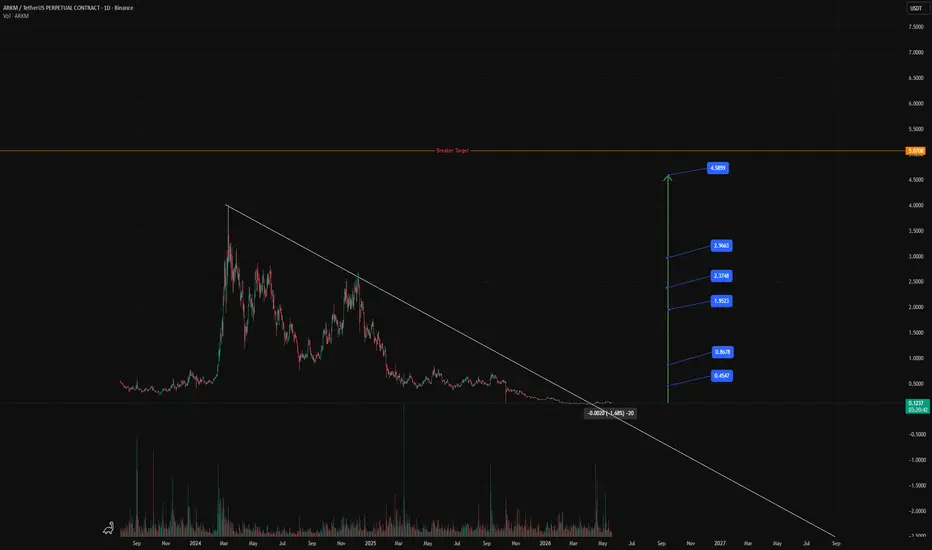
ARKMUSDT — Long-Term Compression With Major Recovery PotentialARKMUSDT — Long-Term Compression With Major Recovery Potential 🚀
ARKMUSDT has spent an extended period trading inside a strong macro downtrend, consistently respecting a descending resistance trendline while printing lower highs and lower lows. After aggressive sell pressure and prolonged weakness, price is now approaching a key compression phase near historical lows.
The structure suggests a potential bottoming process where downside momentum is gradually fading while risk-to-reward becomes
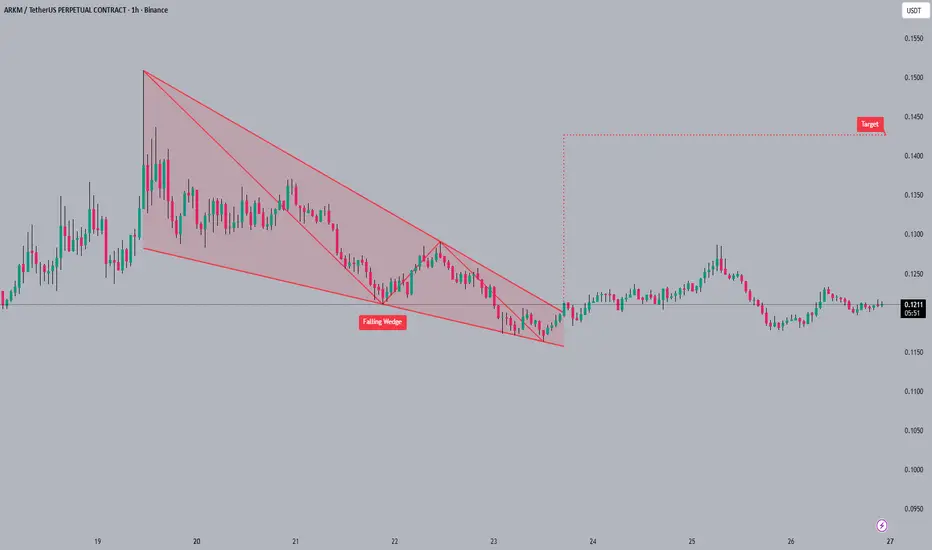
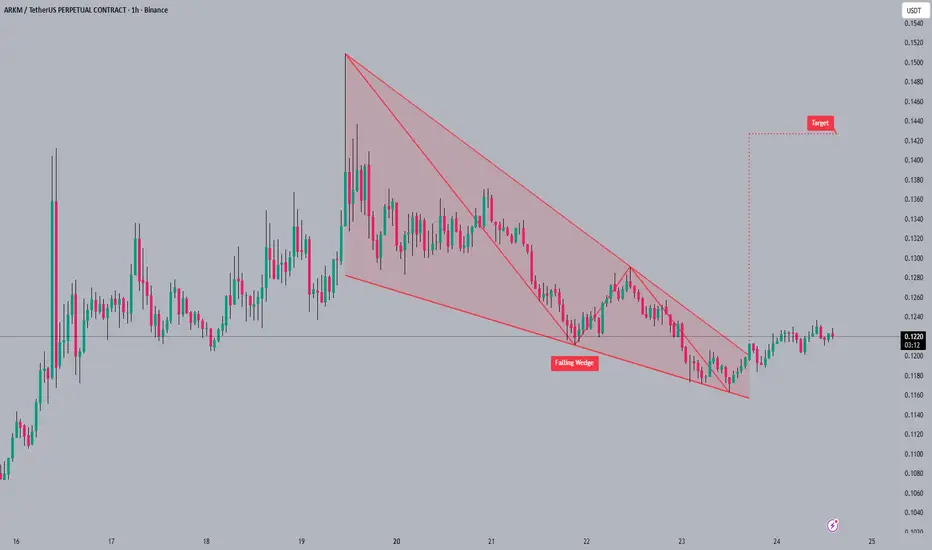
#ARKM#ARKM has broken out from its falling wedge pattern 📈 and is now consolidating above the resistance. A clear target for this bullish move is indicated around the 0.1420 level 🎯. Recognizing chart patterns helps anticipate trend shifts and market sentiment 🧠.
#ARKM #altcoin #chartpatterns #cryptotrading
ARKMUSDT Forming Bullish MomentumARKMUSDT is forming a clear bullish momentum pattern, a classic bullish reversal signal that often indicates an upcoming breakout. The price has been consolidating within a narrowing range, suggesting that selling pressure is weakening while buyers are beginning to regain control. With consistent volume confirming accumulation at lower levels, the setup hints at a potential bullish breakout soon. The projected move could lead to an impressive gain of around 140% to 150% once the price breaks abo
ARKMUSDT – Start of a Reversal or Just a Relief Rally?On the 1D timeframe, ARKM/USDT is moving within a clear Descending Channel pattern since the distribution phase at the top.
The resistance line (red) consistently forms lower highs
The support line (yellow) forms lower lows
Price respects the channel structure → indicating a structured bearish trend
However, currently price is starting to:
Approach the upper channel area
Form an impulsive move upward from the low (~0.09)
Potentially attempt a breakout from the bearish structure
---
📐
ARKMUSDT 1D#ARKM has broken above the descending resistance and the SMA50 on the daily chart. Consider buying a small bag here and adding on the retest of the broken trendline. The targets are:
🎯 $0.1411
🎯 $0.1709
🎯 $0.1950
🎯 $0.2191
🎯 $0.2533
🎯 $0.2970
⚠️ Always remember to use a tight stop-loss and maintain proper risk management.
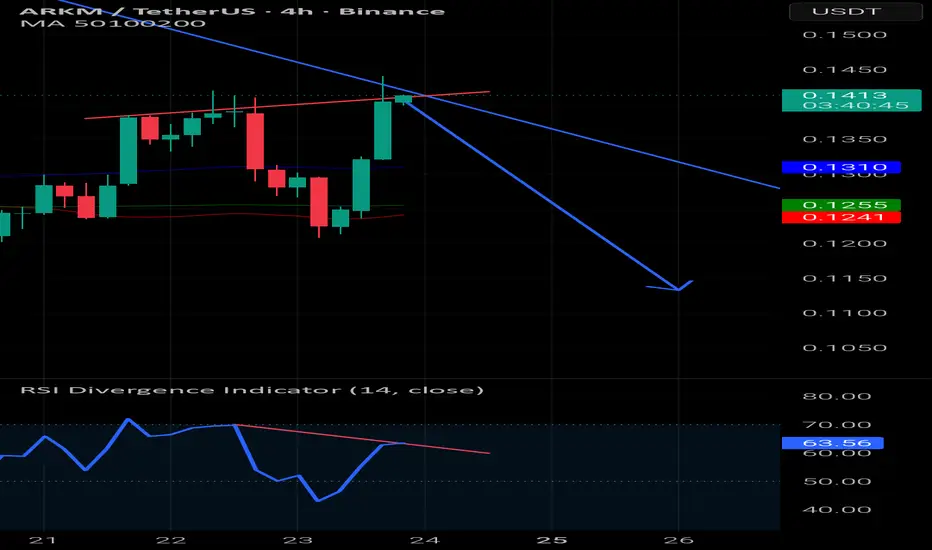
ARKM Approaching Broadening Wedge Target – Reversal Zone AheadARKM is currently developing a descending broadening formation, with price gradually approaching the lower boundary of the structure and the projected bearish target. The immediate resistance level remains the key area to watch. Any rejection from this level could push price further toward the downside target highlighted on the chart.
If price reaches the target zone, strong accumulation interest may emerge, potentially triggering a bullish reversal toward the $0.775 region as illustrated. For
ARKM/USDT — Bearish Continuation Below Key Channel ResistanceARKM/USDT on the daily timeframe (1D) remains in a strong and well-structured downtrend. Since printing the peak around the 0.71 area, price has consistently formed lower highs and lower lows, confirming sustained selling pressure.
The current price movement is not an accumulation phase, but rather a bearish continuation within a valid descending channel. As long as price stays below the channel resistance, the bearish structure remains intact.
---
Price Structure & Pattern Formation
1. Des
ARKMUSDT 1D#ARKM is moving inside a falling wedge on the daily chart. It may retest the wedge support one more time before the next leg up. In case of a successful bounce from the support and a breakout above the wedge, the potential targets are:
🎯 $0.281
🎯 $0.328
🎯 $0.366
🎯 $0.403
🎯 $0.457
🎯 $0.526
❌ Invalidation: a daily candle closing below the wedge.
⚠️ Always remember to use a tight stop-loss and maintain proper risk management.