ARPAUSDT.P: short setup from daily support at 0.00983BINANCE:ARPAUSDT.P is heading down after a pump. For the second day in a row, the price has been holding above the 0.00983 level, clearly confirming it with pip-for-pip strikes.
There are no close levels below that would prevent the price from falling freely, so if the asset does break the level, it could be a good short trade.
In-depth trading ideas
๏ปฟARPAUSDT.P: short setup from daily support at 0.01011Idea: a dump usually follows a pump, which is exactly what I expect in this situation.
On the chart, we can see a correction that stopped at the local level of 0.01011, above which accumulation has been ongoing for 10 hours now. Besides that, we had a fakeout. The reaction to it should have been strong growth if they really intended to push the asset higher, but no.
After the fakeout, the asset returned above the level and simply continued to consolidate. I expect a short.
ARPAUSDT 1D#ARPA is on the verge of breaking out above the daily SMA200 and the neckline of the rounding bottom pattern on the daily chart. If confirmed, the potential upside targets are:
๐ฏ $0.01426
๐ฏ $0.01556
๐ฏ $0.01742
๐ฏ $0.01979
โ ๏ธ Always use a tight stop-loss and maintain proper risk management.
ARPA Chain: The accumulation zone (Focus on the long-term)The all-time bottom here happened March 2020. The first and only bull market lasted 602 days. Total growth reached some 8,400%.
The all-time higher low happened October 2025. The bearish cycle lasting 1,435 days.
See here ARPA Chain (ARPAUSDT) produced a major low in 2025, not 2026.
This long-term chart shows a falling wedge pattern, a big one that is more than a year long. This pattern represents the final bearish impulse and we are now looking at change.
We can expect change because 2026 is higher than 2025 even though selling was 10 times stronger.
Sellers pressure in February 2026 was ten times as much compared to October 2025 and yet, the last support wasn't even tested. We can expect a trend reversal to show up at any time. It becomes the most likely scenario from now on.
At the same time, any trading at current levels or lower becomes an extreme opportunity buy-zone.
Focused on the long-term, we are looking at bottom prices and the accumulation zone.
Where will the market be two years from now, three years from now?
Think back to 2018 or 2022; what happened two to three years later?
โบโบ 2018 reached 2021 and the biggest bull market ever.
โบโบ 2022 reached 2025 with major all-time highs all across.
2025 wasn't like 2021, and that's ok. More time for the market to grow behind the scenes. A prolonged consolidation phase.
While a big portion of the market stagnated, the regulatory framework continued to improve.
All lawsuits against the market were lost. Conditions are much better now, and this will support a bull market in the coming years like never before.
We are about to witness something spectacular.
Little by little, week after week, month after month... Buy and accumulate altcoins. Can be any reputed project. Can be several projects. Those that are strong, those that you like, those that have been around long-term.
Ignore the price, we are looking at the bottom; accumulate week after week, month after month, as much as you can.
Watch what happens 2-3 years from now... Just watch. It will be awesome.
The greatest bull market ever. We are not there yet, but everything continues to unfold perfectly to support massive growth in the years ahead.
The longer the consolidation period, the stronger the bull market that follows.
The longer a project lingers around support, the stronger the base, the foundation, becomes to support long-term growth.
We are in this now. We start this now, it has been going for years, and it gets better with each passing day.
The Bitcoin halving 2028 is coming, and that is just one of hundreds of bullish events.
Buy Crypto. Hold for โfocus onโ the long-term.
Thank you for reading.
Namaste.
KEEP YOUR EYES ON ARPA๐ฅ Fortune AI Radar โ CRYPTOCAP:ARPA
Fresh activity detected on CRYPTOCAP:ARPA today.
Data suggests increasing market interest & buyers stepping in.
Technicals currently lean bullish, with momentum trending upward.
Whales showing hints of accumulation and hype rising among trader
ARPA Chain: The accumulation zone (Focus on the long-term)The all-time bottom here happened March 2020. The first and only bull market lasted 602 days. Total growth reached some 8,400%.
The all-time higher low happened October 2025. The bearish cycle lasting 1,435 days.
See here ARPA Chain (ARPAUSDT) produced a major low in 2025, not 2026.
This long-term chart shows a falling wedge pattern, a big one that is more than a year long. This pattern represents the final bearish impulse and we are now looking at change.
We can expect change because 2026 is higher than 2025 even though selling was 10 times stronger.
Sellers pressure in February 2026 was ten times as much compared to October 2025 and yet, the last support wasn't even tested. We can expect a trend reversal to show up at any time. It becomes the most likely scenario from now on.
At the same time, any trading at current levels or lower becomes an extreme opportunity buy-zone.
Focused on the long-term, we are looking at bottom prices and the accumulation zone.
Where will the market be two years from now, three years from now?
Think back to 2018 or 2022; what happened two to three years later?
โบโบ 2018 reached 2021 and the biggest bull market ever.
โบโบ 2022 reached 2025 with major all-time highs all across.
2025 wasn't like 2021, and that's ok. More time for the market to grow behind the scenes. A prolonged consolidation phase.
While a big portion of the market stagnated, the regulatory framework continued to improve.
All lawsuits against the market were lost. Conditions are much better now, and this will support a bull market in the coming years like never before.
We are about to witness something spectacular.
Little by little, week after week, month after month... Buy and accumulate altcoins. Can be any reputed project. Can be several projects. Those that are strong, those that you like, those that have been around long-term.
Ignore the price, we are looking at the bottom; accumulate week after week, month after month, as much as you can.
Watch what happens 2-3 years from now... Just watch. It will be awesome.
The greatest bull market ever. We are not there yet, but everything continues to unfold perfectly to support massive growth in the years ahead.
The longer the consolidation period, the stronger the bull market that follows.
The longer a project lingers around support, the stronger the base, the foundation, becomes to support long-term growth.
We are in this now. We start this now, it has been going for years, and it gets better with each passing day.
The Bitcoin halving 2028 is coming, and that is just one of hundreds of bullish events.
Buy Crypto. Hold for โfocus onโ the long-term.
Thank you for reading.
Namaste.
ARPA WHALES ACTIVITY DETECTED๐ฅ Fortune AI Radar โ CRYPTOCAP:ARPA
Fresh activity detected on CRYPTOCAP:ARPA today.
Data suggests increasing market interest & buyers stepping in.
Technicals currently lean bullish, with momentum trending upward.
Whales showing hints of accumulation and hype rising among traders.
This coin is flashing strong signals on short-term charts โ worth keeping an eye on ๐
Not financial advice โ always research before taking decisions
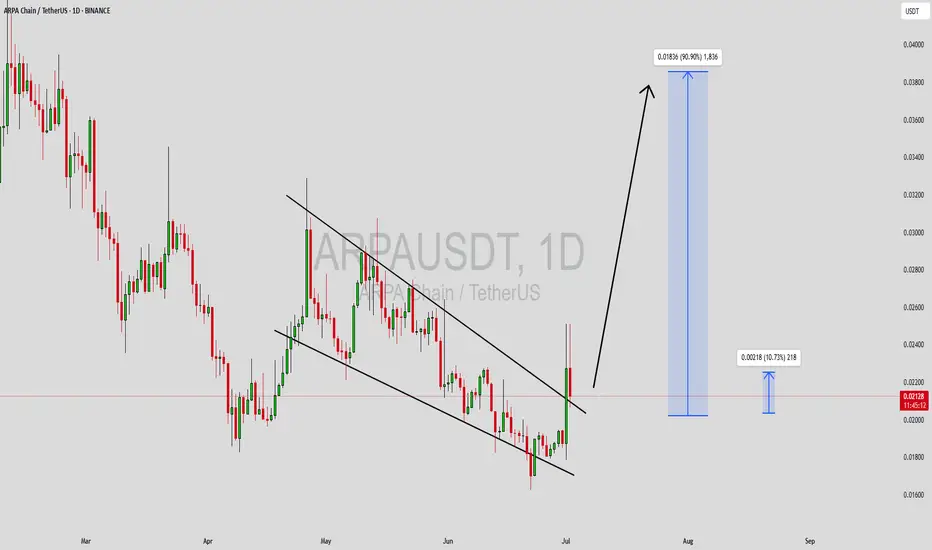
ARPAUSDT Forming Bullish WaveARPAUSDT is forming a clear bullish wave pattern, a classic bullish reversal signal that often indicates an upcoming breakout. The price has been consolidating within a narrowing range, suggesting that selling pressure is weakening while buyers are beginning to regain control. With consistent volume confirming accumulation at lower levels, the setup hints at a potential bullish breakout soon. The projected move could lead to an impressive gain of around 90% to 100% once the price breaks above the wedge resistance.
This falling wedge pattern is typically seen at the end of downtrends or corrective phases, and it represents a potential shift in market sentiment from bearish to bullish. Traders closely watching ARPAUSDT are noting the strengthening momentum as it nears a breakout zone. The good trading volume adds confidence to this pattern, showing that market participants are positioning early in anticipation of a reversal.
Investorsโ growing interest in ARPAUSDT reflects rising confidence in the projectโs long-term fundamentals and current technical strength. If the breakout confirms with sustained volume, this could mark the start of a fresh bullish leg. Traders might find this a valuable setup for medium-term gains, especially as the wedge pattern completes and buying momentum accelerates.
โ
Show your support by hitting the like button and
โ
Leaving a comment below! (What is your opinion about this Coin?)
Your feedback and engagement keep me inspired to share more insightful market analysis with you!
#ARPAUSDT #1D (ByBit) Chuvashov's fork breakoutARPA did a V-shaped recovery with great increase in volume and about to regain 200MA support.
Golden cross seems around the corner, looks very likely to rally mid-term.
โก๏ธโก๏ธ #ARPA/USDT โก๏ธโก๏ธ
Exchanges: ByBit USDT
Signal Type: Regular (Long)
Leverage: Isolated (2.0X)
Amount: 4.6%
Entry Targets:
1) 0.02233
Take-Profit Targets:
1) 0.03456
Stop Targets:
1) 0.01743
Published By: @Zblaba
$ARPA BYBIT:ARPAUSDT.P #1D #DeFi arpanetwork.io
Risk/Reward= 1:2.5
Expected Profit= +109.5%
Possible Loss= -43.9%
Estimated Gaintime= 1-2 months
ARPAUSDT 1D#ARPA is attempting to break above the descending resistance and the daily SMA200. Keep an eye on it โ in case of a successful breakout, the potential targets are:
๐ฏ $0.02468
๐ฏ $0.02827
๐ฏ $0.03230
๐ฏ $0.03632
๐ฏ $0.04205
๐ฏ $0.04935
โ ๏ธ Always remember to use a tight stop-loss and maintain proper risk management.
ARPAUSDT UPDATE#ARPA
UPDATE
ARPA Technical Setup
Pattern: Bullish falling wedge pattern
Current Price: $0.0221
Target Price: $0.039
Target % Gain: 75.65%
$ARPA is breaking out of a falling wedge pattern on the 1D timeframe. Current price is $0.0221 with a target near $0.039, indicating a potential 75% upside move. The breakout highlights strong bullish momentum with room for continuation if volume sustains.
Time Frame: 1D
Risk Management Tip: Always use proper risk management.
ARPAUSDT Forming Falling WedgeARPAUSDT is currently trading within a falling wedge pattern, a bullish reversal signal that often indicates a strong upcoming breakout. The pair has been consolidating within a narrowing range, showing that sellers are losing momentum while buyers are gradually stepping in. The consistent good trading volume supports this technical setup, suggesting growing accumulation at lower levels. Once the resistance line is broken, ARPAUSDT could witness a significant surge, with the potential for 90% to 100%+ gains as bullish momentum strengthens.
This setup is attracting increasing attention from traders and investors who are anticipating a breakout rally. The falling wedge formation typically precedes a sharp price move, especially when confirmed by volume expansion and improving market sentiment. The current positioning of ARPAUSDT hints that it may be nearing the final stages of compression, making it a potential candidate for a strong upside move in the near term.
With investors showing renewed interest in the ARPA project and the crypto market displaying improved liquidity, this technical structure aligns perfectly with bullish continuation expectations. A breakout from the wedge could open the doors for a sustained rally as confidence returns to this pair. Traders are keeping a close watch for a decisive move above key resistance levels that could confirm this reversal pattern and trigger a strong upward trend.
โ
Show your support by hitting the like button and
โ
Leaving a comment below! (What is You opinion about this Coin)
Your feedback and engagement keep me inspired to share more insightful market analysis with you!
ARPAUSDT Forming Falling WedgeARPAUSDT is drawing fresh attention from crypto traders as it forms a classic falling wedge pattern on the daily timeframe. This technical pattern is widely recognized as a strong bullish reversal signal when backed by healthy volume and growing investor interest. The falling wedge indicates that the downtrend is losing momentum, and a breakout to the upside could trigger a significant move. With current market dynamics, ARPAUSDT is showing promising signs that it could deliver an expected gain of 80% to 90% or more once this pattern resolves.
Good volume levels in recent sessions confirm that accumulation is happening quietly, which is often the case before a breakout from a wedge pattern. Traders looking for high-probability setups should keep an eye on the breakout zone around the wedgeโs upper trendline. A confirmed close above this resistance with increased volume could be the catalyst for a strong rally. ARPAโs fundamentals, coupled with positive sentiment from investors taking interest in the project, add extra fuel to the potential upside.
As more altcoins regain momentum, ARPAUSDT stands out as one of the most interesting pairs to watch for short- to mid-term gains. Technical traders and pattern-based investors often target these setups to capture explosive price action. Staying patient for a clean breakout and using proper risk management will be crucial to maximize the reward potential in this setup.
โ
Show your support by hitting the like button and
โ
Leaving a comment below! (What is You opinion about this Coin)
Your feedback and engagement keep me inspired to share more insightful market analysis with you!
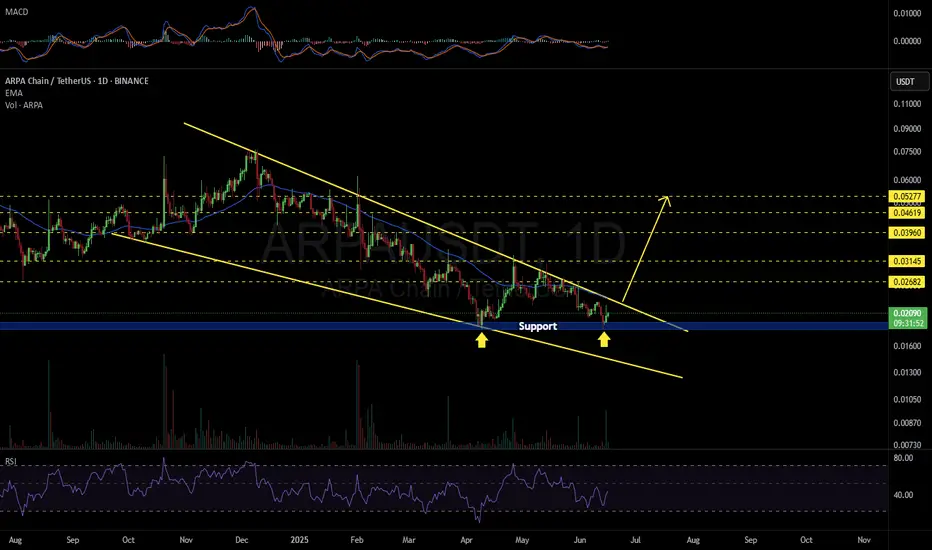
ARPAUSDT 1D#ARPA is moving inside a Falling Wedge pattern on the daily chart โ a classic bullish reversal signal.
If the price breaks above the wedge resistance and the daily EMA50, the following targets come into play:
๐ฏ $0.02682
๐ฏ $0.03145
๐ฏ $0.03960
๐ฏ $0.04619
๐ฏ $0.05277
โ ๏ธ Always use a tight stop-loss to manage risk and protect your capital.
ARPAUSDT Forming Falling WedgeARPAUSDT is currently presenting a classic falling wedge pattern, which is widely recognized as a bullish reversal formation in technical analysis. This setup suggests that the recent downtrend may be losing momentum, with lower highs and lower lows converging toward a breakout point. The narrowing wedge, combined with consistent volume, indicates that a strong move could be imminent once resistance is broken. Based on the structure and historical behavior, traders are eyeing a potential gain in the range of 80% to 90%+ in the upcoming sessions.
The volume profile remains healthy, reflecting strong investor interest and growing participation around these price levels. This is often a precursor to breakout rallies, especially when the broader market sentiment is shifting toward altcoins. The wedge pattern, if confirmed by a breakout above the resistance line with strong bullish candles, could trigger a significant upside momentum as technical traders and algorithms enter long positions.
ARPAUSDT also benefits from strong community backing and increasing mentions across social and trading platforms, signaling that sentiment is tilting positive. With fundamentals aligning and technicals pointing to a breakout, this pair stands out among mid-cap altcoins for traders looking for potential explosive setups. Key levels to watch include the breakout point and subsequent resistance zones, which, if cleared, may lead to a sustained bullish move.
As the pattern develops and market dynamics unfold, ARPAUSDT could become one of the more attractive opportunities in the short term. Be prepared for increased volatility and monitor the breakout closely for confirmation.
โ
Show your support by hitting the like button and
โ
Leaving a comment below! (What is You opinion about this Coin)
Your feedback and engagement keep me inspired to share more insightful market analysis with you!
ARPAUSDT: A Resilient Asset Amidst Market UncertaintyAmidst the current market's discernible weakness, where many altcoins experience a decline, a close examination of ARPAUSDT reveals characteristics that suggest it is not merely another asset in freefall. Indeed, it presents as a potentially more resilient area within this volatile landscape.
While price has experienced significant depreciation, a diligent review indicates that buying activity persists, demonstrating a notable resilience against selling pressure. This is derived from objective observation:
Volume Footprint: Despite falling prices, the volume footprint indicates a consistent, albeit intermittent, presence of genuine buying activityโan underlying current of demand.
CDV (Cumulative Delta Volume): CDV frequently suggests that selling pressure is being absorbed, even during price declines, differentiating its behavior from assets under clear bearish dominance.
Buyer Resilience: The consistent strength demonstrated by these buyers, despite prevailing market weakness, suggests a foundational capacity to mitigate further significant depreciation.
This distinct behavior positions ARPAUSDT as noteworthy. Consistent with a disciplined approach, particular attention is given to assets exhibiting sudden and significant increases in volume. For ARPAUSDT, the quality of buyer volume, though fragmented, merits consideration.
Therefore, diligent observation of ARPAUSDT is advised. During periods of broader market uncertainty, genuine underlying strength becomes more apparent. Further validation through low timeframe (LTF) confirmations is essential to corroborate these dynamics. Opportunities in resilient assets, distinct from the general apprehension, are indeed uncommon.
๐I keep my charts clean and simple because I believe clarity leads to better decisions.
๐My approach is built on years of experience and a solid track record. I donโt claim to know it all but Iโm confident in my ability to spot high-probability setups.
๐If you would like to learn how to use the heatmap, cumulative volume delta and volume footprint techniques that I use below to determine very accurate demand regions, you can send me a private message. I help anyone who wants it completely free of charge.
๐I have a long list of my proven technique below:
๐ฏ ZENUSDT.P: Patience & Profitability | %230 Reaction from the Sniper Entry
๐ถ DOGEUSDT.P: Next Move
๐จ RENDERUSDT.P: Opportunity of the Month
๐ ETHUSDT.P: Where to Retrace
๐ข BNBUSDT.P: Potential Surge
๐ BTC Dominance: Reaction Zone
๐ WAVESUSDT.P: Demand Zone Potential
๐ฃ UNIUSDT.P: Long-Term Trade
๐ต XRPUSDT.P: Entry Zones
๐ LINKUSDT.P: Follow The River
๐ BTCUSDT.P: Two Key Demand Zones
๐ฉ POLUSDT: Bullish Momentum
๐ PENDLEUSDT.P: Where Opportunity Meets Precision
๐ฅ BTCUSDT.P: Liquidation of Highly Leveraged Longs
๐ SOLUSDT.P: SOL's Dip - Your Opportunity
๐ธ 1000PEPEUSDT.P: Prime Bounce Zone Unlocked
๐ ETHUSDT.P: Set to Explode - Don't Miss This Game Changer
๐ค IQUSDT: Smart Plan
โก๏ธ PONDUSDT: A Trade Not Taken Is Better Than a Losing One
๐ผ STMXUSDT: 2 Buying Areas
๐ข TURBOUSDT: Buy Zones and Buyer Presence
๐ ICPUSDT.P: Massive Upside Potential | Check the Trade Update For Seeing Results
๐ IDEXUSDT: Spot Buy Area | %26 Profit if You Trade with MSB
๐ USUALUSDT: Buyers Are Active + %70 Profit in Total
๐ FORTHUSDT: Sniper Entry +%26 Reaction
๐ณ QKCUSDT: Sniper Entry +%57 Reaction
๐ BTC.D: Retest of Key Area Highly Likely
๐ XNOUSDT %80 Reaction with a Simple Blue Box!
๐ BELUSDT Amazing %120 Reaction!
๐ Simple Red Box, Extraordinary Results
๐ TIAUSDT | Still No BuyersโMaintaining a Bearish Outlook
๐ OGNUSDT | One of Todayโs Highest Volume Gainers โ +32.44%
๐ TRXUSDT - I Do My Thing Again
๐ FLOKIUSDT - +%100 From Blue Box!
๐ SFP/USDT - Perfect Entry %80 Profit!
๐ AAVEUSDT - WE DID IT AGAIN!
I stopped adding to the list because it's kinda tiring to add 5-10 charts in every move but you can check my profile and see that it goes on..
Bullish divergence on MKC Daily
Bullish div on ME, mLines, ATR channels and slightly on sRSI
Impuls on factor 5 TF is red, but EFI is turning from an extreme level and factor 3 is blue impulse
E: 72,73
TP: 75,43
SL: 70,86
RR: 1:1.44
Trade #00012
Note:
I posted this when price was 72.45, at market open, but I could not post my regular charts as of now on Tradingview does not allow it when you publish indicators that are private.
So this chart already shows part of the move.
This is trade number 12.
Score so far is: 7 out 11 63,6% hitrate