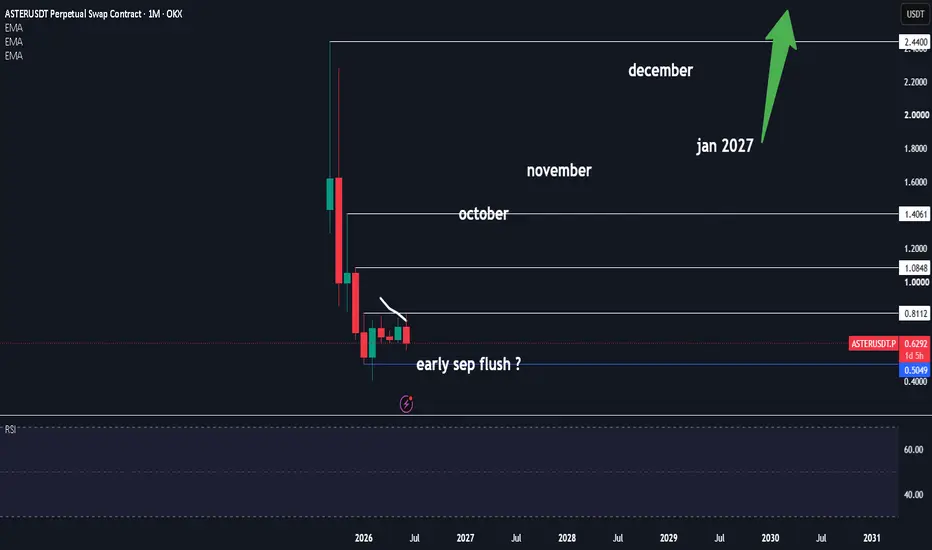
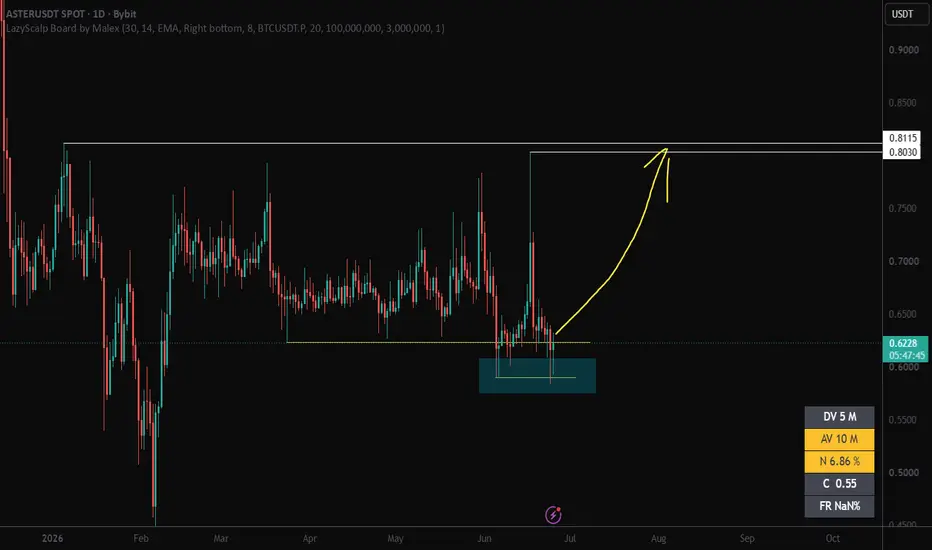
My $ASTER long has gone nowhere in 3 weeks, CLOSING now.I've been sitting in this SEED_WANDERIN_JIMZIP900:ASTER long for three weeks now, opened at $0.622, and it's time to make a decision.
So here's my view. On the daily chart, as far as crypto goes, this still looks very much like an accumulation phase, close to the bottom, and in my opinion it's on
ASTER REVENUE BULLISH RIGHT NOWSEED_WANDERIN_JIMZIP900:ASTER DEX is making good revenue now
According to data on DefiLlama, leading perps DEX ASTER has now generated good cumulative fees
It continues to lead the perps sector alongside HyperliquidX
Nearly 3 million SEED_WANDERIN_JIMZIP900:ASTER tokens have just been burned..
$ASTER - Daily: LONG position going WELLSEED_WANDERIN_JIMZIP900:ASTER - Daily
Quite an interesting position for a crypto asset. On the surface, nothing has really happened all year, but that's actually the most interesting part. SEED_WANDERIN_JIMZIP900:ASTER has reacted surprisingly well to crypto market selloffs, remaining relatively
$ASter craziness pending6 months in surely 1 more capitulation or are we flipping this and then doing the mother of all manipulation and popping back hard
either way spot think of it as a buy and forget
long term always wins as long as the coin does not get delisted the money will magically appear and we shall go for a
$ASTER – Level Breakout IdeaThe idea previously didn't go according to script . To be exact, it started moving, but it missed the trendline I drew and ended up forming a double-touch level. I am still holding the asset in the spot market, waiting for a breakout of the levels and a potential trend reversal.
From what I see ri
ASTER LONG OPPORTUNITY 2nd Entry
As part of the broader narrative surrounding ecosystem expansion into the Perp DEX sector, ASTER has successfully formed a solid double bottom structure on the chart. A strong bullish continuation is expected from this base.
Stop 0.588
Target: 0.92 ~ 1.12
Just my personal opinion. Not financial
ASTER/USDT – Elliott Wave Analysis (Daily Time Frame)📊 ASTER/USDT – Elliott Wave Analysis (Daily Time Frame)
🔍 Current Market Structure
Based on the Elliott Wave count shown on the chart, ASTER appears to have completed a larger corrective ABC structure, with Wave C ending near the February low. Since then, price has been building a base and conso
See all ideas
Summarizing what the indicators are suggesting.
Oscillators
Neutral
SellBuy
Strong sellStrong buy
Strong sellSellNeutralBuyStrong buy
Oscillators
Neutral
SellBuy
Strong sellStrong buy
Strong sellSellNeutralBuyStrong buy
Summary
Neutral
SellBuy
Strong sellStrong buy
Strong sellSellNeutralBuyStrong buy
Summary
Neutral
SellBuy
Strong sellStrong buy
Strong sellSellNeutralBuyStrong buy
Summary
Neutral
SellBuy
Strong sellStrong buy
Strong sellSellNeutralBuyStrong buy
Moving Averages
Neutral
SellBuy
Strong sellStrong buy
Strong sellSellNeutralBuyStrong buy
Moving Averages
Neutral
SellBuy
Strong sellStrong buy
Strong sellSellNeutralBuyStrong buy
Displays a symbol's price movements over previous years to identify recurring trends.