ATOM at macro floor: base recovery toward $1.6367The Macro Picture 🗺️
ATOM ground down from the $2.2955 macro ceiling all the way to the $1.4070 macro floor and has flattened onto it at $1.4169. The long, steady bleed has given way to a base right on support — exhaustion rather than continuation.
The Setup ⚙️
The Accumulation Zone 🟢
$1.4070–1.4169 is where the selling has dried up. Macro Support has held on retest, and this is the demand shelf a recovery would build from.
The Decision Point 🔴
$2.0312 (Local High) is the structural gate far above. Before it, the $1.6367 measured-move target is the first objective — reclaiming it proves buyers are stepping back in.
The Roadmap 🛣️
Hold the $1.4070 floor → recover toward $1.6367 as the first leg up. Invalidation is a clean daily close below $1.4070 — that voids the accumulation thesis.
This is a textbook DCA Accumulation Zone setup: scale in across the $1.4070–1.4169 band and let the base do the work.
More setups in profile.
#ATOM #Cosmos #crypto #trading #TA #3Commas #DCA
In-depth trading ideas
#ATOMUSDT (Daily)#ATOMUSDT (Daily)
ATOM could continue its downward movement and potentially reach lower price levels.
If price reaches the red zone and confirmation appears, a short position can be taken targeting the blue zone.
At the blue zone, there is strong demand, which may cause a temporary bullish reaction.
This setup offers a potential R:R of around 1:4, suitable for 10x leverage, but confirmation is required.
We are keeping an eye on it.
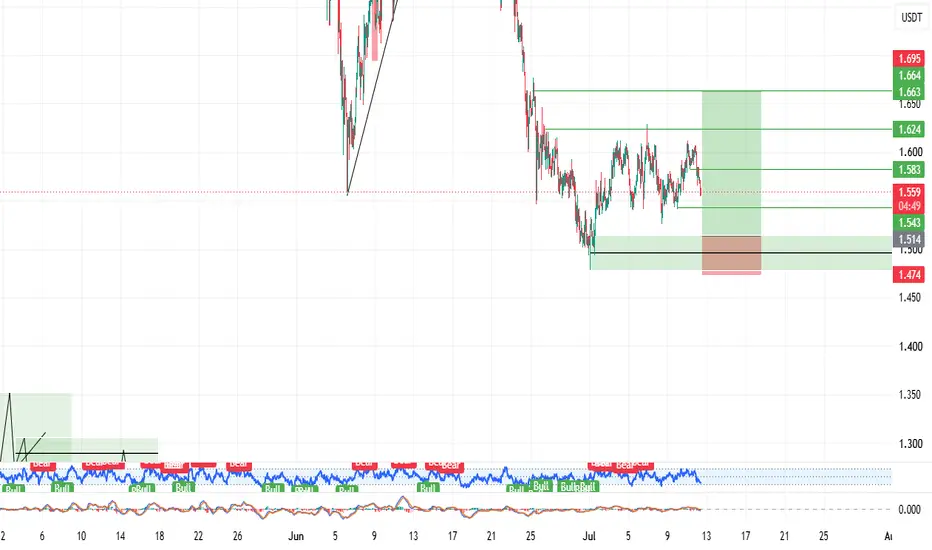
ATOM USDT LONG SIGNAL#50. ATOM/USDT – Trade Setup (LONG)
📈 Position Type: LONG
🕒 Timeframe: 1 H
📊 Market: Futures
💰 Entry Zone:
1.514
🛑 Stop-Loss:
1.470
🎯 Take-Profit Targets:
• TP1: 1.543
• TP2: 1.582
• TP3: 1.624
• TP4: 1.664
TP5:
TP6:
⚙️ Leverage:
5- 10
⚠️ After reaching TP1, move Stop-Loss to Entry Price.
📌 Risk Management:
Risk only 1–2% of your capital per trade.
Always confirm the setup on your chart before entry
#ATOM/USDT | ATOMUSDT Preparing for a Potential Drop#ATOM
The price is moving within a descending channel on the 1-hour timeframe and has reached the lower boundary. It is now poised for a bounce and is expected to retest this boundary.
The Relative Strength Index (RSI) indicates a downward trend, which is likely to continue given the overbought conditions.
A key support zone (in green) has been identified at 1.40. The price has bounced off this zone several times, making it a strong support level.
The price is trending towards the 100-period moving average, which we are approaching. This trend supports an upward move.
Entry Price: 1.55
First Target: 1.57
Second Target: 1.61
Third Target: 1.66
You can close at the second target or wait for the third target to be reached. The choice is yours.
Stop Loss: At the resistance zone (in green).
Remember this simple rule: Money Management.
Any questions? Please leave a comment.
Thank you.
ATOM: downtrend leans on the $1.5 floorThe Macro Picture 🗺️
ATOM has been under steady distribution since its $2.5 March peak, carving a series of lower highs down to the $1.5–$1.55 floor it's testing now. Unlike an oversold washout that snaps back, momentum here is merely soft — RSI hovering in the high-30s without a decisive turn. Price sits at $1.6 just above the floor, and this level is now the line that decides whether buyers can force a relief bounce or sellers press the breakdown.
The Setup ⚙️
The Reaction: The $1.5 floor has absorbed the latest leg down and price has ticked up to $1.6, but the bounce is shallow and RSI refuses to lift with conviction. Sellers still cap every push, and the structure of lower highs remains firmly intact overhead.
The Trigger: A reclaim of the $1.8 breakdown level would be the first real sign the downtrend is stalling, opening a move back toward the $2.0 macro resistance. Failure to hold $1.5 on a closing basis tips the balance the other way, exposing the open air beneath the floor.
The Roadmap: Primary target on a bounce sits at $1.8 — the broken support turned resistance, where the green roadmap points if buyers reclaim it. Invalidation: a sustained 1D close below $1.5 would confirm the breakdown and open a flush toward $1.45 and lower.
ATOM USDT LONG SIGNAL#10
ATOM/USDT – Trade Setup (LONG)
📈 Position Type: LONG
🕒 Timeframe: 1 H
📊 Market: Futures
💰 Entry Zone:
1.604
1.568
🛑 Stop-Loss:
1.530
🎯 Take-Profit Targets:
• TP1: 1.635
• TP2: 1.676
• TP3: 1.716
• TP4: 1.760
TP5: 1.800
TP6:
⚙️ Leverage:
5- 10
⚠️ After reaching TP1, move Stop-Loss to Entry Price.
📌 Risk Management:
Risk only 1–2% of your capital per trade.
Always confirm the setup on your chart before entry
ATOM HIGHLY UNDERVALUED HERENASDAQ:ATOM is officially shifting gears and accelerating
Fundamental progress NASDAQ:ATOM holders have been waiting for.
RWAs taking off — Unlocking major institutional assets (BlackRock, Securitize & more) through powerful cross-chain tech
IBC firepower — Trustless, low-fee connections expanding fast to Solana, EVM L2s & big CBDC partners
Proven Tokenomics — Gauntlet’s data confirms sell pressure is mainly CEX-driven, not from stakers. Strong long-term foundation!
Builder momentum — Top hackathon winners like Mad Votes and IBC games heading straight to mainnet. Pure infrastructure delivery. Zero hype — all execution.
Daily compounding + REStake while the team builds real future value 💪
ATOMUSDT oversold reaction: targeting $1.85The Macro Picture 🗺️
ATOM completed the bearish breakdown — the $1.55 structural floor lost on a sustained daily close, and price extended into the $1.50 area where no historical reaction points exist on visible structure. But that same break drove daily RSI down to 30 for the second time in a month, mirroring the exhaustion print from the early-June sweep that kicked off a vertical bounce from $1.55 to $2.05. The structure is now offering bulls the same setup it did three weeks ago: a violent break into thin liquidity, momentum fully exhausted, and a freshly-flipped resistance level sitting just overhead. This is the kind of post-capitulation reset where the path of least resistance can shift fast.
The Setup ⚙️
The Reaction: Daily RSI at 30 is the signal that wasn't on the table yesterday — the breakdown is now structurally complete from a momentum standpoint, and every prior 30 print on this chart has marked a reaction low rather than a continuation point.
The Floor: The $1.50 fresh low is where the breakdown extended into untested territory and stalled. Bulls defending this level keeps the exhaustion thesis alive; another sustained close below it confirms continuation instead.
The Trigger: The $1.55 just-broken structural floor is the first reclaim level — a clean daily close back above $1.55 flips yesterday's breakdown into a failed move and opens the path back through the broken structure stack above.
The Roadmap: Primary target sits at $1.85 — the broken decision zone where the prior post-sweep base lost support and where trapped sellers from the breakdown will be forced to cover. The $1.65 broken floor sits in between as the first reclaim checkpoint. Invalidation: a sustained daily close back below $1.50 would invalidate this exhaustion thesis and confirm the breakdown continues into untested territory.
ATOMUSDT at structural floor: bearish breakdown setupThe Macro Picture 🗺️
ATOM has completed a clean lower-high cycle since the early-June sweep — $2.30 macro resistance gave way to $2.05 twice, and every prior support pivot ($1.85 decision zone, $1.65 broken floor) has been lost on sustained daily closes. The structural reset that bulls needed at $1.55 last month never matured into a base, and price is now back at the same liquidity pocket without the oversold momentum that fueled the first bounce. Daily RSI sits in the low 40s and is sloping down rather than curling up from 30. This is the cleanest bearish setup the chart has shown in weeks: every defensive level taken out in sequence, momentum confirming, and the last structural floor under direct pressure.
The Setup ⚙️
The Rejection: The $2.05 lower-high cluster rejected price twice in June — a textbook continuation pattern after the macro peak at $2.30 was confirmed. Bears are defending this band with conviction every time price tries to reclaim it.
The Floor: The $1.55 structural floor is the last historical reaction point on the visible chart — the same level that printed the early-June sweep low. Price is testing it for the second time, but without the momentum reset that came with the first bounce.
The Trigger: A sustained daily close below $1.55 confirms the breakdown and opens the path of least resistance into untested territory — no prior reaction points exist below this level on visible structure, which means trapped buyers from the post-sweep base will be forced to liquidate into thin liquidity.
The Roadmap: Primary objective is the structural break itself — a sustained daily close below $1.55 confirms the bearish thesis and opens untested territory where no historical reaction points exist to catch the move. Invalidation: a sustained daily close back above $1.65 would invalidate this bearish setup and reopen the path toward the $1.85 broken decision zone overhead.
ATOMUSDT Movements between levels and potential buying zoneThe Atom (Cosmos) price has returned to the daily support level of 1.678-1.715, which currently remains one of the key areas of interest for buyers. This range has previously seen demand activity, so the current test of this level could be decisive for further movement. While this support is being tested, buyers retain the opportunity to recover and resume growth.
The current decline was the result of a rebound from the weekly resistance level of 2.011-2.074. Prior to this, the price formed an accumulation zone directly below this level, indicating preparation for a breakout attempt. Moreover, during the rally, the market was able to impulsively break through the daily level of 1.840-1.857, confirming seller activity. However, buying volume was insufficient, and sellers were able to defend their zone of interest, triggering a downward movement.
Despite the current pullback, the market structure does not yet appear to be broken. A return to the 1.678-1.715 support level can be seen as a retest of the demand zone after a failed attempt to breach the weekly resistance. It's crucial for bulls to maintain this range and generate a reaction with large volumes. In this case, the first target for recovery will be the daily level of 1.840-1.857. This zone serves as the immediate benchmark for growth, and a confident breakout will allow the market to return to the weekly resistance of 2.011-2.074 and attempt to retest bears' readiness to maintain control.
For bears, the situation is different. Despite successfully defending the weekly level, they need to confirm their advantage not only with rebounds from above but also with support. The main objective is to withdraw additional volumes and consolidate the price below the 1.678-1.715 range. Only then can we assume that bulls have fully lost control of the current structure and the potential for further declines has been established.
Thus, the coin has approached an important decision point. Support at 1.678-1.715 remains a zone of bulls interest and could be the starting point for a new wave of growth. However, if bears manage to break through this range and consolidate below, the market structure will shift in their favor. As in many similar situations, volume and market participants' reaction at current key levels will remain the deciding factor.
ATOMUSDT post-sweep base: targeting $2.30The Macro Picture 🗺️
ATOM is carving the early structure of a post-sweep base after last week's liquidity hunt cleared out the $1.55 stops below the prior macro floor. The reactive bounce pushed price into the $2.05 local high before momentum stalled, and the pullback has now found support at $1.85 — a clean higher low above the sweep zone and inside the post-reset accumulation range. This is the kind of structural pause that bulls desperately need before any second leg toward the macro resistance, and the fact that the dip is holding well above $1.65 tells us sellers couldn't reclaim the broken floor on the retest. Daily RSI is consolidating in the mid-zone with momentum quietly resetting.
The Setup ⚙️
The Floor: The $1.55 sweep low remains the structural floor of this entire setup, and the failure to retest it after the bounce confirms buyers have stepped back in well above $1.90. This is the deep liquidity pocket the thesis hinges on.
The Reaction: The $1.85 decision zone is where bulls are drawing the line — a clean higher low forming above the sweep, with RSI flat in the mid-zone rather than rolling over. Momentum is paused, not broken.
The Trigger: The $2.00–$2.05 band is the immediate cap — the same zone that capped the previous bounce attempt. A clean daily close above $2.05 flips this band into support and opens the path of least resistance toward the failed peak.
The Roadmap: Primary target sits at $2.30 — the failed peak that
has rejected price four times since February and where trapped sell stops from over-leveraged shorts still rest. Invalidation: a sustained daily close back below $1.65 would invalidate this bullish base thesis and reopen the path toward a re-test of the $1.55 sweep zone.
ATOM Daily Crossback — Compression Under Resistance
ATOM is sitting in a clean decision area.
The daily has pushed back into the 10/20 zone after the June expansion move, and now price is compressing instead of immediately rejecting.
This is where the market usually gives the answer: acceptance through the range high, or failure back into the prior leg.
HTF Context:
On the daily, ATOM is still working through a larger crossback phase after the reclaim from the June lows.
Price has filled back into the daily FVG area and is holding near the 10/20 structure. The important part is that participants have not aggressively rejected this zone yet. Instead, price is staying tight near the upper side of the pullback.
That keeps the idea alive, but the daily still needs expansion to confirm continuation.
LTF Structure:
The 1H is compressed inside a tightening range.
Price is building higher lows into the descending trendline while pressing into the local high / VWAP area. EMAs are beginning to tighten, but the structure is still unresolved.
This is not a chase spot.
This is a compression spot.
Cycle Position:
ATOM looks like it is in a daily crossback with the 1H forming a potential base & break underneath resistance.
The next move depends on whether price can shift from compression into expansion with participation.
Scenarios:
🟢 Continuation
If ATOM accepts above the 1H range high and breaks through the descending compression line, I’d look for continuation toward the daily high area near 2.03–2.04, then potentially into the larger daily resistance zone around 2.22–2.24.
For this to stay clean, I want to see expansion with volume and price holding above the breakout area after the move.
🔴 Failure
If price rejects the range high again and loses the 1H higher-low structure, then this becomes failed compression.
Below the lower side of the 1H range, I’d expect price to rotate back toward the daily FVG / lower EMA area, with 1.94–1.92 as the key zone to watch.
Execution Mindset:
The trade is not the fact that ATOM is sitting under resistance.
The trade is whether participants accept price above this compression and prove that the daily crossback is turning into continuation.
I’m watching for a clean break, hold, and expansion — not trying to predict it before the market confirms.
Not a signal. Just how I’m reading structure and participation.
ATOM Is Approaching a Key Support Level !Following the major CH, ATOM made a bullish move and broke above an important bearish trendline. It is now pulling back toward this trendline.
Within the demand zone, you may look for buy/long opportunities after receiving proper confirmation. Be sure to manage your risk appropriately.
The targets are marked on the chart. We recommend moving your stop-loss to breakeven at the first target and securing a portion of your profits, so that any potential downside reversal does not erase your gains.
A daily candle close below the invalidation level will invalidate this bullish outlook.
If you would like us to analyze a coin or altcoin for you, first like this post, then comment the name of your altcoin below.
What is your opinion about COSMOS?
Cosmos (ATOM): Huge growth potential (258% Easy, 711% & Higher) The same bottom range has been now active for eight months, 242 days, since October 2025. This is where the market is preparing for the next cycle.
Eight months. Whatever happens next, it will be big, it is such a long time in preparation. Let's see.
Bitcoin produced a month long correction between 6-May and 6-June. At the same time, ATOMUSDT remains within the exact same price range.
In October 2025 Bitcoin crashed and Cosmos crashed. In February 2026, Bitcoin, Cosmos and everything else crashed. Last month, the market went through a shakeout, a retrace, a correction, no crash. You can tell because only a few projects did badly, most kept the same chart structure as ATOMUSDT and BTCUSDT.
On this chart the exact same range from February is still active and it was first activated in December 2025. All this to say, that the lack of new lows or bearish trend reveals a transition period, transition from bearish to bullish. A bull market comes next. It all starts now. Cosmos is going up, There is huge potential for growth.
Thank you for reading.
Namaste.
ATOMUSDT 1D#ATOM is currently trading within a descending triangle pattern on the daily chart. It has bounced perfectly from the triangle support and is now facing two major resistance levels ahead: the daily SMA200 and the triangle resistance.
In case of a breakout above both of these levels, the following upside targets could come into play:
🎯 $2.167
🎯 $2.396
🎯 $2.635
🎯 $2.873
🎯 $3.213
🎯 $3.645
⚠️ Always remember to use a tight stop-loss and maintain proper risk management.
ATOMUSDT: liquidity sweep before bullish moveThe Macro Picture 🗺️
ATOM just executed a textbook liquidity sweep below the $1.65 prior macro floor — the same level that anchored every higher-low since April. The early-June flush down to $1.55 cleared out the over-leveraged longs trapped beneath that structural support, then immediately snapped back with a violent reaction that has carried price to $1.92 in a handful of sessions. This is the kind of structural reset that bulls desperately need before any serious recovery attempt, and the speed off $1.55 says the sellers ran out of supply exactly where they expected to find more. Daily RSI bottomed under 30 and is curling back through the mid-zone with conviction.
The Setup ⚙️
The Sweep: The $1.55 stop hunt below the $1.65 broken floor was the liquidity grab that resets the playing field — every short who chased the breakdown is now sitting on losses, and bulls have the cleanest setup they have had in weeks.
The Reaction: The vertical bounce from $1.55 to $1.92 is too fast and too clean to read as a dead-cat move — buyers are stepping in aggressively to defend the post-sweep reversal, with RSI confirming the momentum shift.
The Trigger: The $2.00 mid resistance is the line that separates a relief bounce from a structural reversal. A clean daily close above $2.00 flips the prior equilibrium back into support and opens the path of least resistance toward the failed peak.
The Roadmap: Primary target sits at $2.30 — the failed peak rejected three times since February and where trapped sell stops from over-leveraged shorts still rest. Invalidation: a sustained daily close back below $1.55 would invalidate this bullish reversal thesis and confirm the breakdown continues into untested territory below.
ATOM LOOKS FUNDAMENTALLY BULLISHATOM Fundamentals Looks Bullish.. Things that happened to NASDAQ:ATOM since Cosmo Labs took over:
→ Robinhood listed ATOM spot trading
→ Revolut launched ATOM staking
→ eToro added ATOM staking
→ Bitstamp added ATOM spot trading
→ Binance delisted the ATOM/BTC margin pair (less manipulation)
→ Part of Mastercard's crypto partner program
ATOM Near Key Level — Breakout or Rejection Ahead ATOM / USDT is showing good momentum and is currently approaching a crucial key level that could determine its next major direction. If price gets rejected from this zone, we will look for a downside move toward the $1.52 target. However, if price successfully breaks through this level and confirms the breakout, the next upside target will be around $2.36. In these market conditions, patience is essential. Manage risk wisely, trade according to confirmation, and avoid overexposure. 📊🚀
ATOM USDT LONG SIGNALATOM /USDT – Trade Setup (long)
📈 Position Type:long
🕒 Timeframe: 15M
📊 Market: Futures
💰 Entry Zone:
1.770
🛑 Stop-Loss:
1.695
🎯 Take-Profit Targets:
• TP1: 1.822
• TP2: 1.898
• TP3: 1.972
• TP4:
. TP5:
⚙️ Leverage:
5–10
⚠️ After reaching TP1, move Stop-Loss to Entry Price.
📌 Risk Management:
Risk only 1–2% of your capital per trade.
Always confirm the setup on your chart before entry.
ATOMUSDT ascending trendline: targeting $2.68The Macro Picture 🗺️
ATOM has been carving a textbook ascending trendline since the April liquidity sweep at the $1.65 macro floor — a structural reset that cleared out the last over-leveraged longs from the descending leg off $2.68 and rebuilt the playing field from scratch. Every retest of that rising support has held, stacking a clean chain of higher lows that now slopes up directly into the $2.30 local cap. This is the kind of post-sweep recovery structure that desperately needs to be tested from above before the macro ceiling can come back into play, and price is sitting on the line right now.
The Setup ⚙️
The Trendline: The ascending support drawn from the April $1.65 low is the structural spine of this entire move — every dip has respected it, and bulls are defending it again at current. This is the dynamic floor the thesis hinges on.
The Trigger: The $2.30 local resistance is the lid that has rejected price twice already in May. A clean daily close above $2.30 flips the cap into support and opens the path of least resistance toward the macro ceiling.
The Reaction: Daily RSI is curling off the mid-zone after the recent pullback, signaling that momentum is resetting rather than breaking down — exactly the kind of cooling structure that precedes a continuation push.
The Roadmap: Primary target sits at $2.68 — the macro ceiling where January's structural peak was printed and where trapped sell stops still rest. Invalidation: a sustained daily close below the ascending trendline would invalidate this bullish thesis and reopen the path back toward the $1.65 macro floor.