In-depth trading ideas
ATOM Bullish Continuation: $2.30 Target in FocusATOM is maintaining a bullish continuation structure after successfully retesting its higher-low support area.
Price is holding above the important $1.62 horizontal support zone and is currently trading near $1.78 on the daily timeframe. As long as this support remains intact, the broader bullish structure continues to favor further upside.
Cosmos remains one of the key interoperability-focused blockchain ecosystems, built around the IBC protocol, Cosmos SDK, and CometBFT consensus. These technologies allow independent blockchains to communicate and transfer assets across the Cosmos ecosystem.
From a technical perspective, continued strength above $1.62 could open the way toward the $2.00 resistance level, followed by the larger $2.30 upside target.
Trading Levels
• Entry Zone: $1.58 – $1.62
• Take Profit 1: $2.00
• Take Profit 2: $2.30
• Stop Loss: $1.44
The bullish setup remains valid while ATOM continues to defend the $1.62 support area. A strong breakdown below this structure would weaken the current bullish scenario.
ATOM 8H – Testing Major Resistance ShelfCosmos is trading around 1.881 on the 8H timeframe after a sharp rally from the 1.335 demand zone that formed in early August, and price is now pressing directly into the 1.900 to 2.050 resistance shelf that capped the last major move back in May.
The rally off 1.335 has followed a clean ascending trendline the entire way, with price respecting that structure through several pullbacks in August before accelerating hard into September. This is the first real test of the May supply zone since the range began, and the reaction here will likely define the next several weeks of price action.
Price is currently pushing against 1.900 with a wick already tagging the low end of the 2.000 to 2.050 zone, showing early signs of a breakout attempt rather than outright rejection.
Key Levels To Watch:
→ 2.050 May spike high, major resistance above
→ 2.000 Psychological level, upper boundary of supply zone
→ 1.900 Immediate resistance, prior swing high
→ 1.881 Current price, testing the shelf
→ 1.335 Trendline origin, demand zone boundary
A break and hold above 2.050 confirms the shelf is broken and opens the door to a continuation move with no significant resistance until much higher levels, validating the strength of the trendline structure that built this entire rally.
Rejection from this zone sends price back down to retest the trendline, with the first meaningful support sitting near the 1.530 to 1.570 area where the trendline currently runs, and a deeper flush bringing 1.335 back into focus.
Hold above 2.050 and ATOM confirms a breakout with room to run. Rejection here keeps the pair range bound with the trendline as the next key test.
Structure favors the bulls given the strength of the move off 1.335, but the reaction at this shelf is the deciding factor for the next leg.
ATOM (Cosmos) bear market cycle ends: Enter the bull-run phase ATOMUSDT (Cosmos) hit bottom late July then it started to recover. Some projects hit bottom in June while still others did so in February 2026, and still others did so last year (Nov-Dec 2025).
If you missed one of the top performers, new opportunities are made available all of the time.
For example: See how it is not possible anymore to buy ZEC (Zcash) or HYPE (Hyperliquid) near support, this opportunity is forever gone. But here we have ATOM, and there is also XLM, DOT, ADA, POL, DASH, ZEN, SUI, SEI, SOL, ICP, AVAX, ETC, FET and all those other projects I've been tracking and sharing daily for you.
The $25 target opens up 1,285% profits potential and also the highest price since April 2022. The all-time high stands at $44.8. This is a level that is far away and we will visit only as we get closer to higher prices. Right now the focus is on the bottom recovery and bullish reversal process.
A new all-time high is a high probability scenario in the coming years, something almost unavoidable based on what we've seen so far.
We've seen how the market continues to evolve and how many projects are decoupling from the broader market cycle. We've been seeing how there is now a mix of bearish and bullish projects, while in the past the entire market, basically, would be either bullish or bearish; there wasn't much room to move around.
The lesson to extract is this: There is no need to rush; endless opportunities are always made available.
Trading success affirmation: I always take my time to open a position, there is never any hurry. If I have to hurry, I know something is off. With thousands and thousands of trading pairs, why would I have to rush?
Take the time to plan; the market is here to stay.
Take your time; but, make sure to buy-now. While there are endless opportunities, timing is of the essence. Get the best possible prices before it is too late. Time is running out. We are about to enter a type of bull-run phase.
Thank you for reading.
Namaste.
ATOM:USDT NEW TREND IN PROCESSING FOR MORE..ATOM:USDT has a new posittive trend on the low time frame, which can confirm later also to the high trend price action, we have scan some stracture volume, which can allow ATOM(COSMOS,to increase further in trend.
Chart trend
into the chart you will see the levels we focus on the cming time frame.
#ATOM/USDT | ATOMUSDT Preparing for a Potential Drop#ATOM
The price is moving within a descending channel on the 1-hour timeframe and has reached the lower boundary. It is now poised for a bounce and is expected to retest this boundary.
The Relative Strength Index (RSI) indicates a downward trend, which is likely to continue given the overbought conditions.
A key support zone (in green) has been identified at 1.40. The price has bounced off this zone several times, making it a strong support level.
The price is trending towards the 100-period moving average, which we are approaching. This trend supports an upward move.
Entry Price: 1.55
First Target: 1.57
Second Target: 1.61
Third Target: 1.66
You can close at the second target or wait for the third target to be reached. The choice is yours.
Stop Loss: At the resistance zone (in green).
Remember this simple rule: Money Management.
Any questions? Please leave a comment.
Thank you.
ATOM/USDT H2: Consolidation before potential growth🎯 TP1: $1.4367 (+1.03%) │ TP2: $1.4514 (+2.07%)
🛑 SL: $1.3953 (-1.88%) │ R/R: 1 : 1.1
⚠️ SL is placed beyond the nearest candle tails to reduce the risk of accidental triggering
FUNDAMENTAL BACKGROUND
ATOM is trading without its own catalysts, following the general sentiment of the altcoin market. BTC and ETH are showing sideways movement, limiting the upside potential for altcoins. The Fear & Greed Index at 38/100 indicates restrained risk appetite. The upcoming Federal Reserve (FOMC) minutes on 19.08.2026 may add volatility, but the market remains cautious for now.
TECHNICAL PICTURE
Price at $1.4220 is below key EMA 20 and EMA 50 at $1.46, indicating resistance. ADX 21.5 confirms a moderate trend with sellers having the upper hand. VWAP $1.46 acts as an additional barrier for upward movement. MACD is near the zero line, signaling market indecision.
PROBABILITY MODEL
Bearish scenario probability — 38%, bullish — 36%, flat — 26%. The model estimates growth potential with 50% confidence, considering the current consolidation in the mid-range ($1.3650–$1.5700).
DIRECTION
🟢 BUY. Technical levels and the probability model suggest potential upside from the current price.
ATOM USDT LONG SIGNAL58. ATOM/USDT – Trade Setup (LONG)
📈 Position Type: LONG
🕒 Timeframe: 1H
📊 Market: Futures
💰 Entry Zone:
1.453
1.409
🛑 Stop-Loss:
1.389
🎯 Take-Profit Targets:
• TP1: 1.498
• TP2: 1.548
• TP3: 1.595
• TP4. 1.650
Tp5.
⚙️ Leverage:
5*10
▫️ After TP1, move SL to Entry + 0.2%.
▪️ Exit Plan:
• 40% at TP1
• 20% at TP2
• 20% at TP3
20% at TP4
📌 Risk Management:
Risk only 1–2% of your capital per trade.
⚠️ Always check and confirm the setup on your chart before entering the trade.
ATOM: Massive Descending Wedge Formation, These Levels to Watch!Hello Community,
welcome to my new analysis of ATOM from a weekly timeframe perspective. In the past times I have detected really interesting setups in the market to make a profit from trading them. The cryptocurrency market offers strong cryptocurrency gems in any market phase, which could turn into profitable trading opportunities along the way. One of them is ATOM. In this cryptocurrency, I detected interesting signs that could lead to major bullish expansions in the upcoming times.
When looking at my chart, we can see how ATOM forms this gigantic descending wedge formation. Within this wedge, it has already finalized the wave count and now bounced within the ascending support trendline, primed for a final breakout above the upper boundary of the formation. Such a breakout above the upper boundary of the formation will confirm the target zones and set up a strong bullish expansion towards the upside once completed.
There is also a bullish MACD divergence taking place here. The MACD is trading considerably higher than the previously established low in the MACD. This dynamic is also corresponding with the higher low in the actual price action of ATOM. Such a MACD divergence is a strong sign for a bullish reversal brewing, with the potential to reach higher levels. Once the bullish momentum is established and ATOM continues with the acceleration of bullish momentum, higher targets than the projected descending wedge targets are also likely to be reached.
In this manner, thank you a lot for watching!
The support is highly appreciated.
VP
AtomGenesis 1:3 — “And God said, Let there be light: and there was light.”
ATOM hath wandered long in darkness, forgotten by the multitude and mocked by those who worship only the rising sun.
Yet creation beginneth not with noise, but with a word.
From the dust shall ATOM gather itself once more. That which was scattered shall become whole, and that which seemed without form shall be given purpose.
When the light returneth, 1.58 shall stand as the promised ground.
The darkness comprehendeth it not.
ATOM : Breakdown Retest Could Trigger Another Move LowerATOM has broken below the $1.52–$1.53 support zone and is now retesting it as resistance.
As long as price stays below this area, the bearish structure remains valid, with downside targets at $1.37 and $1.26.
Trading Levels
Direction: Short
Entry: $1.52–$1.53
TP1: $1.37
TP2: $1.26
Stop Loss: $1.55
Bias remains bearish below $1.52–$1.53.
ATOM: $1.372, up ~7% in 24h!BINANCE:ATOMUSDT is trading at $1.372, up roughly 7% in the last 24 hours, after a sharp move from ~$1.23 to a high of $1.395. Price has already pulled back once to retest the $1.286–$1.268 order block — the zone where this breakout candle originated — before bouncing.
News to know: Upbit, South Korea's largest exchange, is suspending ATOM deposits and withdrawals starting August 5 at 9:00 AM UTC, standard procedure ahead of a Cosmos network upgrade. That's a real short-term liquidity event — thinner books and sharper wicks are common around scheduled suspensions like this. Longer-term, ATOM's narrative is split: high staking inflation (7–20% annually) keeps drawing bearish commentary, while a proposed shift to fee-based tokenomics and renewed interest in Cosmos' interoperability stack is fueling this leg up.
Technically: price is well above the level this setup is built on. This is a retracement plan, not a signal to buy the current candle.
📍 Entry: $1.286
🛑 Stop Loss: $1.261 → -1.94%
🎯 Target 1: $1.338 → +4.04%, ~2.1:1 R:R
🎯 Target 2: $1.411 → +9.72%, ~5:1 R:R
Risk note: the biggest mistake here is chasing the $1.372 print with this plan's $1.261 stop attached — you'd be taking on the same dollar risk for a much worse entry. If the order block doesn't get retested, this specific trade doesn't exist. Size at 1-2% account risk, and watch for volatility around the Aug 5 Upbit suspension regardless of your entry.
Not financial advice — do your own research.
#Cosmos #ATOM
ATOM 1D – Descending Channel Bounce Off Lower BoundaryATOM on the 1D timeframe is currently trading around 1.944 after dropping from the June high near 2.300 through the entire channel structure and into the lower boundary near 1.230–1.270, then bouncing sharply back toward the 1.383–1.410 horizontal resistance zone that has been a consistent pivot throughout the post-June decline.
The chart shows a descending channel originating from the December 2025 high near 2.700, with the upper trendline connecting that high through the March recovery high near 2.500 and the June high near 2.200–2.300, while the lower trendline caught the February low near 1.680, the April low near 1.640, and now the late July low near 1.230–1.270 before the current bounce. Price spent December through June oscillating between the two channel boundaries, with each recovery reaching the upper trendline before rolling over. The June high near 2.200–2.300 was the last meaningful upper trendline test before a sharp selloff accelerated through July, cutting through the 1.800, 1.640, 1.520, and 1.410 levels without a meaningful bounce before reaching the lower trendline. A horizontal reference near 1.383–1.410 has been a recurring pivot across multiple timeframes and is now the first meaningful resistance above the bounce low.
The lower trendline has now produced a sharp recovery candle after the most sustained and uninterrupted decline seen inside this channel, with the speed of the drop suggesting significant selling pressure that the bounce has not yet confirmed is exhausted.
Key Levels To Watch
→ 2.600–2.700 December 2025 high, major resistance above
→ 2.200–2.300 June high, upper channel resistance
→ 1.900–2.000 Prior support zone, now resistance
→ 1.580–1.640 Mid-channel resistance zone
→ 1.410–1.460 Descending upper trendline overlap, resistance (dynamic)
→ 1.383–1.410 Horizontal pivot, current resistance test
→ 1.230–1.270 Lower channel boundary, recent bounce low
A hold above the lower channel boundary and a confirmed daily close above 1.383–1.410 would suggest the lower trendline is providing meaningful support, opening a recovery toward 1.580–1.640 and potentially the upper channel trendline near 1.900–2.000 on a more sustained move.
A rejection at 1.383–1.410 and a return toward the lower channel boundary near 1.230–1.270 would indicate the bounce was a relief move rather than a structural recovery, and a confirmed daily close below 1.230 would signal a full channel breakdown with no visible support beneath.
Lower boundary bounce after the sharpest decline inside the channel, first resistance test now in progress. Break above 1.383–1.410 → recovery open toward 1.580–1.640 and above. Reject here and lose 1.230–1.270 → channel breakdown, open downside below. Bias neutral to cautiously bullish at lower boundary. Shift bearish only on confirmed daily close below 1.230–1.270.
ATOM 4H — Breakout Test at 1.350–1.360ATOM has accelerated into 1.350–1.360 after a high-volume impulse from the 1.22 base. This is the first real decision point, not a place to chase.
Acceptance above 1.360 keeps 1.405 in view. A controlled retest of 1.315–1.330 would be cleaner continuation evidence. A 4H close below 1.280 breaks the recovery structure and exposes 1.220.
Bybit OI is flat while Binance OI is lower, so the move looks more like spot demand and short covering than fresh leveraged longs.
Maps, not predictions.
ATOM: The Monthly BUY Signal Has Fired — But This Is Still a HigCOSMOS / ATOM USDT has fallen from above $40 to approximately $1.27, erasing almost the entire previous cycle’s valuation. After years of lower highs and lower lows, the Master Buy Scanner is now showing a rare alignment between the monthly and 3-week timeframes.
This is the strongest technical setup ATOM has displayed in a long time—but it is still an early contrarian signal, not a confirmed macro reversal.
Master Buy Scanner V2
Monthly timeframe
Score: 3/3
Signal: BUY
Action: BUY / BUILD
Decision: INVEST
BUY state: SETUP READY
Entry quality: OK — 55%
Setup maturity: FAILED
Position size: STARTER 25%
WT cross: YES
Band 1: GREEN
Combined band: GREEN 7/10
Bands synchronized: YES
Cycle: FIRED
Bars since BUY: 2
WT1 / WT2: -52.73 / -52.42
3-week timeframe
Score: 3/3
Signal: BUY
Action: BUY / BUILD
Decision: INVEST
Entry quality: OK — 55%
Position size: STARTER 25%
WT cross: YES
Combined band: GREEN 7/10
Bands synchronized: YES
Cycle: FIRED
Bars since BUY: 4
WT1 / WT2: -50.73 / -50.49
The important development is the simultaneous bullish alignment across both long-term timeframes. Momentum remains deeply depressed, the WT cross has occurred, both lower bands are synchronized, and the cycle signal has fired.
However, the monthly setup maturity is still classified as FAILED. The scanner is therefore recommending a 25% starter position, not full exposure.
The fundamental thesis
Cosmos remains one of the most established blockchain technology stacks, with a 2026 roadmap focused on higher performance, broader IBC connectivity—including Solana and EVM/L2 networks—and enterprise-oriented functionality. However, adoption of the Cosmos technology stack does not automatically translate into demand for ATOM. That disconnect between ecosystem utility and token value capture remains the central investment risk.
The Cosmos Hub team is now explicitly trying to address this weakness. Its developing roadmap focuses on turning the Hub into an economic center, launching new products directly on the Hub, expanding IBC through the Hub, exploring real-world assets and redesigning ATOM’s tokenomics around more sustainable value accrual.
There are already some early value-capture initiatives. Under the Injective USDC arrangement, the Cosmos Hub is expected to receive part of the issuance incentives generated by USDC transferred into Cosmos through IBC, with those proceeds used to buy ATOM for the community pool. This is directionally positive, although it remains too small and early to justify a major repricing by itself.
The tokenomics problem
Recent research commissioned by Cosmos Labs found that reward-related selling was smaller than commonly assumed and that most identifiable sell-like flows were concentrated among a relatively small number of large holders routing ATOM toward centralized exchanges.
Nevertheless, the research also found that the Cosmos Hub releases a substantially larger immediately liquid reward footprint than comparable proof-of-stake networks. Inflation may not be the sole cause of ATOM’s decline, but dilution and weak value capture remain unresolved structural issues. Concrete Phase 2 tokenomics changes have not yet been finalized.
That makes the investment case dependent on two separate developments:
The technical bottom must hold.
The Hub must demonstrate that future ecosystem activity creates recurring demand or revenue for ATOM.
Key technical levels
Immediate support: $1.10–$1.20
Macro invalidation: sustained close below $0.90–$1.00
First resistance: $1.50–$1.65
Initial confirmation: $2.00–$2.25
Major recovery zone: $3.80–$4.50
Structural resistance: approximately $6.50
The current signal becomes significantly more convincing if ATOM can reclaim $1.50–$1.65, establish a higher low and subsequently move above $2.00.
The $6.50 level remains the real macro dividing line. Below it, ATOM is still trading within a long-term damaged structure, regardless of short-term rallies.
My classification: CONTRARIAN BUY / BUILD
The alignment between the monthly and 3-week signals is noteworthy, particularly with both cycles fired and momentum deeply oversold.
But the scanner’s 55% entry quality, failed setup maturity and 25% position-size recommendation correctly reflect the uncertainty. This looks suitable for a small initial allocation followed by gradual additions only if price confirms the reversal.
What would you do?
A) Start building a small position around $1.25
B) Wait for ATOM to reclaim $1.60
C) Avoid it until the tokenomics redesign is finalized
Master Buy Scanner V2:
This is not financial advice. Crypto assets are highly volatile, and an oversold BUY signal does not guarantee that a durable bottom has formed.
ATOM at macro floor: base recovery toward $1.6367The Macro Picture 🗺️
ATOM ground down from the $2.2955 macro ceiling all the way to the $1.4070 macro floor and has flattened onto it at $1.4169. The long, steady bleed has given way to a base right on support — exhaustion rather than continuation.
The Setup ⚙️
The Accumulation Zone 🟢
$1.4070–1.4169 is where the selling has dried up. Macro Support has held on retest, and this is the demand shelf a recovery would build from.
The Decision Point 🔴
$2.0312 (Local High) is the structural gate far above. Before it, the $1.6367 measured-move target is the first objective — reclaiming it proves buyers are stepping back in.
The Roadmap 🛣️
Hold the $1.4070 floor → recover toward $1.6367 as the first leg up. Invalidation is a clean daily close below $1.4070 — that voids the accumulation thesis.
This is a textbook DCA Accumulation Zone setup: scale in across the $1.4070–1.4169 band and let the base do the work.
More setups in profile.
#ATOM #Cosmos #crypto #trading #TA #3Commas #DCA
#ATOMUSDT (Daily)#ATOMUSDT (Daily)
ATOM could continue its downward movement and potentially reach lower price levels.
If price reaches the red zone and confirmation appears, a short position can be taken targeting the blue zone.
At the blue zone, there is strong demand, which may cause a temporary bullish reaction.
This setup offers a potential R:R of around 1:4, suitable for 10x leverage, but confirmation is required.
We are keeping an eye on it.
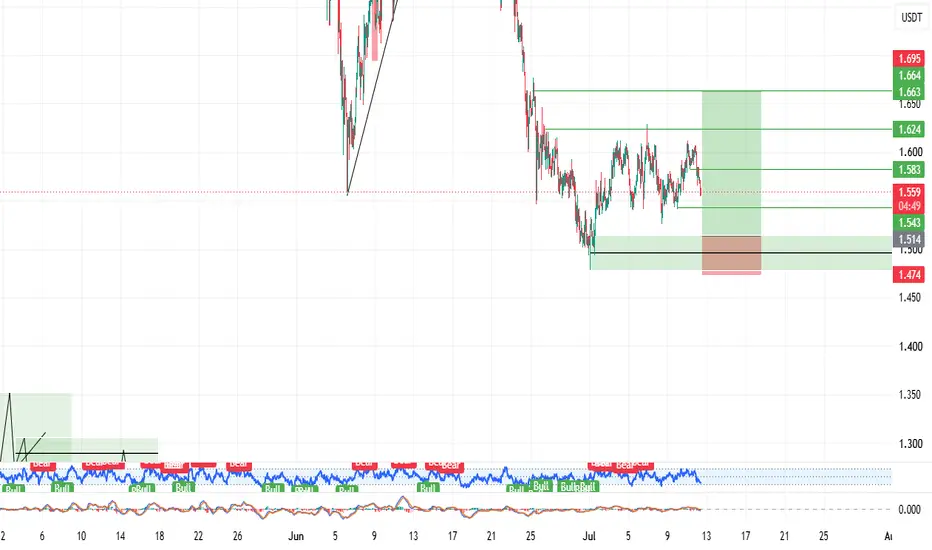
ATOM USDT LONG SIGNAL#50. ATOM/USDT – Trade Setup (LONG)
📈 Position Type: LONG
🕒 Timeframe: 1 H
📊 Market: Futures
💰 Entry Zone:
1.514
🛑 Stop-Loss:
1.470
🎯 Take-Profit Targets:
• TP1: 1.543
• TP2: 1.582
• TP3: 1.624
• TP4: 1.664
TP5:
TP6:
⚙️ Leverage:
5- 10
⚠️ After reaching TP1, move Stop-Loss to Entry Price.
📌 Risk Management:
Risk only 1–2% of your capital per trade.
Always confirm the setup on your chart before entry
ATOM: downtrend leans on the $1.5 floorThe Macro Picture 🗺️
ATOM has been under steady distribution since its $2.5 March peak, carving a series of lower highs down to the $1.5–$1.55 floor it's testing now. Unlike an oversold washout that snaps back, momentum here is merely soft — RSI hovering in the high-30s without a decisive turn. Price sits at $1.6 just above the floor, and this level is now the line that decides whether buyers can force a relief bounce or sellers press the breakdown.
The Setup ⚙️
The Reaction: The $1.5 floor has absorbed the latest leg down and price has ticked up to $1.6, but the bounce is shallow and RSI refuses to lift with conviction. Sellers still cap every push, and the structure of lower highs remains firmly intact overhead.
The Trigger: A reclaim of the $1.8 breakdown level would be the first real sign the downtrend is stalling, opening a move back toward the $2.0 macro resistance. Failure to hold $1.5 on a closing basis tips the balance the other way, exposing the open air beneath the floor.
The Roadmap: Primary target on a bounce sits at $1.8 — the broken support turned resistance, where the green roadmap points if buyers reclaim it. Invalidation: a sustained 1D close below $1.5 would confirm the breakdown and open a flush toward $1.45 and lower.
ATOM USDT LONG SIGNAL#10
ATOM/USDT – Trade Setup (LONG)
📈 Position Type: LONG
🕒 Timeframe: 1 H
📊 Market: Futures
💰 Entry Zone:
1.604
1.568
🛑 Stop-Loss:
1.530
🎯 Take-Profit Targets:
• TP1: 1.635
• TP2: 1.676
• TP3: 1.716
• TP4: 1.760
TP5: 1.800
TP6:
⚙️ Leverage:
5- 10
⚠️ After reaching TP1, move Stop-Loss to Entry Price.
📌 Risk Management:
Risk only 1–2% of your capital per trade.
Always confirm the setup on your chart before entry
ATOM HIGHLY UNDERVALUED HERENASDAQ:ATOM is officially shifting gears and accelerating
Fundamental progress NASDAQ:ATOM holders have been waiting for.
RWAs taking off — Unlocking major institutional assets (BlackRock, Securitize & more) through powerful cross-chain tech
IBC firepower — Trustless, low-fee connections expanding fast to Solana, EVM L2s & big CBDC partners
Proven Tokenomics — Gauntlet’s data confirms sell pressure is mainly CEX-driven, not from stakers. Strong long-term foundation!
Builder momentum — Top hackathon winners like Mad Votes and IBC games heading straight to mainnet. Pure infrastructure delivery. Zero hype — all execution.
Daily compounding + REStake while the team builds real future value 💪
ATOMUSDT oversold reaction: targeting $1.85The Macro Picture 🗺️
ATOM completed the bearish breakdown — the $1.55 structural floor lost on a sustained daily close, and price extended into the $1.50 area where no historical reaction points exist on visible structure. But that same break drove daily RSI down to 30 for the second time in a month, mirroring the exhaustion print from the early-June sweep that kicked off a vertical bounce from $1.55 to $2.05. The structure is now offering bulls the same setup it did three weeks ago: a violent break into thin liquidity, momentum fully exhausted, and a freshly-flipped resistance level sitting just overhead. This is the kind of post-capitulation reset where the path of least resistance can shift fast.
The Setup ⚙️
The Reaction: Daily RSI at 30 is the signal that wasn't on the table yesterday — the breakdown is now structurally complete from a momentum standpoint, and every prior 30 print on this chart has marked a reaction low rather than a continuation point.
The Floor: The $1.50 fresh low is where the breakdown extended into untested territory and stalled. Bulls defending this level keeps the exhaustion thesis alive; another sustained close below it confirms continuation instead.
The Trigger: The $1.55 just-broken structural floor is the first reclaim level — a clean daily close back above $1.55 flips yesterday's breakdown into a failed move and opens the path back through the broken structure stack above.
The Roadmap: Primary target sits at $1.85 — the broken decision zone where the prior post-sweep base lost support and where trapped sellers from the breakdown will be forced to cover. The $1.65 broken floor sits in between as the first reclaim checkpoint. Invalidation: a sustained daily close back below $1.50 would invalidate this exhaustion thesis and confirm the breakdown continues into untested territory.