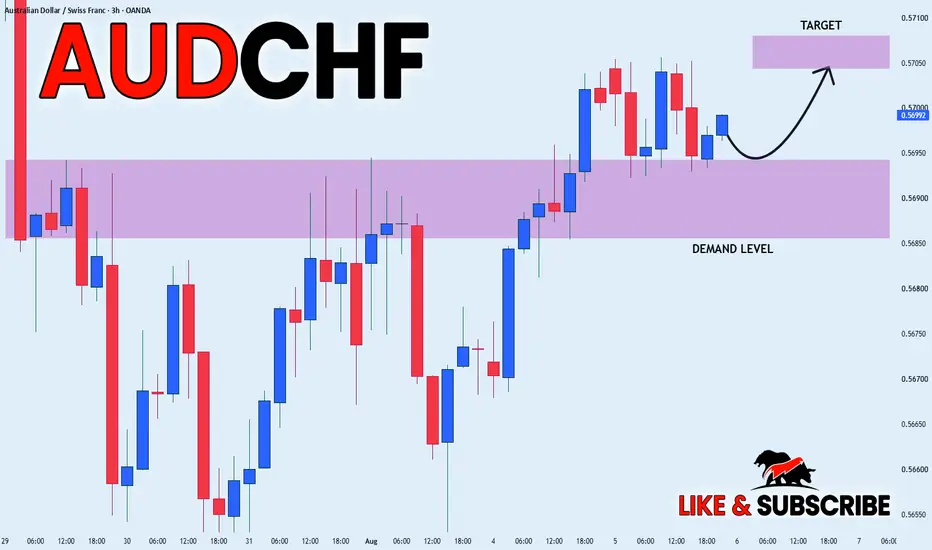
AUDCHF Will Go Lower From Resistance! Short!
Here is our detailed technical review for AUDCHF.
Time Frame: 4h
Current Trend: Bearish
Sentiment: Overbought (based on 7-period RSI)
Forecast: Bearish
The market is approaching a significant resistance area 0.572.
Due to the fact that we see a positive bearish reaction from the underlined area, I strongly believe that sellers will manage to push the price all the way down to 0.569 level.
P.S
Overbought describes a period of time where there has been a significant and consistent upward move in price over a period of time without much pullback.
Like and subscribe and comment my ideas if you enjoy them!
Australian Dollar / Swiss Franc
No trades
No trades
In-depth trading ideas
AUD/CHF Bearish Breakdown Signals Potential Move Toward 0.5670AUD/CHF is showing short-term bearish pressure after rejecting the recent highs around 0.5699–0.5700. Price has formed a consolidation range (highlighted in yellow) at the top of the recent uptrend, but repeated failures to break higher suggest buyers are losing momentum.
Technical Outlook
The pair rallied strongly from the 0.5655 demand zone, creating a sequence of higher highs and higher lows.
Price is now breaking below the lower boundary of the consolidation box, indicating a potential bearish continuation.
The highlighted gray demand/support zone (0.5693–0.5694) is being tested. A decisive candle close below this area would confirm increased selling pressure.
The Ichimoku cloud is flattening around current price, suggesting weakening bullish momentum and a possible trend transition.
Bearish Scenario
If sellers maintain control and price closes below 0.5693, the next downside targets are:
Target 1: 0.5686
Target 2: 0.5678
Target 3: 0.5670
A break below 0.5670 could expose deeper retracement toward the previous swing support.
Bullish Invalidation
The bearish outlook would weaken if buyers reclaim 0.5700 and achieve a sustained breakout above the consolidation range. In that case, AUD/CHF could extend toward:
0.5712
0.5720
Trading Plan
Bias: Bearish
Entry: On a confirmed close below 0.5693, or after a retest of the broken support as resistance.
Stop Loss: Above 0.5701–0.5703
Take Profit: 0.5686 → 0.5678 → 0.5670
AUDCHF Trigger Watch | Breakout Pullback into SupportAUDCHF is moving into an area worth watching.
After breaking and closing above a well-defined consolidation channel, price has pulled back to retest the previous resistance level, which may now act as support. We also have confluence with the 50 EMA, while Daily Momentum is showing divergence.
We're not entering yet.
What we're waiting for is a bullish engulfing candle. If that develops, we should also see the Momentum Hook, giving us another important piece of confirmation.
At that point, we'll evaluate the complete VMS 2.0 checklist:
✅ Structure
✅ Rejection at Support
✅ Divergent Momentum
✅ Momentum Hook
✅ Volume Confirmation
✅ Risk-to-Reward
If everything aligns, this could become a quality setup.
If not, we simply continue waiting.
Preparation. Execution. Consistency.
AUDCHF What Next? BUY!
My dear friends,
Please, find my technical outlook for AUDCHF below:
The price is coiling around a solid key level - 0.5757
Bias - Bullish
Technical Indicators: Pivot Points High anticipates a potential price reversal.
Super trend shows a clear buy, giving a perfect indicators' convergence.
Goal - 0.5763
Safe Stop Loss - 0.5751
About Used Indicators:
The pivot point itself is simply the average of the high, low and closing prices from the previous trading day.
Disclosure: I am part of Trade Nation's Influencer program and receive a monthly fee for using their TradingView charts in my analysis.
———————————
WISH YOU ALL LUCK
AUDCHF H1 | Bullish Bounce Off Key SupportMomentum: Bullish
Price is currently above the ichimoku cloud.
Buy entry: 0.57393
- Overlap support
- 61.8% Fib retracement
Stop Loss: 0.57285
- Swing low support
Take Profit: 0.57537
- Swing high resistance
High Risk Investment Warning
Stratos Markets Limited (fxcm.com/uk), Stratos Europe Ltd (fxcm.com/eu):
CFDs are complex instruments and come with a high risk of losing money rapidly due to leverage. 65% of retail investor accounts lose money when trading CFDs with this provider. You should consider whether you understand how CFDs work and whether you can afford to take the high risk of losing your money.
Stratos Global LLC (fxcm.com/en): Losses can exceed deposits.
Please be advised that the information presented on TradingView is provided to FXCM (‘Company’, ‘we’) by a third-party provider (‘TFA Global Pte Ltd’). Please be reminded that you are solely responsible for the trading decisions on your account. Any information and/or content is intended entirely for research, educational and informational purposes only and does not constitute investment or consultation advice or investment strategy. The information is not tailored to the investment needs of any specific person and therefore does not involve a consideration of any of the investment objectives, financial situation or needs of any viewer that may receive it. Past performance is not a reliable indicator of future results. Actual results may differ materially from those anticipated in forward-looking or past performance statements. We assume no liability as to the accuracy or completeness of any of the information and/or content provided herein and the Company cannot be held responsible for any omission, mistake nor for any loss or damage including without limitation to any loss of profit which may arise from reliance on any information supplied by TFA Global Pte Ltd.
Stratos Trading Pty. Limited (fxcm.com/au):
Trading FX/CFDs carries significant risks. FXCM AU (AFSL 309763), please read the Financial Services Guide, Product Disclosure Statement, Target Market Determination and Terms of Business at fxcm.com/au
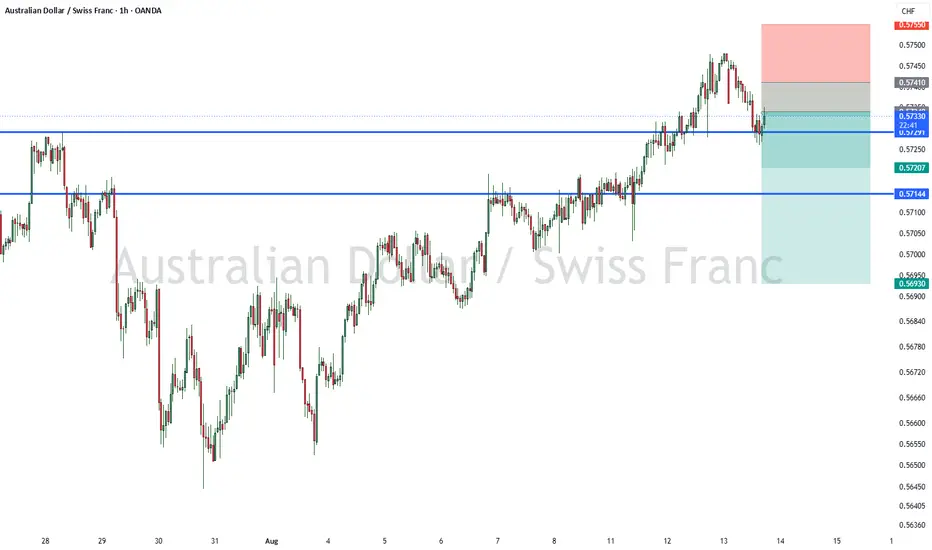
AUD/CHF Sell Setup – Bearish Rejection 🔴 AUD/CHF Sell Signal
Sell Zone: 0.57340 – 0.57410
Stop Loss: 0.57550
🎯 Targets:
TP1: 0.57200
TP2: 0.56930
📉 AUD/CHF is approaching a potential resistance zone, presenting a possible selling opportunity. If price rejects the 0.57340–0.57410 zone and bearish momentum develops, the pair could move toward 0.57200, followed by the extended target at 0.56930.
Consider securing partial profits at TP1 and allowing the remaining position to run toward TP2 while managing risk according to your trading plan.
Risk Disclaimer: Forex trading involves substantial risk. Always use proper risk management and never risk more than you can afford to lose.
AUDCHF 1H — Bullish Continuation SetupAUDCHF is maintaining a broader upward structure on the 1H timeframe, with price advancing along a rising support trendline and holding around the 50 EMA.
The recent move has produced a pullback from the 0.5740–0.5750 area, bringing price back toward the underlying support structure. This pullback is occurring after a sustained sequence of higher highs and higher lows, making the current area important for the next potential leg higher.
📈 Technical Structure
Current price: ~0.5727
50 EMA: ~0.5720
Primary upside objective: 0.5805
Key structure: Rising trendline with higher lows
The 50 EMA is currently positioned close to the rising support, creating a confluence area beneath price. Meanwhile, RSI has fallen toward 33, showing that the recent pullback has significantly cooled momentum and brought the indicator closer to oversold territory.
This combination leaves room for buyers to regain momentum if the underlying bullish structure continues to hold.
🎯 Upside Scenario
The primary focus is a continuation of the broader bullish structure toward 0.5805, where the projected target zone is positioned.
The current pullback can provide the market with an opportunity to establish another higher low before attempting to extend the existing advance.
Bullish bias while the ascending structure continues to support price, with 0.5805 as the projected upside objective.
AUDCHF - CATCHING reversal sentiments of the instrument is 94% which indicates possible trend reversal
on 1H we see the market making Bearish Divergence indicating trend exhaustion.
we on the 15m time frame entered the marked after break of LH. we enter into the market at CMP and take 1:3 R:R ratio.
AUDCHF Sell Setup – Quick Bearish Move🔴 AUD/CHF Sell Signal
Entry: 0.57140
Stop Loss: 0.57160
Take Profit: 0.57000
📉 AUD/CHF is showing a potential bearish setup with a tight risk level. If price rejects the entry area and bearish momentum continues, the pair could move toward the 0.57000 target.
Manage your position carefully due to the tight stop loss and follow proper risk management.
Risk Disclaimer: Forex trading involves substantial risk. Always use proper risk management and never risk more than you can afford to lose.
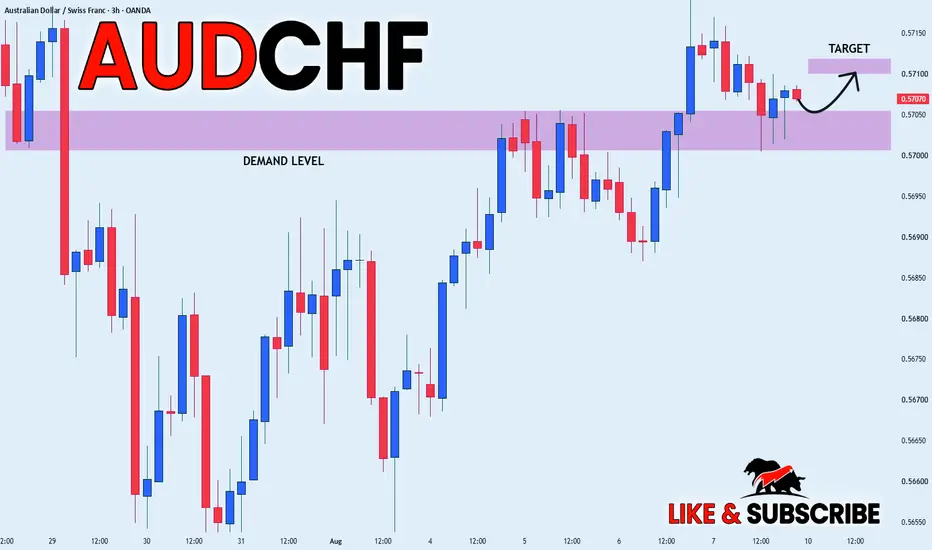
AUDCHF Will Go Lower! Sell!
Take a look at our analysis for AUDCHF.
Time Frame: 1h
Current Trend: Bearish
Sentiment: Overbought (based on 7-period RSI)
Forecast: Bearish
The market is on a crucial zone of supply 0.571.
The above-mentioned technicals clearly indicate the dominance of sellers on the market. I recommend shorting the instrument, aiming at 0.570 level.
P.S
Please, note that an oversold/overbought condition can last for a long time, and therefore being oversold/overbought doesn't mean a price rally will come soon, or at all.
Like and subscribe and comment my ideas if you enjoy them!
AUDCHF: Swing Trading & Technical Analysis
Looking at the chart of AUDCHF right now we are seeing some interesting price action on the lower timeframes. Thus a local move down seems to be quite likely.
Disclosure: I am part of Trade Nation's Influencer program and receive a monthly fee for using their TradingView charts in my analysis.
❤️ Please, support our work with like & comment! ❤️
Buyers preparing for the next leg higher?AUD/CHF could fall toward the pivot, which acts as an overlap support and could bounce toward the pullback resistance.
Pivot: 0.56865
1st Support: 0.56605
1st Resistance: 0.57256
Disclaimer:
The opinions given above constitute general market commentary and do not constitute the opinion or advice of IC Markets or any form of personal or investment advice.
Any opinions, news, research, analyses, prices, other information, or links to third-party sites contained on this website are provided on an "as-is" basis, are intended to be informative only, and are not advice, a recommendation, research, a record of our trading prices, an offer of, or solicitation for, a transaction in any financial instrument and thus should not be treated as such. The information provided does not involve any specific investment objectives, financial situation, or needs of any specific person who may receive it. Please be aware that past performance is not a reliable indicator of future performance and/or results. Past performance or forward-looking scenarios based upon the reasonable beliefs of the third-party provider are not a guarantee of future performance. Actual results may differ materially from those anticipated in forward-looking or past performance statements. IC Markets makes no representation or warranty and assumes no liability as to the accuracy or completeness of the information provided, nor any loss arising from any investment based on a recommendation, forecast, or any information supplied by any third party.
AUDCHF is Nearing a decent support area!Hey Traders, in today's trading session we are monitoring AUDCHF for a buying opportunity around 0.56800 zone, AUDCHF is trading in an uptrend and currently is in a correction phase in which it is approaching the trend at 0.56800 support and resistance area.
Trade safe, Joe.
AUD/CHF BEARS ARE GAINING STRENGTH|SHORT
Hello, Friends!
Bearish trend on AUD/CHF, defined by the red colour of the last week candle combined with the fact the pair is overbought based on the BB upper band proximity, makes me expect a bearish rebound from the resistance line above and a retest of the local target below at 0.566.
Disclosure: I am part of Trade Nation's Influencer program and receive a monthly fee for using their TradingView charts in my analysis.
✅LIKE AND COMMENT MY IDEAS✅
AUDCHF Expected Growth! BUY!
My dear friends,
Please, find my technical outlook for AUDCHF below:
The instrument tests an important psychological level 0.5662
Bias - Bullish
Technical Indicators: Supper Trend gives a precise Bullish signal, while Pivot Point HL predicts price changes and potential reversals in the market.
Target - 0.5671
Recommended Stop Loss - 0.5656
About Used Indicators:
Super-trend indicator is more useful in trending markets where there are clear uptrends and downtrends in price.
Disclosure: I am part of Trade Nation's Influencer program and receive a monthly fee for using their TradingView charts in my analysis.
———————————
WISH YOU ALL LUCK
AUD/CHF: Bullish POI ReactionOANDA:AUDCHF – Liquidity Sweep into POI Zone
Overall market context is still heavily bullish.
Reaction: We just had a liquidity sweep into our key 4H demand zone followed by a strong upside reaction.
Next Move: Price is pressing against the internal structure high. We don't have a confirmed ChoCh close yet, but the speed of this rejection gives price plenty of room to expand higher.
Watching closely for structure confirmation before targeting the upper liquidity pools.
Could we see a reversal from here?AUD/CHF is rising toward the resistance, which is a pullback resistance and could reverse from this level to our take profit.
Entry: 0.56985
Why we like it:
There is a pullback resistance level.
Stop loss: 0.5728
Why we like it:
There is a pullback resistance level.
Take profit: 0.56612
Why we like it:
There is a pullback support level.
Enjoying your TradingView experience? Review us!
Please be advised that the information presented on TradingView is provided to Vantage (‘Vantage Global Limited’, ‘we’) by a third-party provider (‘Everest Fortune Group’). Please be reminded that you are solely responsible for the trading decisions on your account. There is a very high degree of risk involved in trading. Any information and/or content is intended entirely for research, educational and informational purposes only and does not constitute investment or consultation advice or investment strategy. The information is not tailored to the investment needs of any specific person and therefore does not involve a consideration of any of the investment objectives, financial situation or needs of any viewer that may receive it. Kindly also note that past performance is not a reliable indicator of future results. Actual results may differ materially from those anticipated in forward-looking or past performance statements. We assume no liability as to the accuracy or completeness of any of the information and/or content provided herein and the Company cannot be held responsible for any omission, mistake nor for any loss or damage including without limitation to any loss of profit which may arise from reliance on any information supplied by Everest Fortune Group.