AUD/CHF Rising Channel Breakdown Opens Path to 0.5665AUD/CHF is trading around 0.5709 after rejecting the upper boundary of a well-defined rising channel. Price has broken below the channel support and is struggling to regain bullish momentum, indicating that sellers are beginning to take control.
Technical Analysis
Trend: Bearish (short-term)
Pattern: Rising Channel Breakdown
Ichimoku Cloud: Price is trading at the edge/below the Ichimoku cloud, while the cloud ahead is turning into resistance, supporting a bearish outlook.
Resistance Zone: 0.5715 – 0.5720
Previous channel support turned resistance.
Any rejection from this area could trigger another wave of selling.
Immediate Support: 0.5665
A decisive break below this level would confirm further downside.
Bearish Scenario
If sellers maintain control and price remains below 0.5715, AUD/CHF could continue lower toward:
Target 1: 0.5665
Target 2: 0.5625
These targets align with the projected move shown on the chart and represent the next significant demand zones.
Bullish Invalidation
The bearish setup would be invalidated if:
Price reclaims the broken channel.
A strong candle closes above 0.5720.
Price moves back above the Ichimoku cloud with increasing bullish momentum.
Trading Idea
Bias: Bearish
Entry: On a rejection from 0.5715–0.5720 or a confirmed break below 0.5665.
Targets: 0.5665 → 0.5625
Stop Loss: Above 0.5725 or above the recent swing high.
Conclusion
The technical structure favors further downside after the breakdown from the rising channel. As long as AUD/CHF remains below 0.5715 and the Ichimoku cloud acts as resistance, sellers are likely to push the pair toward 0.5665 and potentially 0.5625.
Australian Dollar / Swiss Franc
No trades
No trades
In-depth trading ideas
Bullish bounce at 61.8% Fib support?AUD/CHF i falling to the support level, which is an overlap support that aligns with the 61.8% Fibonacci retracement and could bounce from this level to our take profit.
Entry: 0.57089
Why we like it:
There is an overlap support level that aligns with the 61.8% Fibonacci retracement.
Stop loss: 0.56933
Why we like it:
There is a pullback support level.
Take profit: 0.57256
Why we like it:
There is a pullback resistance level.
Enjoying your TradingView experience? Review us!
Please be advised that the information presented on TradingView is provided to Vantage (‘Vantage Global Limited’, ‘we’) by a third-party provider (‘Everest Fortune Group’). Please be reminded that you are solely responsible for the trading decisions on your account. There is a very high degree of risk involved in trading. Any information and/or content is intended entirely for research, educational and informational purposes only and does not constitute investment or consultation advice or investment strategy. The information is not tailored to the investment needs of any specific person and therefore does not involve a consideration of any of the investment objectives, financial situation or needs of any viewer that may receive it. Kindly also note that past performance is not a reliable indicator of future results. Actual results may differ materially from those anticipated in forward-looking or past performance statements. We assume no liability as to the accuracy or completeness of any of the information and/or content provided herein and the Company cannot be held responsible for any omission, mistake nor for any loss or damage including without limitation to any loss of profit which may arise from reliance on any information supplied by Everest Fortune Group.
Could we see a reversal from here?AUD/CHF is rising toward the resistance, which is a pullback resistance and could reverse from this level to our take profit.
Entry: 0.56985
Why we like it:
There is a pullback resistance level.
Stop loss: 0.5728
Why we like it:
There is a pullback resistance level.
Take profit: 0.56612
Why we like it:
There is a pullback support level.
Enjoying your TradingView experience? Review us!
Please be advised that the information presented on TradingView is provided to Vantage (‘Vantage Global Limited’, ‘we’) by a third-party provider (‘Everest Fortune Group’). Please be reminded that you are solely responsible for the trading decisions on your account. There is a very high degree of risk involved in trading. Any information and/or content is intended entirely for research, educational and informational purposes only and does not constitute investment or consultation advice or investment strategy. The information is not tailored to the investment needs of any specific person and therefore does not involve a consideration of any of the investment objectives, financial situation or needs of any viewer that may receive it. Kindly also note that past performance is not a reliable indicator of future results. Actual results may differ materially from those anticipated in forward-looking or past performance statements. We assume no liability as to the accuracy or completeness of any of the information and/or content provided herein and the Company cannot be held responsible for any omission, mistake nor for any loss or damage including without limitation to any loss of profit which may arise from reliance on any information supplied by Everest Fortune Group.
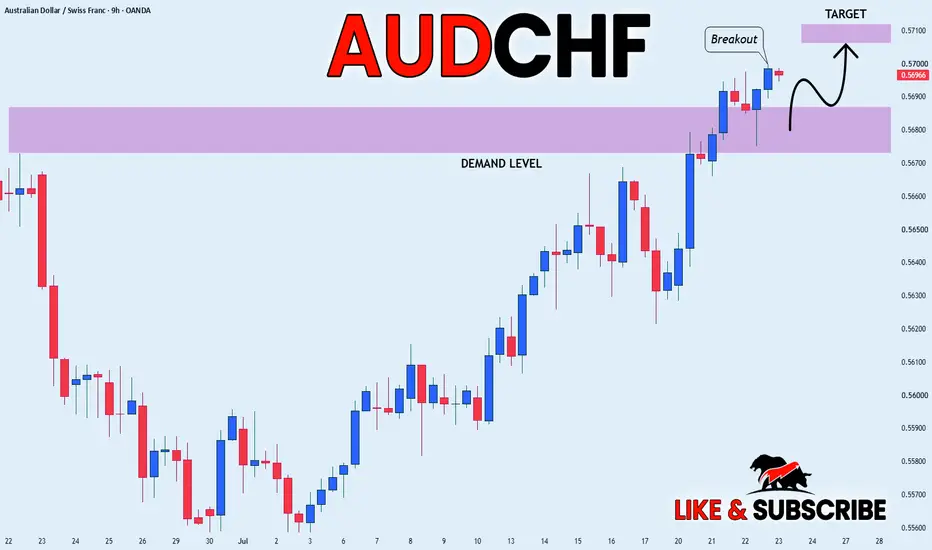
AUD/CHF BULLS WILL DOMINATE THE MARKET|LONG
AUD/CHF SIGNAL
Trade Direction: long
Entry Level: 0.5688
Target Level: 0.5701
Stop Loss: 0.5680
RISK PROFILE
Risk level: medium
Suggested risk: 1%
Timeframe: 1h
Disclosure: I am part of Trade Nation's Influencer program and receive a monthly fee for using their TradingView charts in my analysis.
✅LIKE AND COMMENT MY IDEAS✅
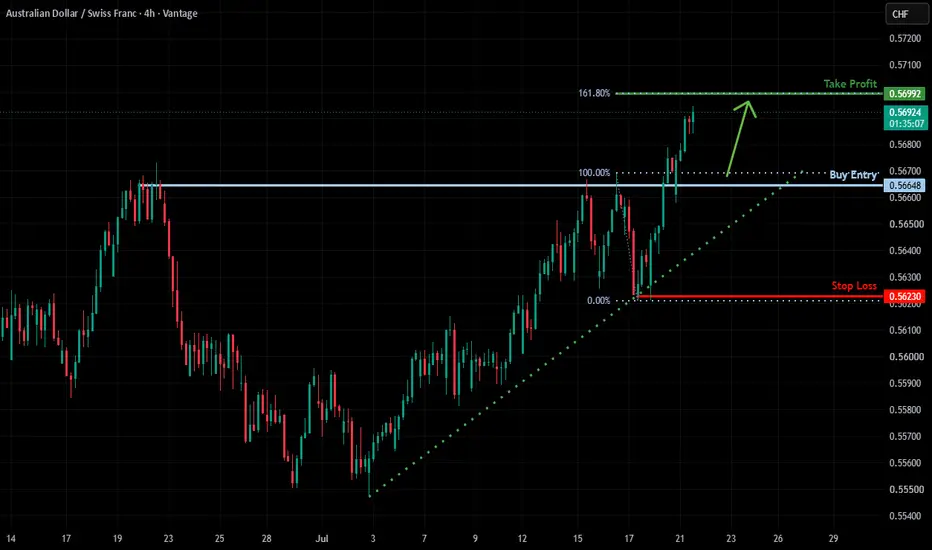
Bullish bounce?AUD/CHF could fall to the support level, which is a pullback support level, and could bounce from this level to our take-profit.
Entry: 0.56648
Why we like it:
There is a pullback support level.
Stop loss: 0.56230
Why we like it:
There is a pullback support level.
Take profit: 0.56992
Why we like it:
There is a resistance level at the 161.8% Fibonacci extension.
Enjoying your TradingView experience? Review us!
Please be advised that the information presented on TradingView is provided to Vantage (‘Vantage Global Limited’, ‘we’) by a third-party provider (‘Everest Fortune Group’). Please be reminded that you are solely responsible for the trading decisions on your account. There is a very high degree of risk involved in trading. Any information and/or content is intended entirely for research, educational and informational purposes only and does not constitute investment or consultation advice or investment strategy. The information is not tailored to the investment needs of any specific person and therefore does not involve a consideration of any of the investment objectives, financial situation or needs of any viewer that may receive it. Kindly also note that past performance is not a reliable indicator of future results. Actual results may differ materially from those anticipated in forward-looking or past performance statements. We assume no liability as to the accuracy or completeness of any of the information and/or content provided herein and the Company cannot be held responsible for any omission, mistake nor for any loss or damage including without limitation to any loss of profit which may arise from reliance on any information supplied by Everest Fortune Group.
AUDCHF is rise has been steady, decisive move aheadAUDCHF is the focus here. Price has been trading inside a clear rising channel, respecting the structure with consistent higher highs and higher lows, showing that buyers are still maintaining control.
Recently, price broke above a short-term resistance area and is now holding near the breakout zone. This move is important because it shows buyers are willing to defend higher levels after the previous expansion. If the breakout area continues to hold as support, it could provide the foundation for another move higher toward the 0.57500 area, which aligns with the upper boundary of the channel.
However, if price fails to maintain this zone, a short-term pullback could happen before buyers attempt another push.
The key here is simple: respect the structure and wait for confirmation. The trend remains bullish, but patience is what separates a good setup from a forced entry.
AUD/CHF Bearish Pullback Targets Lower Demand ZonesAUD/CHF is showing signs of bearish continuation after failing to sustain its breakout above the previous order block. The sharp rejection from the strong swing high has shifted short-term momentum in favor of sellers, while the current pullback suggests another leg lower is likely if resistance holds.
Market Structure
Price previously formed consecutive Breaks of Structure (BoS), confirming an uptrend.
A bullish rally into the order block triggered a strong breakout, creating a new swing high.
The rally was immediately rejected, indicating heavy selling pressure near the highs.
Price is now trading below the recent highs and appears to be forming a lower high, favoring further downside.
Key Resistance Zone
0.5699 – 0.5701
This supply zone is the preferred area for bearish continuation.
A rejection with bearish confirmation from this level would strengthen the short setup.
Trade Setup
Sell Entry: Wait for price to retrace into 0.5699–0.5701 and print a bearish rejection candle or lower-timeframe confirmation before entering.
Bearish Targets
🎯 Target 1: 0.5675 – 0.5677
🎯 Final Target: 0.5666 – 0.5668
These targets align with previous demand zones where buyers may attempt to defend price.
Invalidation
A sustained close above 0.5702 would invalidate the bearish setup and increase the probability of a retest of the 0.5710 swing high.
Trading Outlook
The short-term bias remains bearish while price trades below the 0.5700 resistance zone. A pullback into resistance followed by bearish confirmation offers the highest-probability selling opportunity, with downside objectives at 0.5676 and 0.5667.
Bearish reversal in play?AUD/CHF has rejected off the pivot, which is an overlap resistance that aligns with the 38.2% and 50% Fibonacci retracements and could drop toward the 1st support.
Pivot: 0.56752
1st Support: 0.56315
1st Resistance: 0.56987
Disclaimer:
The opinions given above constitute general market commentary and do not constitute the opinion or advice of IC Markets or any form of personal or investment advice.
Any opinions, news, research, analyses, prices, other information, or links to third-party sites contained on this website are provided on an "as-is" basis, are intended to be informative only, and are not advice, a recommendation, research, a record of our trading prices, an offer of, or solicitation for, a transaction in any financial instrument and thus should not be treated as such. The information provided does not involve any specific investment objectives, financial situation, or needs of any specific person who may receive it. Please be aware that past performance is not a reliable indicator of future performance and/or results. Past performance or forward-looking scenarios based upon the reasonable beliefs of the third-party provider are not a guarantee of future performance. Actual results may differ materially from those anticipated in forward-looking or past performance statements. IC Markets makes no representation or warranty and assumes no liability as to the accuracy or completeness of the information provided, nor any loss arising from any investment based on a recommendation, forecast, or any information supplied by any third party.
Bullish bounce setup?AUD/CHF is falling toward the pivot, which is a pullback support and could bounce toward the 1st resistance, which is an overlap resistance.
Pivot: 0.56671
1st Support: 0.56317
1st Resistance: 0.57224
Disclaimer:
The opinions given above constitute general market commentary and do not constitute the opinion or advice of IC Markets or any form of personal or investment advice.
Any opinions, news, research, analyses, prices, other information, or links to third-party sites contained on this website are provided on an "as-is" basis, are intended to be informative only, and are not advice, a recommendation, research, a record of our trading prices, an offer of, or solicitation for, a transaction in any financial instrument and thus should not be treated as such. The information provided does not involve any specific investment objectives, financial situation, or needs of any specific person who may receive it. Please be aware that past performance is not a reliable indicator of future performance and/or results. Past performance or forward-looking scenarios based upon the reasonable beliefs of the third-party provider are not a guarantee of future performance. Actual results may differ materially from those anticipated in forward-looking or past performance statements. IC Markets makes no representation or warranty and assumes no liability as to the accuracy or completeness of the information provided, nor any loss arising from any investment based on a recommendation, forecast, or any information supplied by any third party.
AUDCHF - BEARISH BIAS ~ MONTHLY - Price is at a strong S&R zone, respecting the zone by failing to break to the upside.
~ WEEKLY - Momentum has started to slow down as we approach the Monthly level. We see this by multiple rejections and an engulfing bearish candle. Price is currently forming the right shoulder of the H&S pattern, a reversal pattern confirming the change of direction.
~ DAILY - We wait for price to pull back to the AOI which is a strong fib level and multiple rejections making it a valid zone to react from.
Overall, I have a bearish bias based on the Weekly timeframe.
As price moves up to my AOI, I will wait for my confirmations across multiple timeframes to see how it reacts!
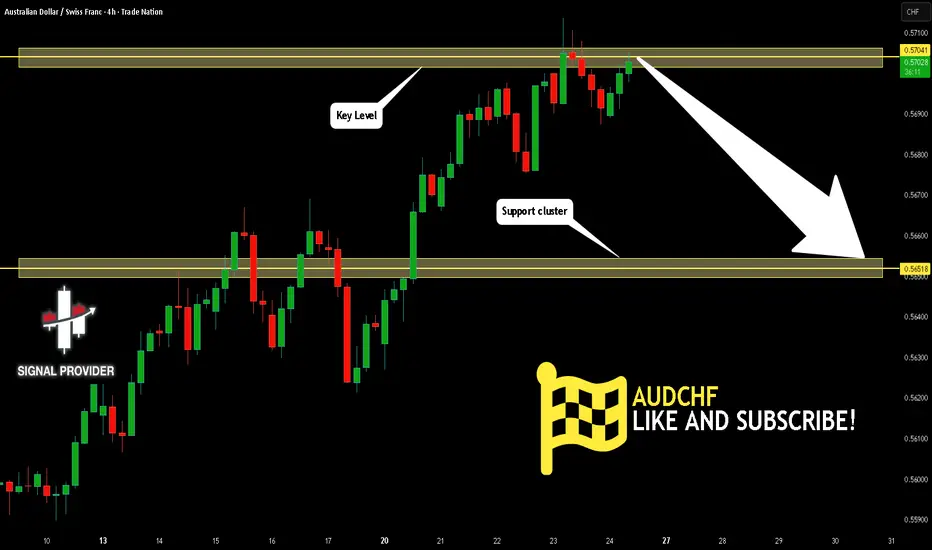
AUDCHF Is Bearish! Sell!
Take a look at our analysis for EAUDCHF.
Time Frame: 4h
Current Trend: Bearish
Sentiment: Overbought (based on 7-period RSI)
Forecast: Bearish
The market is on a crucial zone of supply 0.570.
The above-mentioned technicals clearly indicate the dominance of sellers on the market. I recommend shorting the instrument, aiming at 0.565 level.
P.S
Please, note that an oversold/overbought condition can last for a long time, and therefore being oversold/overbought doesn't mean a price rally will come soon, or at all.
Like and subscribe and comment my ideas if you enjoy them!
AUDCHF: Important Breakout 🇦🇺🇨🇭
AUDCHF broke and closed above a significant daily resistance cluster,
setting a new higher high higher close.
The next strong resistance is 0.574.
Look for buying the pair after a pullback.
❤️Please, support my work with like, thank you!❤️
I am part of Trade Nation's Influencer program and receive a monthly fee for using their TradingView charts in my analysis.
**AUDCHF Update – Back on the Watchlist**7.13.2026
A few days ago we removed AUDCHF from our watchlist after price broke above the resistance level we were watching. The original setup was no longer valid, so there was no reason to force a trade.
Now the picture has changed.
Instead of reversing at that level, price has continued higher and may be heading toward the next major resistance zone. Daily momentum is also pushing higher, so we'll keep this market on our radar and let it come to us.
Our plan hasn't changed:
✅ Wait for price to reach a meaningful resistance level.
✅ Watch for strong rejection candles.
✅ Confirm momentum and volume.
✅ Only consider a trade if the complete VMS 2.0 checklist aligns.
No predictions. No chasing. Just patiently waiting for the market to reveal its next opportunity.
#AUDCHF #Forex #Trading #PriceAction #VMS20 #TradingView
AUD/CHF: Bullish POI ReactionOANDA:AUDCHF – Liquidity Sweep into POI Zone
Overall market context is still heavily bullish.
Reaction: We just had a liquidity sweep into our key 4H demand zone followed by a strong upside reaction.
Next Move: Price is pressing against the internal structure high. We don't have a confirmed ChoCh close yet, but the speed of this rejection gives price plenty of room to expand higher.
Watching closely for structure confirmation before targeting the upper liquidity pools.
AUDCHF: Market Sentiment & Forecast
Our strategy, polished by years of trial and error has helped us identify what seems to be a great trading opportunity and we are here to share it with you as the time is ripe for us to buy AUDCHF.
Disclosure: I am part of Trade Nation's Influencer program and receive a monthly fee for using their TradingView charts in my analysis.
❤️ Please, support our work with like & comment! ❤️
AUDCHF H4 | Bearish Reversal Off Pullback ResistanceMomentum: Bearish
Price is currently below the ichimoku cloud.
Sell entry: 0.57084
- Pullback resistance
- 61.8% Fib retracement
- 100% Fib projection
Stop Loss: 0.57291
- Swing high resistance
Take Profit: 0.56750
- Overlap support
High Risk Investment Warning
Stratos Markets Limited (fxcm.com/uk), Stratos Europe Ltd (fxcm.com/eu):
CFDs are complex instruments and come with a high risk of losing money rapidly due to leverage. 65% of retail investor accounts lose money when trading CFDs with this provider. You should consider whether you understand how CFDs work and whether you can afford to take the high risk of losing your money.
Stratos Global LLC (fxcm.com/en): Losses can exceed deposits.
Please be advised that the information presented on TradingView is provided to FXCM (‘Company’, ‘we’) by a third-party provider (‘TFA Global Pte Ltd’). Please be reminded that you are solely responsible for the trading decisions on your account. Any information and/or content is intended entirely for research, educational and informational purposes only and does not constitute investment or consultation advice or investment strategy. The information is not tailored to the investment needs of any specific person and therefore does not involve a consideration of any of the investment objectives, financial situation or needs of any viewer that may receive it. Past performance is not a reliable indicator of future results. Actual results may differ materially from those anticipated in forward-looking or past performance statements. We assume no liability as to the accuracy or completeness of any of the information and/or content provided herein and the Company cannot be held responsible for any omission, mistake nor for any loss or damage including without limitation to any loss of profit which may arise from reliance on any information supplied by TFA Global Pte Ltd.
Stratos Trading Pty. Limited (fxcm.com/au):
Trading FX/CFDs carries significant risks. FXCM AU (AFSL 309763), please read the Financial Services Guide, Product Disclosure Statement, Target Market Determination and Terms of Business at fxcm.com/au
AUDCHF Reversal Trade H1Short setup on AUD/CHF, 1h chart: price rallied into resistance near 0.5700, printed a bearish divergence (price higher high, RSI lower high — marked with the white trendlines on both panes), then rolled over and is pulling back toward the 0.56827 sell-stop entry zone.
Trade plan:
AUD/CHF – Short (Sell Stop)
Entry: 0.56827 (sell stop, pending)
Stop loss: 0.57000 (above the swing high, ~173 pips risk)
TP1: 0.56500
TP2: 0.56300
TP3: 0.56000
Thesis: bearish RSI divergence at resistance signals fading momentum on the up-move; entry is set below current price to confirm the breakdown before triggering, with staggered targets into the last support shelf around 0.5650–0.5600.
Note: this is a technical setup description, not trading advice — size and risk are yours to decide, and FX pairs like this can gap/slip through stops.
AUDCHF: Bearish Continuation & Short Trade
AUDCHF
- Classic bearish setup
- Our team expects bearish continuation
SUGGESTED TRADE:
Swing Trade
Short AUDCHF
Entry Point - 0.5696
Stop Loss - 0.5699
Take Profit - 0.5690
Our Risk - 1%
Start protection of your profits from lower levels
Disclosure: I am part of Trade Nation's Influencer program and receive a monthly fee for using their TradingView charts in my analysis.
❤️ Please, support our work with like & comment! ❤️
AUD/CHF BEARS ARE STRONG HERE|SHORT
Hello, Friends!
AUD/CHF pair is trading in a local uptrend which we know by looking at the previous 1W candle which is green. On the 4H timeframe the pair is going up too. The pair is overbought because the price is close to the upper band of the BB indicator. So we are looking to sell the pair with the upper BB line acting as resistance. The next target is 0.565 area.
Disclosure: I am part of Trade Nation's Influencer program and receive a monthly fee for using their TradingView charts in my analysis.
✅LIKE AND COMMENT MY IDEAS✅