AUDUSD is Nearing a Strong Support!Hey Traders, in today's trading session we are monitoring AUDUSD for a buying opportunity around 0.69800 zone, AUDUSD is trading in an uptrend and currently is in a correction phase in which it is approaching the trend at 0.69800 support and resistance area.
Trade safe, Joe
Australian Dollar / U.S. Dollar
No trades
No trades
In-depth trading ideas
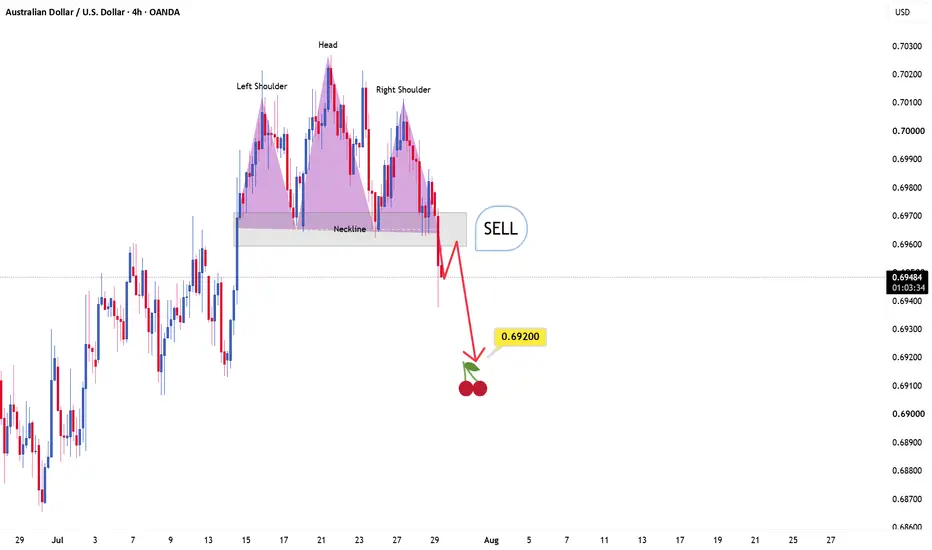
AUD/USD Reversal H&S Created , Short Soon After Confirmation !Here Is My 4H AUD/USD Chart And Here Is My Opinion , If we checked the chart we will see that we have a clear head and shoulders reversal pattern but we have not a closure below our neckline so we have not a confirmation to can enter , so we need to wait until we have a closure below our neckline to get a clear confirmation to can sell after this movement to upside That we entered the week before last week and it`s the time for a little correction , so we will waiting for clear closure below our neckline that i mentioned on the chart and then we can enter a sell trade and we can targeting from 50 to 100 pips and use a decent sl , if we have not a closure below then this idea will not be valid anymore .
Entry Reasons :
- Reversal Pattern
- Over Bought
- Bearish P.A
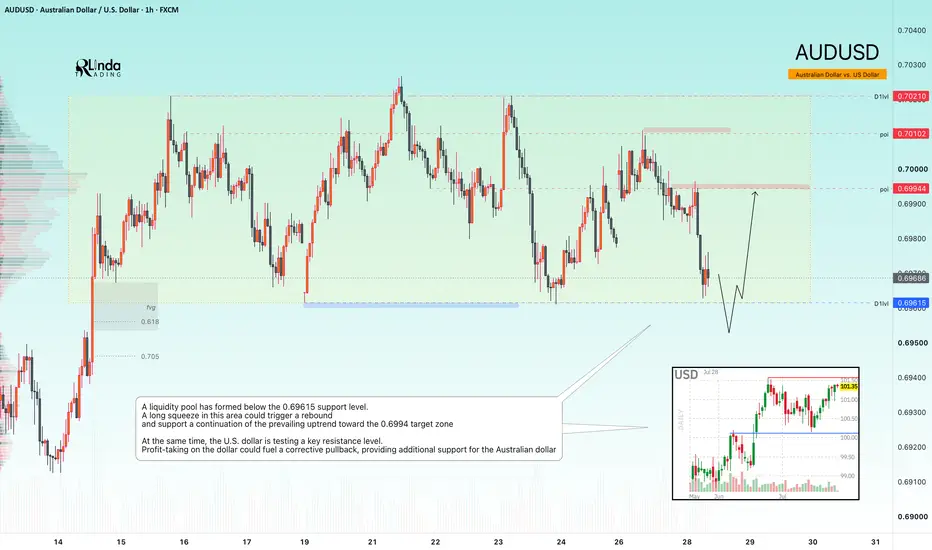
AUDUSD - A long squeeze could trigger a rally FX:AUDUSD is testing a key support zone, with a significant liquidity pool positioned just below it. The broader daily trend remains bullish, giving buyers an opportunity to regain control
At the same time, the U.S. Dollar Index is testing resistance. Profit-taking near the 101.5 area could trigger a pullback in the dollar, providing additional support for the Australian dollar.
From a technical perspective, a substantial liquidity pool has formed below 0.69615. A long squeeze in this area could trigger a rebound and support a continuation of the prevailing uptrend toward the next target zone
Resistance levels: 0.6994, 0.7010, 0.7021
Support level: 0.6960
A false breakout below 0.69615, followed by a recovery and sustained consolidation above this level, could become the technical catalyst for a rally toward 0.6994–0.7020
Best regards,
R. Linda
AUDUSD Demand Zone Could Spark Bullish momentumAUDUSD is currently testing a key demand zone after a sharp bearish impulse, where liquidity appears to be resting below recent swing lows. The latest decline may represent a liquidity sweep rather than the beginning of a fresh downtrend, as price is approaching an area that previously attracted strong buying interest.
From a technical perspective, buyers will be looking for a false breakdown below the current support, followed by a strong recovery back above the zone. Such a move would confirm that sellers have been trapped and could trigger a bullish rebound toward the next resistance levels.
At the same time, market participants remain focused on upcoming U.S. economic data and Federal Reserve expectations. Any weakness in the U.S. Dollar could provide additional support for the Australian Dollar and increase the probability of a recovery.
If price successfully reclaims the broken support area and maintains bullish momentum, AUDUSD could extend higher toward the next resistance targets.
Resistance Levels: • 0.6990 / 0.7012 / 0.7030
Support Zone: • 0.6940 – 0.6950
A liquidity sweep below support, followed by a sustained move back above 0.6950, would strengthen the bullish outlook and could open the door for a rally toward 0.6990–0.7012. However, a decisive break and close below the demand zone would invalidate the bullish scenario and expose the pair to further downside.
Hope you found this analysis helpful. 👍
Like, Comment & Follow for more updates. Trade safe.
Aussie Dollar Falls as RBA Warning Fails to Beat the U.S. DollarAUD/USD traded lower on Tuesday, July 28 as the Australian Dollar slipped despite another hawkish warning from RBA Governor Michele Bullock. Bullock said underlying inflation remains too high and that another slowdown in domestic demand may be needed to bring price pressures under control. Markets still price another RBA hike this year, which would take the cash rate toward 4.6%, but that was not enough to lift the Australian Dollar against a broadly stronger U.S. Dollar.
The issue is relative policy momentum. The RBA is hawkish because inflation is sticky and oil-driven costs are still passing through the economy, but the Fed has the immediate event risk this week. Falling oil prices eased some global inflation pressure, yet markets are still treating a Fed hike as a live outcome. That kept AUD/USD under pressure. The Australian Dollar has a domestic tightening story, but today the U.S. Dollar had the cleaner catalyst.
AUD/USD is losing short-term control after failing at the 0.7000 area. That level is doing a lot of work: round-number resistance, prior support, and a cluster of short and medium-term moving averages all sit around the same zone. The rally off the July low near 0.6830 recovered enough to reset sentiment, but it has stalled directly into supply. Price is now back under 0.6970, which turns the recent bounce into a corrective move unless buyers can quickly reclaim 0.7000.
Momentum is also fading. MACD has recovered from the June/July washout, but it is flattening near the zero line instead of accelerating through it. That says the rebound has lost energy before confirming a real trend shift. Stochastics have rolled over from the upper half of the range, which adds near-term downside pressure. The moving averages are flattening and compressing, so this is less of a clean trend and more of a failed recovery attempt inside a broader chop zone.
AUDUSD: Bearish Drop to 0.6865?FX:AUDUSD is eyeing a bearish reversal on the 4-hour chart , with price pulling back toward a key resistance zone after breaking the short-term uptrend line, converging with a potential entry area that could trigger further downside momentum if sellers defend amid volatility. This setup suggests a solid pullback opportunity toward the lower support zone with approximately 1:3 risk-reward .🔥
Entry between 0.6988–0.7000 (entry from current price with proper risk management is recommended). Target at 0.6865 . Set a stop loss at a daily close above 0.7030 , yielding a risk-reward ratio of approximately 1:3 . Monitor for confirmation via a bearish candle close below entry with rising volume, leveraging the pair’s weakness near resistance.🌟
Fundamentally , AUDUSD is trading around 0.695 in late July 2026.
For the Australian Dollar, the most important release this week was the Australia CPI / Trimmed Mean Inflation data (around July 29), where softer-than-expected figures increased expectations of a more cautious RBA stance and weighed on AUD.
For the US Dollar, the key event is the FOMC Interest Rate Decision and Press Conference (July 29), where any hawkish signals from the Fed would strengthen USD and support further downside in the pair.
📝 Trade Setup
🎯 Entry (Short):
0.6988 – 0.7000
(Entry from current price is acceptable with proper position sizing and disciplined risk management.)
🎯 Target:
0.6865
❌ Stop Loss:
• daily candle close above 0.7030
📈 Risk-to-Reward:
Approximately 1:3
💡 Will sellers defend the 0.6988–0.7000 resistance zone and drive AUDUSD toward 0.6865, or will buyers reclaim 0.7030 and invalidate the bearish setup? 👇
AUD/USD 4H Chart — Head and Shoulders Setup Is FormingThis is my AUD/USD 4-hour chart and this is my opinion. Looking at the structure, we can clearly see a potential Head and Shoulders reversal pattern forming after the previous bullish move.
The left shoulder, head, and right shoulder are already visible, but the price has not yet confirmed the pattern because we still need a clear break and close below the neckline. Until that happens, this remains only a potential reversal setup, not a confirmed sell signal.
My focus is now on the neckline area. If price breaks below this support zone and gives us a strong bearish candle, that would be the confirmation I need to consider a sell entry targeting the next support around 0.69200.
However, if the neckline continues to hold and price moves back above this area, this idea will no longer be valid.
Entry Reasons:
Head and Shoulders reversal pattern
Rejection from resistance
Potential bearish momentum shift
Key neckline support breakdown needed for confirmation
AUDUSDAUD
CPI m/m 0.2% -0.7%
AUD
CPI y/y 4.0% 4.0%
AUD
Trimmed Mean CPI m/m 0.3% 0.4%
Bearish setup:
Entry: After a confirmed H4 close below 0.6970
Stop Loss: Above 0.6995–0.7000 or above the retest high
TP1: 0.6920
TP2: 0.6890
Avoid entering before confirmation, as the current demand zone could still produce another bounce.
The CPI data gives the bears a slight fundamental edge, and your chart structure aligns with a potential breakdown if 0.6970 fails. The next H4 candle close around this support is likely to determine the next directional move.
AUDUSD: Horizontal ConsolidationAUDUSD is partially trapped in a sideways channel, moving in momentum of support and resistance. The pair have been ranging horizontally for a couple of weeks now, in respect to the structure, giving the traders the chance to trade the both sides. Price is at the resistance level, as we anticipate a retracement between 0.7011-0.7020.
However, a confirmed reverse below this zone, triggers a sell position down 0.6972, as next potential support.
Thanks for reading.
AUDUSD is Nearing a Strong Support!Hey Traders, in today's trading session we are monitoring AUDUSD for a buying opportunity around 0.69800 zone, AUDUSD is trading in an uptrend and currently is in a correction phase in which it is approaching the trend at 0.69800 support and resistance area.
Trade safe, Joe.
AUD-USD Pullback Expected! Sell!
Hello,Traders!
AUDUSD approaching the horizontal supply area where sellers may step in, with a rejection from this zone likely to trigger a bearish move toward the next target level. Time Frame 2H.
Sell!
Comment and subscribe to help us grow!
Check out other forecasts below too!
AUDUSD 4H – Bearish BiasHello Trading Fam! 👋
The overall trend is bearish. Price could back into the marked supply zone, where sellers may step in. Wait for bearish confirmation before looking for short entries, targeting the recent lows.
Don’t forget to like and share your thoughts in the comments! ❤️
Potential bullish bounce off?Aussie (AUD/USD) is falling toward the pivot and could bounce toward the 1st resistance.
Pivot: 0.6959
1st Support: 0.6879
1st Resistance: 0.7103
Disclaimer:
The opinions given above constitute general market commentary and do not constitute the opinion or advice of IC Markets or any form of personal or investment advice.
Any opinions, news, research, analyses, prices, other information, or links to third-party sites contained on this website are provided on an "as-is" basis, are intended to be informative only, and are not advice, a recommendation, research, a record of our trading prices, an offer of, or solicitation for, a transaction in any financial instrument and thus should not be treated as such. The information provided does not involve any specific investment objectives, financial situation, or needs of any specific person who may receive it. Please be aware that past performance is not a reliable indicator of future performance and/or results. Past performance or forward-looking scenarios based upon the reasonable beliefs of the third-party provider are not a guarantee of future performance. Actual results may differ materially from those anticipated in forward-looking or past performance statements. IC Markets makes no representation or warranty and assumes no liability as to the accuracy or completeness of the information provided, nor any loss arising from any investment based on a recommendation, forecast, or any information supplied by any third party.
AUDUSD A Fall Expected! SELL!
My dear subscribers,
This is my opinion on the AUDUSD next move:
The instrument tests an important psychological level 0.7018
Bias - Bearish
Technical Indicators: Supper Trend gives a precise Bearish signal, while Pivot Point HL predicts price changes and potential reversals in the market.
Target - 0.6989
About Used Indicators:
On the subsequent day, trading above the pivot point is thought to indicate ongoing bullish sentiment, while trading below the pivot point indicates bearish sentiment.
Disclosure: I am part of Trade Nation's Influencer program and receive a monthly fee for using their TradingView charts in my analysis.
———————————
WISH YOU ALL LUCK
AUDUSD _ SELLAUD/USD maintains a bearish outlook over the next 60 days as macroeconomic and market conditions continue to favour the US dollar.
The dominant driver remains a risk-off environment. Elevated geopolitical tensions and higher energy prices have reinforced demand for safe-haven assets, with the US dollar continuing to benefit from defensive capital flows. In contrast, the Australian dollar remains vulnerable due to its sensitivity to global growth expectations and investor risk appetite.
Although the Reserve Bank of Australia may adopt a more restrictive policy stance to address persistent inflation, slowing domestic growth and a softer labour market reduce the likelihood that tighter policy alone will provide sustained support for AUD. Markets typically respond more positively to rate hikes driven by economic strength than to those aimed at containing inflation amid weakening activity.
From a technical perspective, the broader trend also remains under pressure, supporting the prevailing bearish outlook while risk sentiment continues to favour the US dollar.
AUDUSD – 12H | Bearish Bias, Big Short SetupOverall Bias: Bearish
Current Price: ~0.69815
📍 Key Levels
- Breaker-Inverse-FVG (R zone): 0.69815–0.70000
- 1 Month FVG (upside invalidation zone): higher timeframe, above
- SSL 1: 0.68660
- SSL 2: 0.68330
- Deep target zone: 0.66000–0.66700
🔍 Analysis
- Price rejected from the Breaker-Inverse-FVG zone, holding below 0.70000
- No bullish invalidation unless the 1 Month FVG above gets filled
- Structure favours continuation lower while below the breaker zone
- Primary view: rejection holds, bearish continuation resumes toward liquidity below
📉 Downside Targets
- TP1: 0.68660 (SSL)
- TP2: 0.68330 (SSL)
- TP3: 0.66700
- TP4: 0.66000
🧭 Trade Plan
- Bias: Bearish (big short)
- Invalidation: only if 1M FVG fills
- Fundamentals: hawkish Fed tone supports dollar strength
- Event risk: FOMC Wed July 29 — tone matters most
- No upside unless HTF FVG reaction confirms
Not financial advice — for educational/analytical purposes only.
Kwagga.
AUDUSD: Fed rumors put the Aussie on edgeAUDUSD: Fed rumors put the Aussie on edge
AUDUSD is nervous. Buyers defended the 0.6964 area, but the rebound already looks tired below 0.6980–0.6990.
Now the pair is trapped between two stories: Australia’s CPI and rumors that the Fed could surprise markets with a 25-bp hike.
🟢 Facts
Australia’s CPI is due on July 29 at 01:30 UTC. Headline inflation is expected at 4.0% y/y, while RBA trimmed mean CPI is expected at 3.7% y/y.
The Fed rate decision comes later the same day at 18:00 UTC, followed by the press conference at 18:30 UTC.
🟡 Expectation
The base case is still a Fed hold at 3.75%. But the market is not sleeping anymore. Talk of a surprise hike keeps the USD supported.
🔴 Market Whisper
This is not a confirmed Fed move. It is only the whisper: Warsh may want to show that the Fed is less predictable now.
For AUDUSD, that means one thing: the next candle can get emotional fast.
Trade Setup — Short on Rejection
Entry: 0.6980–0.6985
Stop Loss: 0.69945
Take Profit 1: 0.6970
Take Profit 2: 0.6964
CBWhisper Verdict
Below 0.7000, sellers still control the room. But CPI and the Fed can change the whole conversation in one candle.
Not investment advice.
AUDUSD Forecast | Bullish Breakout Setup Market AnalysisOANDA:AUDUSD AUDUSD initially moved lower on the lower timeframes, confirming a bearish breakdown after losing a key support zone with strong selling pressure. Following the decline, the pair established a solid support area and entered a period of consolidation, allowing buyers to gradually regain momentum.
Price has now formed a well-defined resistance zone and is printing strong bullish candles, indicating increasing buying pressure. AUDUSD is approaching both the horizontal resistance level and the descending trendline. A confirmed breakout above these technical barriers could trigger the next bullish continuation.
The current market structure suggests that buyers are gaining control, but a decisive breakout above resistance is essential before confirming the bullish scenario.
Technical Targets
Target 1: 0.70400
Target 2: 0.70500
Target 3: 0.70600
Target 4: 0.70700
Trading Plan
Wait for a confirmed breakout above the resistance zone and trendline before considering long positions. A strong candle close above resistance will provide additional confirmation. Always apply disciplined risk management and avoid entering trades without proper confirmation.
AUDUSD | Will the Aussie-dollar Decline Further After FOMC MeetiMacro approach:
- The aussie-dollar weakened this week, pressured by reduced RBA hike expectations and a firmer US dollar tone ahead of major US data and the Fed decision.
- RBA Governor Bullock’s cautious remarks led markets to trim tightening bets, while pre‑event positioning and bouts of risk aversion weighed on the risk‑sensitive Aussie.
- This week, aussie-dollar may stay pressured if Fed remains hawkish during the meeting.
Technical approach:
- AUDUSD broke the ascending trendline and the key level at around 0.6960. The price is below both death-crossed EMAs, indicating a shift to bearish trend.
- If AUDUSD remains below the resistance at 0.6960, the price may decline toward the immediate support at around 0.6915.
- On the contrary, closing above 0.6960 may prompt a further correction toward the broken trendline and both EMAs.
Analysis by: Quoc Dat Tong, Senior Financial Markets Strategist at Exness
AUD/USD Monthly Chart | Elliott Wave Principle
A long-term structural review suggests that the decline from the all-time high can be interpreted as a completed five-wave impulsive decline. Following that move, the market developed a three-wave corrective structure, which, from an Elliott Wave perspective, may represent only a portion of a larger-degree corrective pattern.
At this stage, it is still too early to assemble the entire puzzle. The roadmap presented on the chart should be viewed as a structural hypothesis based on the current wave development rather than a definitive forecast.
What currently stands out is the most recent decline, which once again displays the characteristics of an impulsive five-wave sequence. If this interpretation remains valid, Elliott Wave Principle suggests that the market is more likely to transition into a three-wave corrective phase rather than continue directly in the same direction.
For now, our primary focus is on monitoring the development of a three-wave correction. This correction may unfold as a classic Zigzag or another member of the three-wave corrective family.
Should this corrective structure complete as expected, the probability of forming a larger-degree Zigzag would increase. However, it is still too early to draw firm conclusions, and the preferred scenario will continue to be evaluated as the wave structure evolves and new market evidence becomes available.
At the current stage, the quality and internal structure of the upcoming correction are more important than the price itself, as they may provide valuable clues regarding the wave degree and the dominant market scenario.
In Elliott Wave Principle, the objective is not to predict the future, but to interpret market structure and continuously adapt the analysis as price action unfolds.
✍️ Mr. Nobody
🎧 Patterns whisper. I listen.
Australian Dollar / U.S. Dollar
1 hour ago
Research & Educational | When Structure Speaks Before Price
Research & Educational | When Structure Speaks Before Price📚 Research & Educational | When Structure Speaks Before Price
The value of an analysis should not be judged solely by whether a target was reached. Instead, it should be evaluated by whether the market structure was identified correctly before the move unfolded.
In this study, originally published nearly a year ago, the focus was not on predicting a specific price. Instead, the analysis emphasized the potential completion of a corrective structure, the identification of an invalidation level, a possible channel breakout, and the conditions that could support the beginning of a new impulsive wave.
📌 As time passed, the market gradually revealed the behavior anticipated by that structural framework:
✅ Completion of the corrective structure.
✅ Breakout above the descending channel.
✅ Beginning of an impulsive advance.
✅ Development of the early impulsive waves and continuation of the bullish sequence.
This is precisely what the Elliott Wave Principle is designed to help us understand.
🎓 Educational Note
Many traders believe the Elliott Wave Principle is a tool for predicting the future.
In reality, its purpose is different.
Rather than forecasting the future with certainty, Elliott Wave interprets the most probable market behavior based on structure, objective rules, and validated scenarios.
That is why an Elliott Wave analyst should:
🔹 Identify the structure first.
🔹 Define a clear invalidation level.
🔹 Wait for market confirmation.
🔹 Continuously update the wave count as new price information becomes available.
In other words...
The market always has the final word, but the structure often whispers first.
⚠️ Important Note
This comparison is not intended to claim perfect forecasting or guaranteed outcomes.
Its purpose is to demonstrate the value of structural thinking and the importance of following the objective rules of the Elliott Wave Principle when developing and managing market scenarios.
Success in financial markets comes from discipline, risk management, and respecting the rules—not from certainty.
📈 This analysis will be updated as the market continues to develop, allowing us to evaluate how the evolving wave structure aligns with the original scenario.
✍️ Mr. Nobody
🎧 Patterns whisper. I listen.
**AUDUSD Added to the Watchlist**7.16.2026
AUDUSD continues to respect its overall downtrend and has now pulled back into a high-interest area.
Price is testing:
✅ Previous swing low resistance.
✅ The downtrend line.
✅ The 50 EMA.
This confluence strengthens the bearish case, but we're **not** taking a trade simply because price has reached this zone.
Our next step is to let the market confirm the idea.
We'll be watching for:
✔️ Strong rejection at resistance.
✔️ Momentum hooking in the direction of the trend.
✔️ Volume confirming seller participation.
✔️ Full VMS 2.0 alignment before considering an entry.
The confluence is there. Now we wait for the market to do its part.
#AUDUSD #Forex #PriceAction #Trading #VMS20