AVAUSDT Forming Falling WedgeAVAUSDT is forming a clear falling wedge pattern, a classic bullish wave signal that often indicates an upcoming breakout. The price has been consolidating within a narrowing range, suggesting that selling pressure is weakening while buyers are beginning to regain control. With consistent volume confirming accumulation at lower levels, the setup hints at a potential bullish breakout soon. The projected move could lead to an impressive gain of around 50% to 60% once the price breaks above the wedge resistance.
This falling wedge pattern is typically seen at the end of downtrends or corrective phases, and it represents a potential shift in market sentiment from bearish to bullish. Traders closely watching AVAUSDT are noting the strengthening momentum as it nears a breakout zone. The healthy trading volume adds confidence to this pattern, showing that market participants are positioning early in anticipation of a reversal.
Investors' growing interest in AVAUSDT reflects rising confidence in the project's long-term fundamentals and current technical strength. If the breakout confirms with sustained buying volume, this could mark the start of a fresh bullish leg. Traders might find this a valuable setup for medium-term gains, especially as the falling wedge pattern completes and buying momentum continues to accelerate.
✅ Show your support by hitting the like button and
✅ Leaving a comment below! (What is You opinion about this Coin)
Your feedback and engagement keep me inspired to share more insightful market analysis with you!
In-depth trading ideas
AVAUSDT - Bear Flag, Is a Deeper Correction Ahead?AVAUSDT on the 8H timeframe is currently forming a 🐻 Bear Flag, a classic bearish continuation pattern that typically appears after a sharp decline (📉 Flagpole) followed by a temporary upward consolidation within a rising channel.
At the moment, price is testing the lower boundary of the channel and showing signs of weakening bullish momentum. If this support fails to hold, the probability of a continuation to the downside increases significantly.
---
🐻📉 Bear Flag Pattern Explanation
❓ What is a Bear Flag?
A Bear Flag is a bearish continuation pattern consisting of three main phases:
1️⃣ 📉 Flagpole
- A strong and impulsive decline.
- Reflects aggressive selling pressure.
- Serves as the basis for projecting the next downside target.
2️⃣ 📈 Flag (Ascending Channel)
- Price moves gradually higher within a rising channel.
- Often represents a temporary relief rally or retracement.
- Frequently traps buyers before the downtrend resumes.
3️⃣ ⚠️ Breakdown
- Occurs when price breaks below channel support.
- Confirms bearish continuation.
- Often triggers the next leg down in the direction of the previous trend.
On this chart, the Bear Flag structure is clearly visible as price continues to consolidate within an ascending channel after a significant decline.
---
🎯 Key Levels
🟢 Major Support
📍 $0.1740
- Important horizontal support level.
- A key area that buyers must defend.
🟢 Next Support
📍 $0.1670
- Previous swing low.
- Primary downside target if a breakdown occurs.
🔴 Dynamic Resistance
📍 Upper Bear Flag Channel
📍 $0.2000 – $0.2100 Resistance Zone
---
🚀🐂 Bullish Scenario
For the bullish case to remain valid:
✅ Price must hold above $0.1740
✅ Buyers need to push price back toward the middle of the channel
✅ A breakout above the channel resistance around $0.2000 – $0.2100 would invalidate the Bear Flag structure
🎯 If a breakout occurs with strong volume confirmation, AVA could continue its recovery toward higher resistance levels.
---
🔻🐻 Bearish Scenario
This remains the dominant scenario based on the current market structure:
❌ Price fails to hold channel support
❌ Breakdown below $0.1740
❌ Bear Flag confirmation occurs with a strong candle close below support
🎯 Downside Target
📍 $0.1670
If selling pressure intensifies, AVA may seek even lower support levels before finding significant demand.
---
📈📌 Conclusion
AVAUSDT remains trapped within a 🐻 Bear Flag structure on the 8H timeframe.
As long as price remains below the channel resistance and fails to reclaim the $0.2000 area, bearish pressure continues to dominate the market.
⚠️ The $0.1740 level is the key area to watch.
📉 A confirmed breakdown below this support could validate the Bear Flag pattern and open the door for a move toward $0.1670 or potentially lower.
💡 Traders should wait for either a confirmed breakout or breakdown before taking larger positions, as the current zone is likely to determine the next major direction.
---
#AVAUSDT #AVA #BearFlag #BearishPattern #CryptoAnalysis #TechnicalAnalysis #Altcoin #CryptoTrading #PriceAction #ChartAnalysis #SupportAndResistance #MarketStructure #BreakdownAlert #SwingTrading #CryptoMarket #AltcoinAnalysis
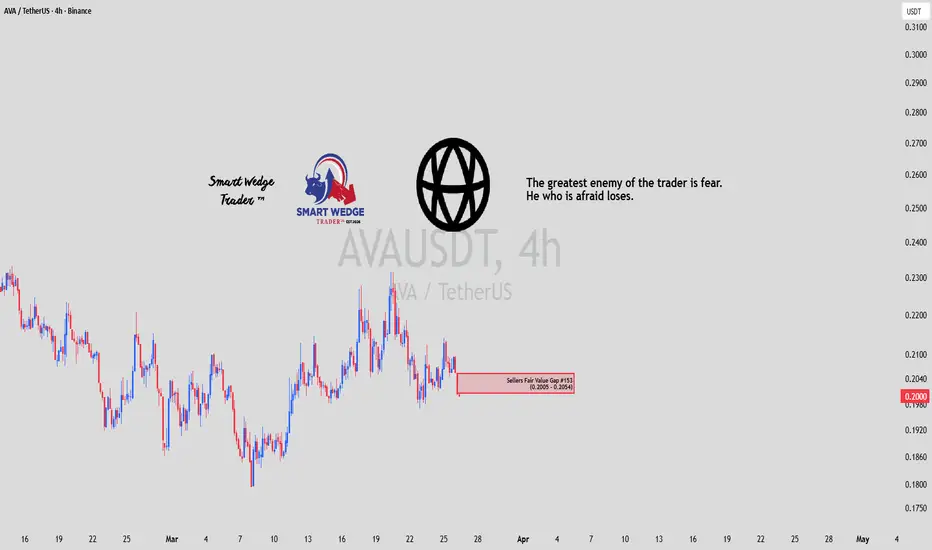
$AVA Tested: Bearish Pressure BuildingBINANCE:AVAUSDT
NYSE:AVA – Sellers Fair Value Gap #153 Tested: Bearish Pressure Building on 4H Chart ⚠️
🧐 Bearish Impulse Approaching Critical Imbalance Zone
AVA has been trading in a volatile range with clear lower highs and lower lows over the past weeks. The price has now reached and is testing the Sellers Fair Value Gap #153 (0.2005 – 0.2054), currently sitting right at the 0.2001 level — a key area where sellers have previously shown strong control.
📉 Current Market Structure:
- Extended bearish move visible on the 4H timeframe
- Multiple strong red candles indicating sustained selling pressure
- Price interacting directly with the unfilled Sellers FVG after a sharp decline from recent highs
💡 Possible Scenarios:
1. Bearish Continuation → If price fails to hold above 0.2001 and closes decisively below the gap (under 0.2005), we could see further downside targeting 0.1860 – 0.1750 zone as the next major demand area.
2. Short-Term Bounce / Relief Rally → The FVG often acts as temporary support. A rejection here with bullish candle formation or higher low could trigger a corrective move toward 0.2100 – 0.2200 first, before any new leg down.
⚠️ Key Levels to Watch:
- Support: 0.2005 – 0.2054 (Sellers FVG – critical zone)
- Resistance: 0.2100 then 0.2200 – 0.2300
- Invalidation of any bullish bounce: sustained close below 0.1980
This setup highlights the classic “fear is the greatest enemy” moment in trading — patience is required while price interacts with this imbalance. Let volume and candle structure confirm the next direction.
#AVA #AVAUSDT #Travala #Crypto #Altcoins #FairValueGap #SellersFVG #SmartWedgeTrader #TradingView #CryptoTrading #BearishPressure
AVA (Travala) — Deep Value or Dead Coin? (Mar 2026)Price sitting around $0.20 after a full breakdown from prior range ($0.35–0.40). Now forming a base at $0.18–0.22 with early signs of stabilization. Still bearish HTF, but this is where reversals start, not confirm.
Structure:
Support: $0.18
Resistance: $0.25 → $0.32
Trend: Downtrend → potential accumulation
Plan:
Entry: $0.18–0.22
TP1: $0.25
TP2: $0.32–0.35
TP3: $0.50
SL: < $0.15
Alt (confirmation):
Enter after reclaim $0.25
Target $0.30+
Fundamentals (important here):
Travala is not a meme — it’s a real revenue business:
~$7M monthly revenue, 500k+ users
Token tied to bookings, discounts, and rewards
Buyback + loyalty loop supports demand over time
BUT:
Market cap only ~$15M → very small
Inflation still ~5% yearly → constant sell pressure
No strong narrative → price lags despite growth
Thesis:
This is undervalued utility coin with weak narrative.
Good fundamentals ≠ price pump (yet).
👉 Play it as accumulation, not breakout.
Invalidation: Lose $0.18 → likely $0.12 next (or even bellow $0.07).
#AVA #Crypto #Altcoins #LowCap
AVA Falling Wedge at Demand | Reversal Setup FormingAVA is forming a clear falling wedge pattern on the 1D timeframe, with price compressing toward the lower boundary of the structure. The current pullback has reached a key demand zone around 0.30–0.28, aligning with the 0.618–0.786 Fibonacci retracement.
Falling wedges are typically bullish reversal structures. As long as this demand zone holds, price can rotate higher and attempt a breakout above wedge resistance. A confirmed breakout would open upside toward 0.33, followed by 0.38.
A clean loss of the demand zone would invalidate the setup and expose downside toward 0.23.
This is a critical reaction area.
AVA - Trading idea, probability of repetition
👋 Hello, traders! The previous trading idea played out successfully. Since its publication, the price surged up to +642% at its peak. In this case, I managed to capture almost the maximum profit because the pump happened with a single large candle without pullbacks, and I trailed the stop-loss along with the trend. A portion was closed in Zone 1, while Zones 4 and 5 were fully exited.
The price has returned to the channel, but there is still room for it to drop further—this should be taken into account.
According to my strategy, I am starting to re-enter the position.
📝An interesting coin. They have an app that allows you to book hotels, flights, and various activities using cryptocurrency. I’ve personally used it, and everything works perfectly. It’s traded on many major exchanges. Consider the final dip in your strategy—there’s no need to rush.
😕 I get it—right now, trading ideas aren’t on everyone’s mind...
🐻🐂 The market is always cyclical: periods of disappointment are followed by euphoria. If you look at the charts, moments like these—when most people feel hopeless—often turn out to be the best entry points. And then, when the market takes off, suddenly everyone is asking, "What should I buy?!"
At the bottom, people lose faith, and at the top, it's handed out freely!
🛒 I’ve noticed that most people hit the “Buy” button without hesitation, but when it comes to “Sell,” many freeze.
?!😎 Does it even matter where the price will go if you have a clear trading plan? Or is it much wiser to understand what to do in different market scenarios rather than chasing predictions!?
♾ You need to break out of the cycle of wrong decisions, or else they will keep repeating over and over again!)
Travala AVA - Interesting buying oportunityAVA is trading near a long-term support zone around $0.37, a level that has repeatedly acted as a historical floor. The token has been consolidating for months within a descending channel, and current price action suggests potential accumulation.
The broader trend remains neutral-to-bearish, but momentum indicators such as RSI are nearing oversold territory, hinting at possible reversal conditions. A breakout above the descending trendline and the 50-EMA could open the door to a short-term rally toward $0.47–$0.50.
The key medium-term resistance is at $0.78 — roughly a 2× move from current levels. If price manages to close above that mark on strong volume, it would confirm a structural breakout and could trigger a broader bullish shift across the chart, with potential to revisit the $1+ region over time.
Fundamentally, Travala has maintained a notable relationship with Binance and CZ (Changpeng Zhao). Binance previously backed TravelbyBit, which later merged with Travala, and the project migrated to Binance Chain early on. CZ has publicly acknowledged Binance’s early investment, and historically his mentions of AVA have driven strong upside volatility — showing that sentiment around Binance can directly influence AVA’s momentum.
Trade idea:
Entry zone: $0.37 – $0.42 (support region)
Take-profit 1: $0.50
Take-profit 2 / Key resistance: $0.78
Stop-loss: below $0.34 (confirming support breakdown)
Overall, AVA offers an asymmetric setup: limited downside near historical lows, with potential for a significant upside if the $0.78 barrier breaks. Watch for volume confirmation and Binance-related sentiment as catalysts.
AVA market snapshotAVA looks very interesting for the long term if it reclaims the $0.40 level. There’s potential for a 200% profit.
If the level is reclaimed, it would be a fake breakdown of the range. In that case, the prolonged accumulation would be a consolidation phase, which usually leads to a strong breakout. The longer the accumulation, the stronger the trend.
Targets: $0.80 and $2.00. Added to my watchlist.
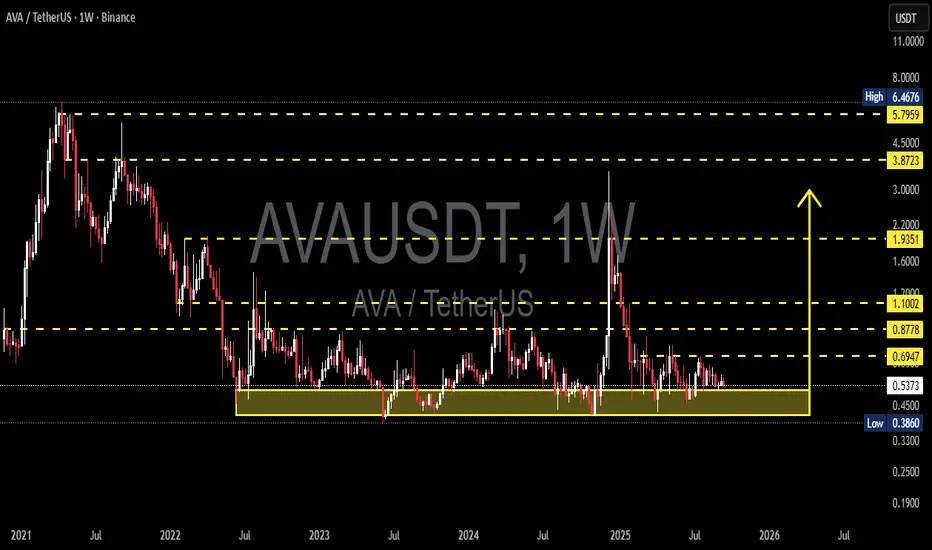
AVA/USDT —Demand Zone: Accumulation or Deeper Breakdown?📌 Overview
The AVA/USDT weekly chart shows a dramatic journey:
From the 2021 peak ($6–7), price has been in a prolonged downtrend followed by sideways consolidation since 2022.
For nearly 3 years, the yellow zone ($0.38 – $0.45) has acted as a battlefield between buyers and sellers.
Each test of this area has resulted in strong rebounds, marking it as a major demand zone.
Now, AVA is once again hovering near this critical support. The big question: Is this the ultimate long-term accumulation zone or the start of a deeper breakdown?
---
🔍 Pattern & Structure Analysis
Macro trend: Bearish since 2021 → long consolidation from 2022–2025.
Dominant pattern: Wide sideways range with a solid base at 0.38–0.45 and tiered resistances at 0.69, 0.87, 1.10, 1.93.
Price character:
Multiple lower wicks into demand zone → sign of liquidity grabs and potential accumulation by bigger players.
Prolonged sideways near lows suggests a possible bottoming formation.
However, compression against support can also lead to a breakdown if bulls lose control.
---
🟢 Bullish Scenario
If buyers defend 0.38–0.45 and push higher:
1. First confirmation: Weekly close above 0.6947.
2. Upside targets:
0.8778 → first mid-term resistance.
1.1002 → psychological & structural breakout zone.
1.9351 → major resistance, early trend reversal confirmation.
3. With strong momentum, a revisit of 3.87 – 5.79 (the 2021 supply zone) remains possible in the next bull cycle.
(Potential gains: +63% to 0.87 / +105% to 1.10 from current price ~0.53).
---
🔴 Bearish Scenario
If a strong weekly close below 0.386 occurs:
1. The 3-year demand zone will fail → showing buyers have lost control.
2. Downside target: 0.25 – 0.19 as the next realistic demand area.
3. Extreme measured-move projection even points to 0.07 (though unlikely, it must be considered).
(Downside risk: −53% to 0.25 from current price).
---
📊 Key Takeaways
$0.38–0.45 = pivotal demand zone for AVA’s next cycle.
Breakout above 0.69 = early bullish signal.
Breakdown below 0.38 = opens risk of new all-time lows.
This zone will decide whether AVA enters a new accumulation phase or faces final capitulation.
---
Critical demand zone = 0.38–0.45.
Watch 0.6947 breakout for bullish bias.
Watch 0.386 breakdown for bearish continuation.
Momentum will reveal if this is smart money accumulation or a last leg down.
---
#AVA #AVAUSDT #CryptoAnalysis #WeeklyChart #Altcoins #TechnicalAnalysis #SupportResistance #CryptoTrading #ChartPatterns
$AVA/USDT is Heating Up Are We About to See a Big Move?NYSE:AVA is testing a key descending trendline on the 6H chart.
A breakout above this level could trigger strong upside momentum.
Immediate targets are $0.5605, $0.6237, and $0.6776 with the potential to reach $0.7690.
I'm watching for breakout confirmation.
DYOR, NFA.
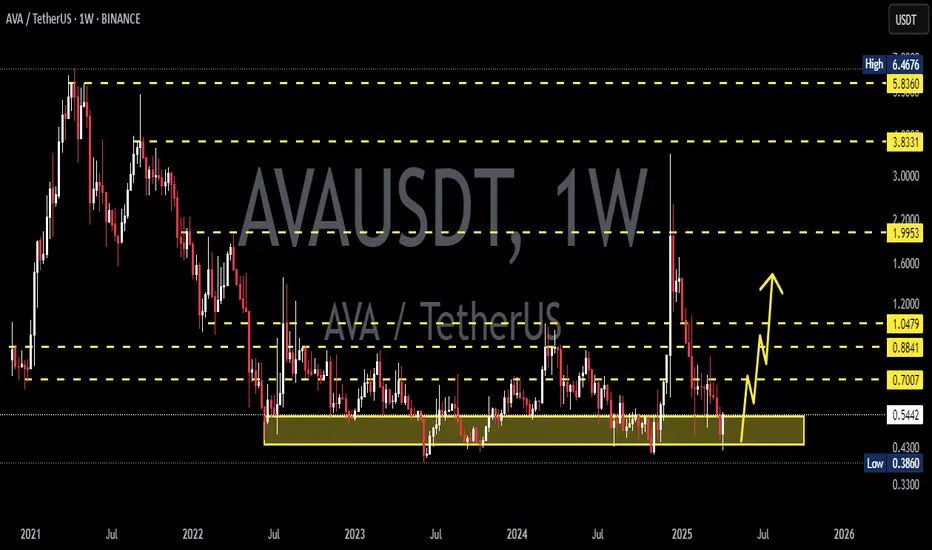
AVA/USDT Ready to Explode from Multi-Year Accumulation Zone! 📊 Technical Breakdown:
Major Accumulation Zone (Strong Support):
Price is currently trading within a long-term accumulation zone between $0.3860 - $0.5095 (highlighted in yellow). This zone has been tested multiple times since 2022 and has proven to be strong support.
Reversal Potential:
A projected upward movement from this support zone suggests a potential bullish reversal. Historically, AVA has shown strong rebounds from this area. A breakout with bullish weekly candles will likely confirm the uptrend.
🎯 Key Resistance Targets (Upon Successful Breakout):
1. $0.6947 – First major resistance, crucial for trend confirmation.
2. $0.7504 - $0.8778 – Short-term profit-taking zones.
3. $1.1002 - $1.9351 – Medium-term targets with historical consolidation.
4. $3.8723 - $5.7959 – Long-term targets if a full bull cycle resumes.
📉 Risk Management:
A breakdown below the accumulation zone (below $0.3860) will invalidate the bullish setup.
Beware of fakeouts — wait for weekly candle confirmation before entering.
📌 Conclusion:
AVA is at a critical juncture, sitting on a historically strong accumulation base. A breakout could ignite a significant bullish rally toward key resistance levels. Ideal entry lies near the current support with a tight stop-loss strategy.
#AVA #AVAUSDT #CryptoAnalysis #AltcoinSetup #TechnicalBreakout #BullishReversal #SupportZone #SwingTrade #Binance #CryptoSignals
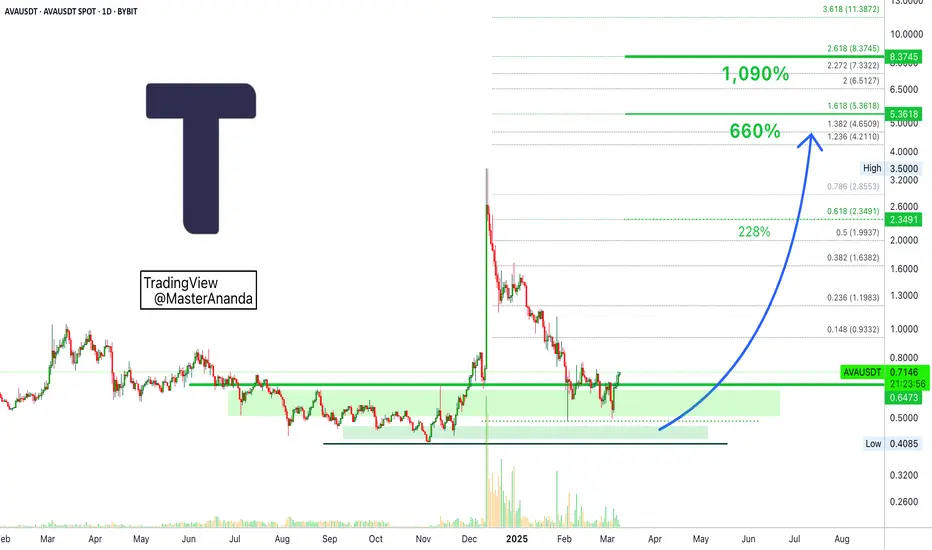
Travala Goes Bullish, The Wait Is Over —1,150% Profits PotentialHere it is, this is the same chart I shared back in early March this year. Notice the green line and the buy zone. It has been only two months and this zone was activated and the action is now moving back above it; this is ultra-bullish.
In the 8-March 2025 publication I mentioned that we should be ready to wait 6-8 months to see massive growth, and it is true; but, at the same time I was preparing you for the long-term. Bullish action will start now and very strong growth will happen within weeks or days.
If you are prepared to wait 8 months, you will be happy when your money start growing in a period of just 3-4 months. On the other hand, if you are prepared to wait 1 month, you will become anxious and furious and might even sell if the bullish action doesn't start after three months.
So I say, "think long-term."
Prepare to wait years but the truth is that the market will pay sooner, we just need to be patient and prepared.
» This is a strong chart setup and an easy trade; buy and hold.
Travala is ready to move now vs USDT (tether) as well as vs Bitcoin (BTC), it will be massive. You can now buy and hold and enjoy the profits as they come.
This is a friendly reminder.
Thanks a lot for your continued support.
(The targets can be seen on the chart —long-term, the final target will go higher than 1,150%.)
Namaste.
How To Book 1,000%+ Profits From Home —AVAUSDTHere is how to make 1,000% sitting at home. This is too simple, just buy and hold.
This is too short so I will have to write some more. I don't even know if this is legal, to make money this easily.
Travala (AVAUSDT) produced a classic, long-term, higher low and is trading above once a resistance level turned support. This opens the doors for growth. This is coupled by the fact that market conditions are about to change. Conditions are changing bearish to neutral, neutral to sideways, sideways to bullish, bullish to a strong growing phase.
Here is how to make an easy 660% in a matter of months. Buy and hold.
This is enough.
I hope you can take this winning chart setup home.
➢ If it drops, hold.
➢ If it does nothing (more sideways), hold.
➢ If it starts to rise, hold.
➢ Once your target is reached, sell and that's done.
It is very simple. It requires patience and beforehand planning. The plan has been explained above. Whatever happens, you just hold —focus on the long-term. If you can wait 3, 4, 5, 6 months, this is it, it is a done deal. Sometimes it can take 8 months but that's ok, because the amount of profits is great. Sometimes the entire bullish wave can develop within 1 month. We prepare to wait long-term but if our target hits sooner, even better. We take the profits and move on.
There is no way to lose. You can only lose if you sell when prices are below your entry point. If you hold until it grows, that's it. This can be done with all pairs. If it grows, good, take profits and move on. If it drops, wait until it recovers. A simple strategy.
Namaste.
AVA/USDT Weekly Technical Outlook
#AVA is showing renewed strength after multiple weeks of downside.
If momentum continues and the breakout confirms, AVA may rally over +300% from current levels based on the structure shown
Strong bounce from a key weekly support zone.
Formed a bullish engulfing candle after extended consolidation near the bottom.
Descending wedge pattern potentially breaking to the upside – a classic reversal signal.
🎯 Price Targets:
T1 – $1.4931: Key horizontal resistance from previous structure
T2 – $1.9113: Mid-range resistance
T3 – $2.4417: Full breakout extension target
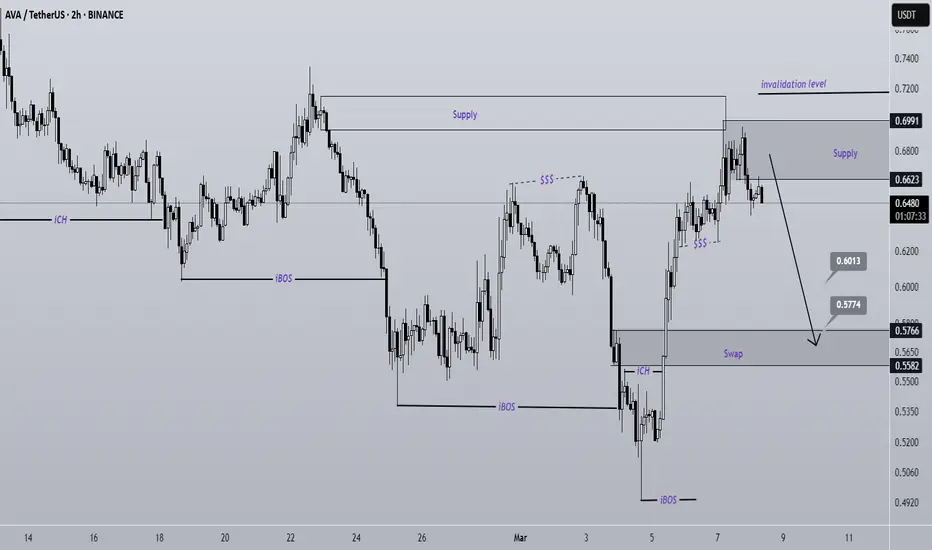
AVA Sell/Short Setup (2H)Given the bearish structure of AVA and the collection of Sell orders as functions, one can look for sell/short positions on the supply range
A 4-hour candle close above the invalidation level will violate this analysis
Do not enter the position without capital management and stop setting
Comment if you have any questions
thank you
AVA/USDTKey Level Zone: 0.6820 - 0.6900
HMT v5 detected. The setup looks promising, supported by a previous upward/downward trend with increasing volume and momentum, presenting an excellent reward-to-risk opportunity.
HMT (High Momentum Trending):
HMT is based on trend, momentum, volume, and market structure across multiple timeframes. It highlights setups with strong potential for upward movement and higher rewards.
Whenever I spot a signal for my own trading, I’ll share it. Please note that conducting a comprehensive analysis on a single timeframe chart can be quite challenging and sometimes confusing. I appreciate your understanding of the effort involved.
Important Note :
Role of Key Levels:
- These zones are critical for analyzing price trends. If the key level zone holds, the price may continue trending in the expected direction. However, momentum may increase or decrease based on subsequent patterns.
- Breakouts: If the key level zone breaks, it signals a stop-out. For reversal traders, this presents an opportunity to consider switching direction, as the price often retests these zones, which may act as strong support-turned-resistance (or vice versa).
My Trading Rules
Risk Management
- Maximum risk per trade: 2.5%.
- Leverage: 5x.
Exit Strategy
Profit-Taking:
- Sell at least 70% on the 3rd wave up (LTF Wave 5).
- Typically, sell 50% during a high-volume spike.
- Adjust stop-loss to breakeven once the trade achieves a 1.5:1 reward-to-risk ratio.
- If the market shows signs of losing momentum or divergence, ill will exit at breakeven.
The market is highly dynamic and constantly changing. HMT signals and target profit (TP) levels are based on the current price and movement, but market conditions can shift instantly, so it is crucial to remain adaptable and follow the market's movement.
If you find this signal/analysis meaningful, kindly like and share it.
Thank you for your support~
Sharing this with love!
HMT v2.0:
- Major update to the Momentum indicator
- Reduced false signals from inaccurate momentum detection
- New screener with improved accuracy and fewer signals
HMT v3.0:
- Added liquidity factor to enhance trend continuation
- Improved potential for momentum-based plays
- Increased winning probability by reducing entries during peaks
HMT v3.1:
- Enhanced entry confirmation for improved reward-to-risk ratios
HMT v4.0:
- Incorporated buying and selling pressure in lower timeframes to enhance the probability of trending moves while optimizing entry timing and scaling
HMT v4.1:
- Enhanced take-profit (TP) target by incorporating market structure analysis
HMT v5 :
Date: 23/01/2025
- Refined wave analysis for trending conditions
- Incorporated lower timeframe (LTF) momentum to strengthen trend reliability
- Re-aligned and re-balanced entry conditions for improved accuracy