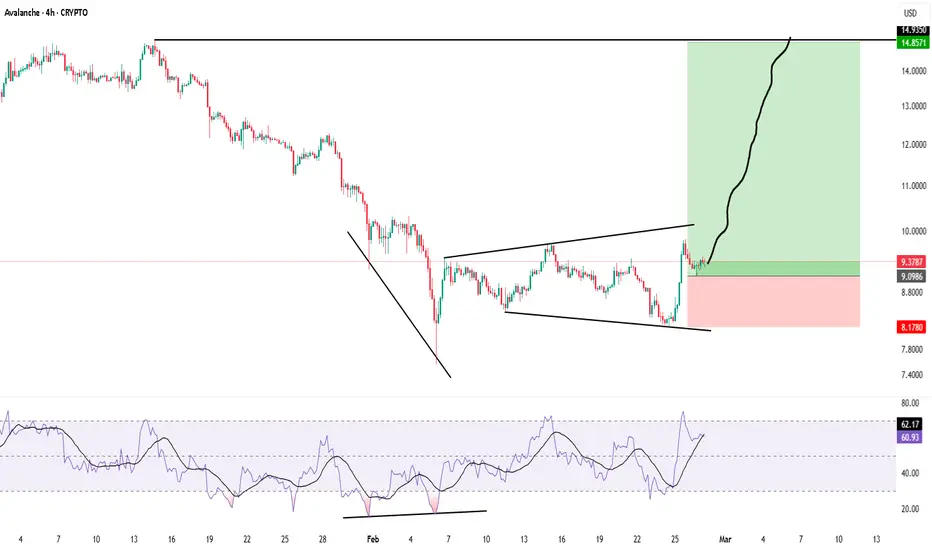
AVAX validated double bottom breakout. Target = 13.50AVAX has commenced moonshotting. Next target is 13.50 *not financial advice* Golden cross happening soon. by DrDovetail112
AVAX: $10.50open-source platform designed to process transactions quickly and support decentralized applications it may re gain the narrative, users, liquidity, and mindshare this TOKENiZATiON season just as ZEC got a big fund pushing privacy so shall AVAX as the ultimate gaming rwa chain to hop on by senyor10x6
Is AVAX a sleeping giant soon to be awakened? Avalanche’s chart has looked more and more miserable as each month passes and is currently still rather cheap although it is hinting that its bottom may be in. Fundamentally this news just broke that the UAE announced its going to integrate Avalanche blockchain into its national digital identity platform UAE PASS. This should provide an initial spark to the wick at the end of the avalanche powder keg. I do believe montis group had also listed avalanche as one of the chains they would likely. Be using to tokenize assets in the future. With that in mind. We can see avalanche is steadily approaching the apex of the triangle it’s been in forever on the monthly chart. If it were to break out of the triangle where I have arbitrarily placed the dotted measured move line or sooner the breakout target would be at least a whopping $107. That is around a 1200% gain from current prices and somehow still less than AVAXs all time high. ots of potential here and AVAX is one of the projects I could see still finding a way to set new all time highs in the future. So with that in mind I personally am going to accumulate a little more at current levels just in case it can hit the breakout target of this triangle pattern. *not financial advice*by DrDovetail10
AVAX — Multi-Year Falling Wedge Targets $264 → $634 → $1,385Avalanche (AVAX) is approaching one of the most important areas on its long-term chart. On the monthly timeframe, AVAX has spent years compressing inside a large descending/falling wedge structure following its 2021 cycle high. Price is currently around $7.84, deep within the lower portion of the historical range, while the descending upper resistance and rising/lower structural support continue converging. That creates a straightforward thesis: The compression is interesting — but the bullish setup requires confirmation. The Macro Pattern AVAX has been establishing a sequence of declining macro highs while the lower boundary of the structure has compressed considerably more slowly. That has created the large wedge shown on the chart. What makes this particularly interesting is the timeframe. This isn't a 15-minute or daily pattern. The structure has developed over multiple years on the monthly chart, meaning a confirmed resolution could potentially become a major macro event for AVAX. I would be watching for: 1. Break of the descending macro trendline 2. Monthly acceptance outside the wedge 3. Expansion in momentum/participation 4. Ideally, a successful retest of former resistance as support Until then, AVAX remains inside the structure. First Major Objective — ~$129 The first major high-timeframe level is the previous cycle region around: 1.0 Fib: ~$129.66 This is important because AVAX doesn't immediately need to reach the extreme Fibonacci extensions for the setup to become meaningful. A recovery toward the previous macro high would already represent a substantial repricing from the current ~$7.84 area. But reclaiming that previous high is where the chart becomes considerably more interesting. Price Discovery Fibonacci Targets Above the former ATH region, the chart identifies three major Fibonacci extension zones: 1.272 — ~$263.77 This becomes the first major price-discovery target. It represents approximately: 33× current price from the ~$7.84 level shown on this chart. 1.414 — ~$633.79 The next major extension sits around: $634 This is a much more aggressive macro target and would require AVAX to first reclaim its previous cycle high and establish sustained price discovery. 1.618 — ~$1,385.22 The golden-ratio extension produces the largest primary target shown in the setup: ~$1,385 From approximately $7.84, that's roughly a 176× theoretical move. That number is obviously enormous, which is precisely why it should be treated as a long-term Fibonacci projection — not a prediction. There would be numerous resistance levels and market-structure decisions before AVAX ever reached that area. Why ~$264 Matters Most Of the three extension targets, $263–$264 is the level I would focus on first if AVAX eventually confirms the macro reversal. The roadmap becomes: Break Falling Wedge → Reclaim ~$30 → ~$50 → ~$84 → Previous ATH ~$130 → Price Discovery → ~$264 Only after AVAX successfully enters price discovery would I begin giving significant weight to: $634 and ultimately: $1,385 The chart can show us where mathematical extensions exist. Price action still has to earn them. Invalidation The bullish interpretation weakens materially if AVAX loses the lower macro structure and establishes sustained acceptance beneath the wedge. Likewise, another rejection from descending resistance means the breakout simply hasn't occurred yet. This is currently a setup — not a confirmed breakout. AVAX has spent years compressing. Now I'm watching to see whether this structure finally resolves. CRYPTOCAP:AVAX | Monthly Macro Analysis Educational analysis only. Fibonacci extensions and measured moves are technical projections, not guaranteed future prices. This is not financial advice. Always conduct your own research and manage risk.Longby STP_MrNodeItAll10
AVAX - time for reversal incomingAVAX had a long correction, just like ZEC. Looking at pattern we see similar pattern to XRP and ZEC where it seems we are now ending last corrective phase before a reversal. Expecting bounce up and push to test ATH range with possible overshoot and then we get again big correction (70-80%).Longby Zorroreny117
AVAX | Channel Broken Down — The Bounce Is OverAVAX | Rejected From Supply — The Downtrend Resumes Toward Liquidity! By analyzing the #AVAX (Avalanche) chart on the 4H timeframe, we can see that price remains firmly within a downtrend. Every attempt higher has been sold, and the most recent one just failed at a critical level — keeping sellers in full control. 📊 4H Timeframe On the 4H, the structure is clearly bearish. Price has printed a series of bearish BOS on its way down, and the most recent corrective rally pushed all the way up into the strong Supply Zone ( $6.87 – $7.08 ), tagging the Protected High at $7.08 . Crucially, price could only break that level with a wick — not a clean close. That's a textbook liquidity sweep, not a genuine break, and it keeps the bearish thesis fully intact. During that corrective rally, price had been climbing inside a tight ascending channel. That channel has now been broken to the downside — the exact signal that the correction is over and the dominant downtrend is resuming. With price trading around $6.43 , the path of least resistance points lower. 🎯 The Bias My base case is a continuation lower toward the sell-side liquidity (SSL) resting below at $5.67 . As long as price stays capped beneath the Protected High at $7.08 , every bounce into supply remains a selling opportunity rather than a reversal. In my view, the combination of a failed sweep at the Supply Zone and a broken ascending channel is a clean bearish signal — the market swept the liquidity above, and now it turns to hunt the liquidity below. The only thing that puts this idea on hold is a decisive 4H close back above the Protected High ($7.08), which would flip the short-term structure and open a move toward the liquidity overhead. 📰 Fundamental Backdrop The bearish structure lines up with a genuinely heavy news backdrop for AVAX. On July 11, Avalanche was removed from a Bitwise index fund, adding direct institutional selling pressure and highlighting how sensitive the token is to fund flows. That came alongside a reported "serious liquidity crisis" warning from Avalanche Treasury Corp as its AVAX reserves fell in value, and the resignation of AVAX One's CEO days after a stock-crash warning — a cluster of headlines weighing on sentiment. On-chain data reinforces the caution: persistent exchange net outflows and declining open interest show market participation remains subdued, with buyers lacking real conviction. There is a genuine bullish counter-current worth respecting — Hyundai just completed a USDT cross-border treasury pilot on Avalanche (settling in about seven minutes), the Avalanche Payments Collective keeps expanding, and two US-listed AVAX ETFs now exist. But until price can reclaim the supply zone with a clean close, the fundamentals and the chart point the same way: lower. AVAX still trades more than 95% below its 2021 all-time high, a reminder of how deep this trend runs. This analysis will be updated as the market evolves. If this breakdown added value, drop a like 👍 and a comment 💬 to support the work — and share where you see Avalanche heading next! Best Regards, BigBeluga 🐳by BigBeluga1125
AVALANCHE [$AVAX] Weekly TF Elliott Wave Crypto Analysis FIB TCAVAX update: My bearish outlook from February has played out almost exactly as anticipated. Price has remained inside the long-term descending channel, while the Wave C decline has continued to unfold toward the Fibonacci Golden Zone between $5.18 and $6.11. This is the area I’m watching most closely. If my Elliott Wave count is correct, AVAX should be approaching the final stages of this macro correction. That doesn’t necessarily mean the low is already in—Wave C could still extend slightly lower or produce a final capitulation before reversing—but the risk/reward for long-term investors is becoming increasingly attractive, with an ALGO TP at almost $500. The first meaningful confirmation of a trend reversal would be a sustained move back above the descending channel and a reclaim of the major swing highs. Until then, I continue to view rallies as corrective within the broader bearish structure. Like and follow for more Elliott Wave and macro crypto analysis.Longby Anakyn7
AVAXUSD | Continue to decline | Week, 15 - 19,2026Hello Traders! Let’s return to the cryptocurrency market. A familiar pattern has emerged in BINANCE:AVAXUSD , where a signal candle with valid volume has broken down from the trend line. Place a Sell stop order and wait for the market’s response.Shortby cncstarUpdated 220
$AVAX Warning: Big Mountain Ranges = BIG Crevices!Why the MountainBears are Growling The "Mountains of Avalanche" is looking shaky. Avalanche by name. Avalanche by nature? While the bulls are trying to hold the line, the chart is printing a Head and Shoulders pattern that looks like a final warning for Q1 2026 before breakdown (maybe q2) Negative Momentum: The MACD histogram on longer timeframes is showing weak momentum, and the RSI is hovering in a neutral-to-bearish zone near 38–42, suggesting sellers are slowly taking control. Institutional Caution: Despite ETF rumors earlier in the month, the current market structure favors caution over aggressive long positions until major resistance at $16.55 is cleared. Supply Hangover: A massive token unlock (9.5 million AVAX) is on the horizon, which could dump $240 million of fresh supply onto an already shaky market. #AVAX #Avalanche #HeadAndShoulders #CryptoWarning #TechnicalAnalysisShortby BallaJiUpdated 13133
AVAX | Jun, 2026 | The time to go long has come- Timeframe: Monthly - Trade type: Buy stop order - Price: 10.4828 - Take Profit: Open - Stop Loss: 8.6479 (-17.50 %) Idea: Long on a breakout above last monthly's high — bullish momentum continuation. Entry: Buy stop above last monthly’s high. Stop-loss: Below the low of the same candle. If the monthly candle closes below this level, the trade is invalidated. Take Profit: Trailing stop following the lows of new monthly candles. Feel free to like and share your thoughts in the comments! ❤️Longby Tired-WolfUpdated 119
AVAX double top neckline broke aiming for new cycle lowAVAX has broken the neckline on a double top targeting a new cycle low. It’s aiming for breaking out of its lower channel resistance which will bring it in line for a higher timeline double top targeting much lower.Shortby QuantMasterEcch0
AVAX double top flip chart short & macro cycle market analysisAVAX along with most other coins is seeing a big correction downward. It’s broken the neckline on a double top and the measured move is 7.41. The macd was trending down while price was heading up indicating a divergence on the indicator. Analysts have noted btcs rise to 82k was a mid cycle correction and is potentially going to bottom out at 45k. With on chain metrics off all coins showing large downside corrections that possibility is starting to seem like it’s more likely than not with the markets big downside corrections. As most traders know all other coins generally follow bitcoin’s price action until it has stabilized in price than profits from btcs run up get refunneled into altcoins. This time in the market cycle is called Altseason, and has seen 400x pumps in alts in prior seasons. One analyst noted on yesterday on Btc pizza day that the pump was reminiscent of alt season but I believe it was more of a mini alt season following mid cycle correction to 82k and the bigger run is coming after Btc bottoms at 45k and restabilizes after hitting new higher highs. The BEAR cycle is back with a vengeance so better to put your bear suit on than trying to run with the bulls at least until that time comes. Anyways happy trades everyone!Shortby QuantMasterEcch1
Breakout structure AVAUSDBreakout structure confirmed on AVAUSD 📈 Price respected trendline support perfectly and is now pushing toward the next major resistance zone. Eyes on the 10.00 psychological level — a clean break above could open the path toward the higher supply area marked on the chart. 🚀 Patience + structure = high probability setups. #AVAUSD #Crypto #TradingView #PriceAction #TechnicalAnalysis #Breakout #SupportAndResistance #SmartMoney #CryptoTrading #cyberaiLongby Cyber4PF4
BULLISH HIGH TIME FRAMEAltcoin season is coming and nobody is talking about it until its time to exit positions. been bullish on CRYPTOCAP:AVAX for years, this is a gem and I believe it is one of the few chosen ones that will see insane long term growth. One of the ways it will achieve this is through guaranteed support from BlackRock by providing future liquidity.Longby MotesTrades112
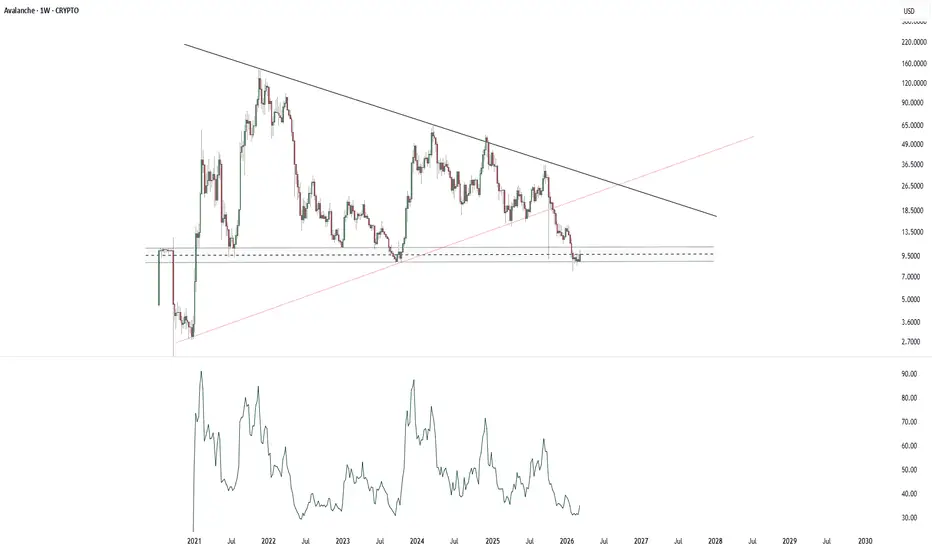
$AVAX / 8$ to 150$ CRYPTOCAP:AVAX ------------------------ If you step back from the daily noise and look at the Avalanche (AVAX) 1-Week chart, you are looking at one of the most asymmetric risk/reward setups in the current crypto market. Here is the professional breakdown of the core technical dynamics currently at play: Generational Support Block ($8 - $10) The dashed horizontal zone around the $8 mark represents the absolute floor for AVAX. As seen on the chart, the price has perfectly tested this historical demand zone and found strong buyers. This is the exact area where smart money accumulates quietly while retail investors are exhausted. Multi-Year Descending Resistance The solid black descending trendline has dictated the macro bear structure for years. Right now, the price action is in the ultimate compression phase, tightly squeezed between this multi-year resistance and the $8 horizontal support. In market mechanics, when price compresses at generational support below a massive descending trendline, the resulting breakout is usually violent and expansive. Weekly RSI Capitulation The most critical piece of data on this chart is the momentum oscillator at the bottom. The Weekly RSI has plunged to 33.83, hitting the historic red support line (extreme oversold territory). An RSI reset to this exact historical floor—while the price structure maintains its horizontal support—confirms that seller exhaustion is complete. This is the definition of technical capitulation. The Roadmap & Targets Target 1 (The Breakout): Once the descending trendline is breached with volume, the first major structural magnet is the $60 level. Target 2 (The Macro Cycle): A successful reclaim of the $60 pivot opens the gates for the ultimate macro cycle target, which is marked at $150. While the majority of the market is trapped in the "disbelief" stage, the structural foundations for the next markup phase are already built. As long as the $8 macro floor holds, the upside potential heavily outweighs the downside risk.by Cryptollica1119
Avalanche holding key support — traders positioning for a bouncCurrent Price: 9.72 (Analysis was generated on Monday Morning) Direction: LONG Confidence level: 52%(Direct trader snippets were limited, but price is holding a major support zone with strong buyer dominance and no aggressive bearish pressure, favoring a short-term upside attempt.) Targets Target 1: 10.20 Target 2: 10.80 Stop Levels Stop 1: 9.15 Stop 2: 8.60 Key Insights: Here’s what’s driving this setup. Avalanche is trading right above a well-established support band between $9.20 and $9.50, a zone that’s held multiple times over recent weeks. What stands out is buyer dominance on several major trading venues, with roughly 85–90% of active participants positioned on the buy side. That doesn’t guarantee upside, but it does tilt short-term risk-reward higher when price is this compressed. Another factor is relative positioning. AVAX is still down massively from its 2025 highs, which means a lot of weak hands have already been flushed out. When I look at similar setups across large-cap Layer 1 tokens, this kind of basing action often precedes relief moves back toward nearby resistance — in this case the psychological $10 level and the prior range highs just above it. Recent Performance: AVAX has been chopping sideways between roughly $8.70 and $9.80 after putting in a February low near $7.50. Over the last week, price action has tightened, volatility has cooled, and dips have been bought quickly. That’s classic consolidation behavior rather than panic selling, especially considering the broader crypto market has been uneven. Expert Analysis: Several professional traders I track tend to get interested when price holds higher lows above a key support zone while volume stabilizes. While there wasn’t strong directional language in the latest trader snippets, the absence of aggressive bearish commentary at this level is notable. Combined with clear horizontal support and improving short-term momentum, this leans toward a tactical long rather than pressing shorts into support. From a technical angle, a push above $10.00–$10.20 would likely trigger momentum-based buying and short covering, opening a path toward the $10.80 area within the week. News Impact: On the news side, Avalanche continues to benefit from longer-term narratives around network upgrades, lower fees, and ecosystem growth. There’s no negative catalyst hitting right now, and that matters. In quiet news environments, price often follows technical structure — and the structure here favors a bounce as long as $9.20 holds. Trading Recommendation: Here’s my take. I’m leaning LONG on Avalanche with a tight risk framework. This is not a high-conviction breakout trade — it’s a support-based bounce setup. I’d look to build exposure near current levels, take partial profits into $10.20, and reassess if momentum carries toward $10.80. If price loses $9.15 on a closing basis, I’m out — no arguing with the market. Longby CrowdWisdomTrading3
AVAX ROADMAP While the uneducated retail crowd is paralyzed by micro-volatility and generating doomsday narratives, institutional algorithms are tracking one of the most severe macroeconomic compressions in the sector. You are looking at the 1-Week (1W) structural anatomy of AVAX. $10 Volumetric Bedrock (Institutional Footprint): Direct your attention to the horizontal dashed axis at exactly $10.00. This is not a random psychological support level. It is a multi-year "Volumetric Void" where Smart Money has historically executed massive block absorptions. Price action has currently compressed flawlessly into this absolute macroeconomic floor. Terminal Apex (Variance Drag Reset): Observe the massive black descending vector originating from the 2021 structural peak, continuously suppressing the asset. The asset is now violently wedged between this multi-year dynamic resistance and the $10 absolute bedrock. In quantitative geometry, this is defined as a "Terminal Apex." Volatility has mathematically flatlined. Momentum Eradication (Seller Exhaustion): A structural apex is meaningless without momentum confirmation. Look at the lower oscillator panel. The kinetic momentum vector has violently collapsed back to the ~30 baseline—the exact historical capitulation zone that birthed previous macro expansions. Downward kinetic energy (Variance Drag) is mathematically dead. Synthesis & Algorithmic Execution: Absolute compression mathematically dictates absolute expansion. Smart Money is utilizing the $10 bedrock to silently vacuum up the remaining supply before the algorithmic rotation fractures the multi-year descending trendline. You are panic-selling absolute scarcity at a generational volumetric floor because you lack the analytical discipline to read a 1W chart. The pricing asymmetry here is absolute. Don't be the exit liquidity for institutional Quants. by Cryptollica8
AVAX - High probability of upside Don’t sleep on this guys. Daily chart showing a recent double bottom and now producing a bull flag with inside bar price action. It’s at near all time low sitting on major support. There’s a trade with an upside of 50% hereLongby geordiecrew773
AVAX downtrend continuesIt seems that CRYPTOCAP:AVAX has formed a double top. So price should continue its downtrend. If you want to get my analysis of your altcoin send me a DM.by Stan_Leimanis0
AVAX mid-term perspectiveWe can see convergence then forming of broadening wedge pattern. So I think that CRYPTOCAP:AVAX should continue its upward move out of this broadening wedge pattern in the mid-term. If you want to get my analysis of your altcoin send me a DM. by Stan_LeimanisUpdated 115
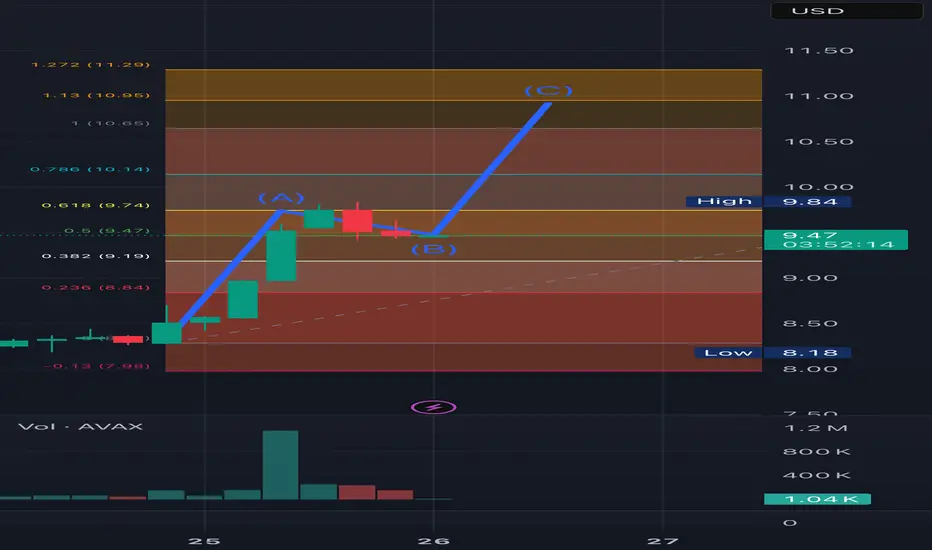
AXAXUSDT LOOKING TO PUSH HIGHER TO $10.50-$11With the AMA tomorrow and the token clearly oversold the $9 price is a bargain. Target for short term is $10.50-10.95 and $20 target over the next couple months leading up to the locked token release. We clearly have a big move in the volume as a catalyst and we can confirm a further move to the upside if we hold above $9.52 over the next day. This is one of my three top picks for oversold tokens along with ADA and LINK. Longby FLASHGORDON104
AVAX - Long-Term Analysis (Outlook to 2029)AVAX could have solid upside potential by 2029, especially if the broader crypto market follows the usual Bitcoin cycle pattern. Historically, Bitcoin tends to rise first after a halving event, and later money flows into other major cryptocurrencies. In that phase, projects like Avalanche often move more aggressively than Bitcoin — both upward and downward. Avalanche’s main strength is its ability to support multiple customized networks built for specific purposes, such as gaming, financial assets, or business applications. This flexibility can make it attractive for developers who want lower costs and faster transactions compared to more crowded blockchains. From a supply perspective, AVAX has a maximum limit, and part of the transaction fees are permanently removed from circulation. This can help reduce supply over time if network usage grows. However, new tokens are still created through staking rewards, and previously locked tokens may enter the market, which can create selling pressure. For AVAX to reach significantly higher valuations by 2029, real growth is essential — meaning more users, more applications, higher transaction activity, and consistent demand for the network. If the crypto market enters a strong expansion phase after the 2028 Bitcoin halving, AVAX could outperform Bitcoin due to its higher volatility. That said, competition among blockchains remains intense, and long-term success will depend less on promises and more on measurable adoption and real economic activity on the network.Longby fxliquiditylab5
AVAX – Short to Mid‑Term OutlookAvalanche (AVAX) is forming a descending flag pattern within a short‑term corrective phase. Attention should be paid to the dynamic support level — if it breaks, a deeper correction toward the previous low area may follow. Alternatively, as long as this support holds, a potential 20%–25% rebound remains technically possible. Not financial advice.by mahshiddadashzadeh10