Wave Analysis - AVAX (4H) Triple Combo IncomingJust like many other assets in the crypto market, AVAX also recently finished its first impulsive wave. This "first" impulsive wave is actually only a small portion of what's about to come in the coming months.
This entire structure is merely wave 1 and wave 2 (incomplete) on the weekly timeframe.
Wave 1 was already completed weeks ago. Wave 2 is about to finish, and what comes next is going to be the real money printer.
Let's examine wave 2 first:
What you see on the lower timeframes is one
AVALANCHE/USD TETHER
No trades
No trades
In-depth trading ideas
AVAX/USDT: Will the Important Support Level Hold or Break?Hey everyone!
Avalanche (AVAX/USDT) is currently trading at a important technical area, testing an important support level that could determine the direction of its next major price movement.
The market is currently showing signs of consolidation near this support area, making it essential to monitor how buyers and sellers react over the coming trading sessions.
🐂 Bullish Scenario: If the important support level holds and the price shows clear signs of a bullish reversal, we could see a recov
AVAXUSDT – Sellers Defend Key ResistanceHello traders! What are your thoughts on AVAXUSDT?
Avalanche is trading around 8.54 USDT, struggling to maintain its recent recovery as the broader crypto market remains under pressure. Despite a strong rebound from the 8.00 USDT support area, buyers have failed to sustain momentum, suggesting that selling pressure is still present.
From a technical perspective, AVAXUSDT has faced a sharp rejection from the 9.00–9.20 USDT resistance zone on the H4 chart, where sellers have repeatedly stepped i
AVAX/USDT – Bullish Bounce After a Liquidity Flush, M15AVAX spiked to about 9.15 on November 4, then spent hours ranging between roughly 8.60 and 8.85, with several small structure shifts inside the range. That range finally broke down, and price fell sharply through both EMAs to a low near 8.12. The sell-off was fast and one-directional, which usually leaves a liquidity flush at the lows. Price has now bounced and is holding just above 8.268, the level where a bullish change of character is expected on the 7-minute chart.
Momentum
RSI (14) dropped
AVAX — Avalanche at a Critical Technical Zone | Breakout or DeepAVAX — Avalanche at a Critical Technical Zone | Breakout or Deeper Correction?
Avalanche (AVAX) is a high-performance Layer-1 blockchain designed for scalability, fast transaction finality, and decentralized applications. Its ecosystem supports DeFi, tokenized real-world assets (RWA), gaming, and institutional blockchain solutions.
Fundamental Perspective
Avalanche's long-term potential is supported by its customizable blockchain infrastructure, Avalanche L1 networks, and growing focus on ins
#AVAXUSDT – Bullish Outlook and Key Support Levels#AVAX
The price has been trading within an established uptrend on the 12-hour timeframe since August. This ascending trendline has acted as a strong dynamic support level, with price consistently respecting it and bouncing whenever it has been tested. The market is currently testing this support once again, keeping the possibility of further upside movement in play.
The technical indicators provide additional support for this bullish scenario. The latest price reaction coincided with the RSI r
AVAX 8H – NYSE News Spike Off TrendlineAvalanche is trading around 8.863 on the 8H timeframe after a vertical candle off the ascending trendline near 7.80, with price reclaiming the 8.30 range support as news hit that Avalanche will supply core ledger technology for the clearing and settlement layer of an NYSE affiliated tokenized securities platform, pending regulatory approval.
The structure here began with the August 3 low near 6.15, where the rising trendline originates. AVAX built a base between 6.30 and 7.10 through August, th
HOW-TO: read Augury Grid's status column, an AVAX exampleAugury Grid scans 7 coins on 3 timeframes (15 minutes, 4 hours, daily) and ranks the 21 results in one table. When a row reads neither Bull nor Bear, its Bias column shows a status instead. We measured what that status tells you.
Before you start
This is the status column as it works from Augury Grid v1.1. In v1.0 the column showed 💀 SL Hit or 💀 Stale on almost every candle, so the hints below never reached the table. v1.1 fixes that. If Augury Grid was already on your chart, remove it and a
AVAX/USDT – Bearish Rejection at the 9.08 Resistance, M15Context
AVAX has been in a clear downtrend since the 10.00 high on October 21, with lower highs along the way (about 9.10 on October 28, then about 9.05 on November 1). After the sharp drop on October 30 to a low near 8.00, price bounced back to the 9.08 resistance, failed there for the second time and rolled over. It is now trading below both the EMA 200 (8.559) and the EMA 50 (8.438), which confirms sellers are back in control. The entry at 8.644 came from the retest of the EMA zone after the
AVAXUSDT Analyses-88, November 3, 2026One Setup, Two Entry Opportunities
BINANCE:AVAXUSDT
AVAX is attempting a short-term recovery after reacting to the 8.285 demand area. Although the broader 1H structure remains under bearish pressure, buyers have managed to push price back above the local support.
My trade plan has two stages:
Phase 1 — Initial Buy
Entry: 8.392 | Stop Loss: 8.285
The first position is already active, with 8.606 (R/R:2) as the primary profit objective.
Phase 2 — Pullback Opportunity
A return toward t
Avalanche (AVAX) new bull market cycle confirmed Let's considerLet's consider AVAXUSDT (Avalanche) in isolation, not taking into consideration the rest of the market. This chart on its own, what is it saying?
I am going to be focusing on two exponential moving averages (EMAs); EMA55 (magenta) and EMA89 (blue). I will couple this with price action on the candles based on resistance and support.
Avalanche technical analysis
A bearish cycle started after a peak in September 2025. AVAXUSDT started to drop after this date. In October 2025 the action moved b
AVAX 1D – Trendline Bounce After Extended DeclineAvalanche is trading around 8.568 on the daily timeframe after a wick tagged the ascending trendline near 8.00 and reversed, with price now recovering from a steady decline off the September high near 12.00.
The structure here began with the August 10 low near 6.10, where the rising trendline originates. AVAX built a base between roughly 7.00 and 8.30 through late August and early September, then broke out with a vertical daily candle on September 19 that carried price through 8.30 and up to 10
Avalanche is attempting a recovery after rebounding Avalanche is attempting a recovery after rebounding from below $8.00. The broader structure remains bearish, with price still beneath the descending trendline.
Price has reclaimed the shorter moving averages, while the declining longer average remains overhead. Volume increased around the recent low, showing renewed participation.
Buyers need to hold $8.20 and reclaim the $8.87–$9.00 resistance zone to strengthen the recovery. A successful trendline breakout would improve the outlook, while l
AVAX/USDT: Institutional Growth — Is $10.35 Next?AVAX trades near $8.20 as Avalanche gains institutional attention following news of its planned role in an NYSE-affiliated tokenized securities platform. While regulatory approval is pending, growing RWA adoption and DeFi activity support its long-term potential.
Fundamentally, Avalanche holds approximately $1.13B in stablecoins, $864M in RWA assets, and $618M in DeFi TVL, highlighting expanding blockchain adoption. However, institutional adoption does not guarantee immediate demand for AVAX.
AVAXUSDT: Recovery Runs Into a Wall, Next BreakdownAVAX is recovering from recent lows, but the broader 1H structure still favors sellers after the earlier channel breakdown.
Price is now approaching the 9.10–9.25 resistance zone, while the slower EMA remains overhead. If buyers fail to clear this area, the rebound could fade and send AVAX back toward 8.75, followed by 8.55–8.60.
Macro also supports caution. The Dollar Index is holding near a two-week high around 102.4, while the US 10-year yield is back above 5% ahead of the Fed decision. Bot
Avalanche: Key Weekly Support Comes Into FocusRecovery Faces Selling Pressure
CRYPTOCAP:AVAX has pulled back sharply after encountering resistance around $10.50, following its recent recovery from the $5.68 low. Although the earlier double bottom and subsequent bullish change of character improved the weekly structure, the latest rejection has placed that recovery under pressure.
Important Support Approaching
Price is now heading towards the $8.50 support zone, an area that has attracted buyers on several previous occasions. The weekl
AVAX/USDT: Back to Accumulation After Short-Term Breakout TestAvalanche ( CRYPTOCAP:AVAX ) is currently printing an interesting structural setup on the 1D timeframe. Following a breakout above the Accumulation Area, the price has pulled back and re-entered the established area between the $10.38 - $8.70 region.
Key Technical Highlights:
Macro Trend: The broader Descending ATH Trend remains the major macro ceiling to watch for any structural trend reversal.
Support / Accumulation: The price is testing the core demand band (Accumulation Area), whi
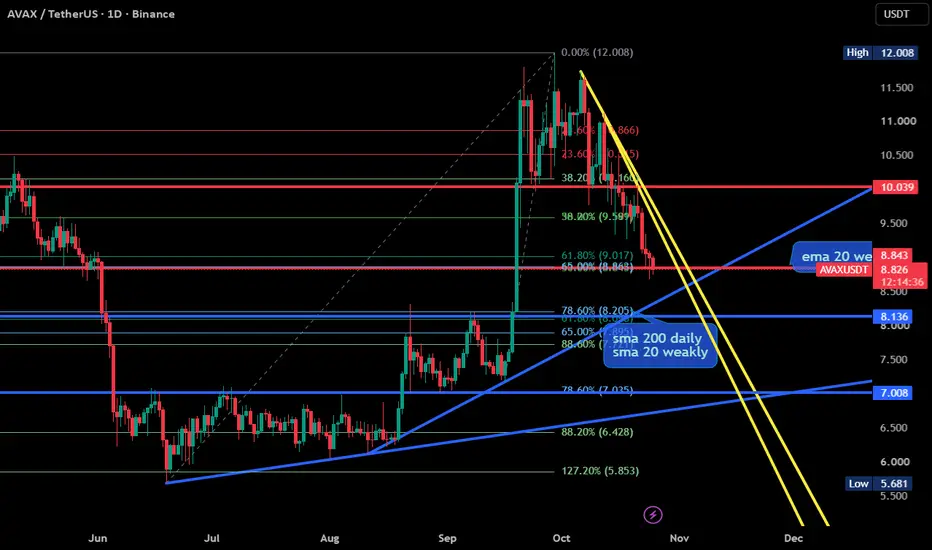
AVAX/usdt📥 Entry Strategy
Buy Area: $8.00 – $8.20
Confluence: 61.8% – 65.0% Fib Retracement + SMA 200 Daily & SMA 20 Weekly + Main Trendline
DCA: $7.03
Confluence: Deep Fib Retracement (78.6% lower wave) & Major Horizontal Support
🎯 Targets (TP)
🎯 TP1: $8.88
🎯 TP2: $9.58
🎯 TP3: $10.05
🛑 Risk Management (SL)
Stop Loss: Daily Close Below $7.03
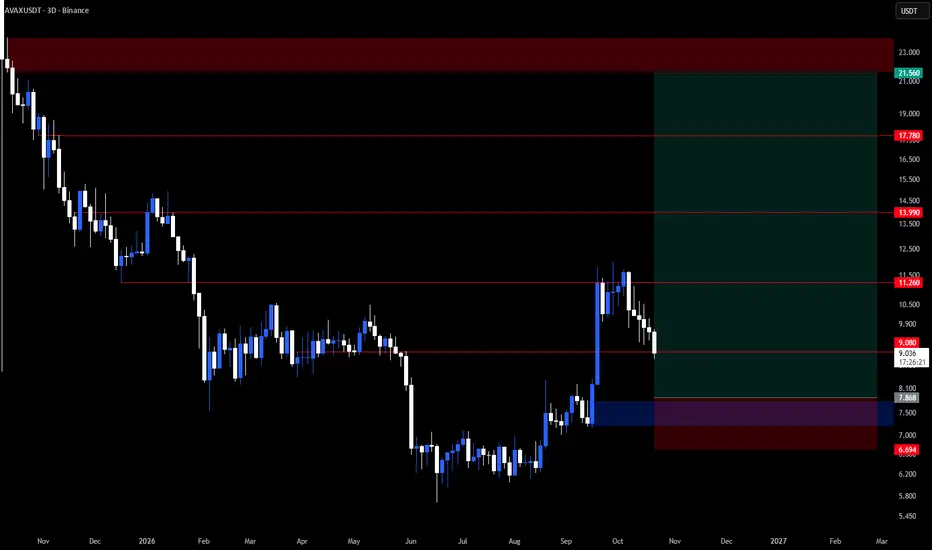
AVAX/USDT analysisAVAX appears to be recovering from its previous bearish structure after establishing a potential bottom around the $6.10 demand area.
The recent bullish impulse pushed the price towards the $11.260 resistance level, followed by a corrective pullback towards $9.080.
If the current support holds, AVAX could continue its bullish recovery towards $11.260, followed by $13.990 and $17.780, with a longer-term target at $21.560.
This bullish analysis is invalidated if the price falls below $6.694.
AVAXUSDT Analyses-70, October 21, 2026
Welcome to my page! I share daily technical analyses of crypto and other charts here.
BINANCE:AVAXUSDT
🔍 Market Structure Analysis:
AVAX remains bearish in the broader 1H structure, but the recovery from 9.429 and the breakout above local resistance indicate a short-term bullish shift.
🎯 Entry & Exit Signal:
Buy Entry: 9.762
Stop Loss: 9.571
Targets: 10.144 R/R:2 - 10.307 - 10.830 - 10.856
Key Support & Resistance:
Key Resistance: 10.307 / 10.856
Key Support Area: 9.571
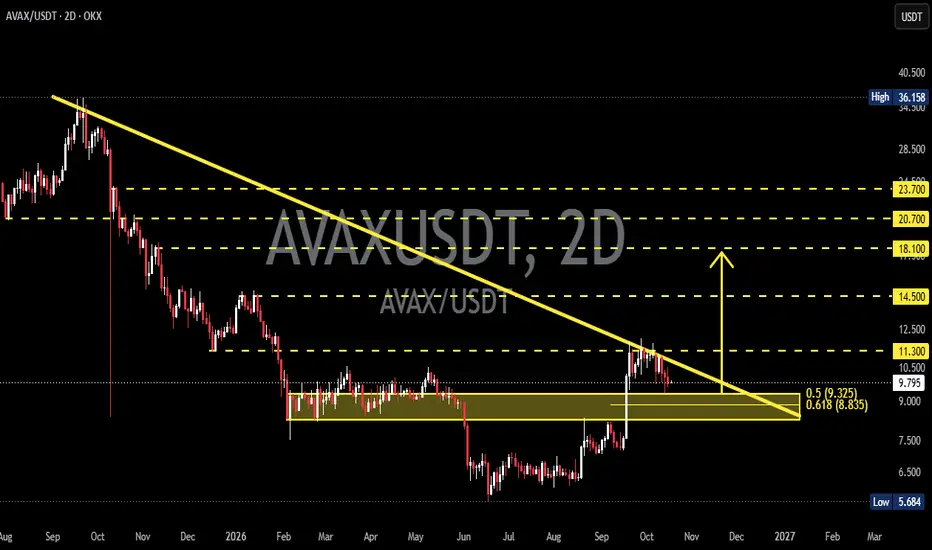
AVAX at a Turning Point, Support Retest?AVAX continues to trade below a Descending Trendline, indicating that the medium-term downtrend remains a major challenge for buyers. This trendline has repeatedly limited price movements and could continue to act as dynamic resistance.
However, after forming a low around $5.68, the price began to recover and climbed toward $11.30 before facing renewed selling pressure.
This development opens the possibility of a momentum shift, although confirmation of a trend reversal is still needed.
🟨 Key