avax drops to $8gm,
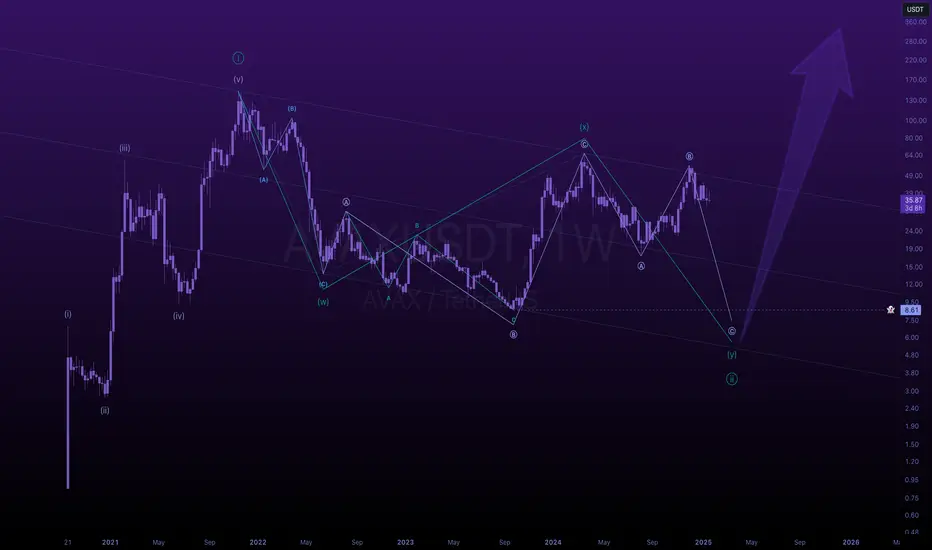
i came up with this theory a few years ago, and it's been lingering in the back of my mind ever since. it's one of the primary reasons i exited near the recent highs and have been sitting on my hands ever since.
you can check out my original theory here:
keep in mind that 98% of my work is completely private,
shared only with the members of lunar syndicate 9.
---
iโve decided to make this idea public today, mainly because, wellโฆ
ainโt nobody gonna believe me anyway xD
---
so here it is:
over the next month or two,
avax is likely to drop down to $8,
where a multi-year bottom will form!
if we get it, buy the dip with both hands.
nothing lost if we donโt.
๐
In-depth trading ideas
๏ปฟAVAX USDT LONG SIGNAL
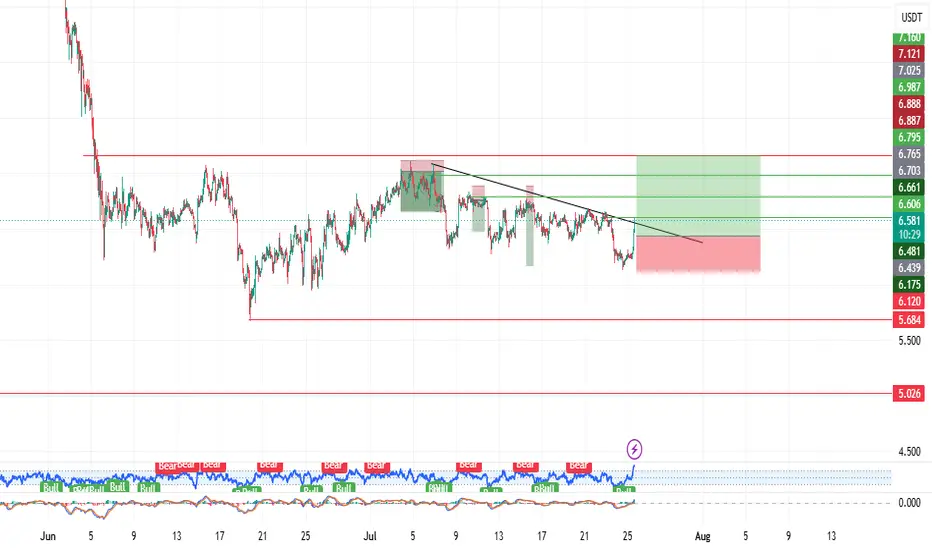
#121. AVAX/USDT โ Trade Setup (LONG)
๐ Position Type: LONG
๐ Timeframe: 1H
๐ Market: Futures
๐ฐ Entry Zone:
6.481
๐ Stop-Loss:
6.120
๐ฏ Take-Profit Targets:
โข TP1:ย 6.600
โข TP2: 6.795
โข TP3: 6.987
โข TP4: 7.170
โ๏ธ Leverage:
5 *10
โซ๏ธ After TP1, move SL to Entry + 0.2%.
โช๏ธ Exit Plan:
โข 40% at TP1
โข 20% at TP2
โข 20% at TP3
ย 20..TP4
๐ Risk Management:
Risk only 1โ2% of your capital per trade.
โ ๏ธ Always check and confirm the setup on your chart before entering the trade.
#AVAXUSDT : The Calm Before the Squeeze Storm
#AVAX
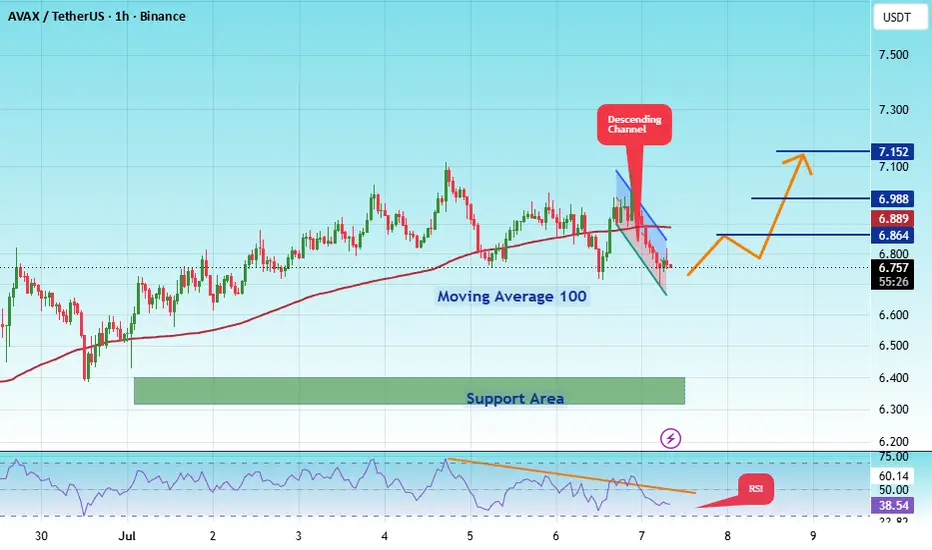
The price is moving within a descending channel on the 1-hour timeframe and has reached the lower boundary. It is now poised for a bounce and is expected to retest this boundary.
The Relative Strength Index (RSI) indicates a downward trend, which is likely to continue given the overbought conditions.
There is a key support zone in green at 6.30, and the price has bounced off this zone several times, making it a strong support level.
The price is trending towards the 100-period moving average, which we are approaching. This trend supports an upward move.
Entry Price: 6.50
Target 1: 6.55
Target 2: 6.62
Target 3: 6.68
Stop Loss: At the resistance zone in green
Remember this simple rule: Money management.
Any questions, please leave a comment.
Thank you.
AVAX | Structure Flipped Bullish โ Buy The Dip Into The Void!
By analyzing the #AVAX (Avalanche) chart on the 2H timeframe, we can see that the short-term structure has flipped bullish after a strong reaction from demand. Price reclaimed control, broke its corrective trendline, and is now setting up for the next leg toward the liquidity above โ but a healthy dip is likely first. Let's break it down.
๐ 2H Timeframe
On the mid-timeframes (1H / 2H), price had been in a downtrend before shifting character โ it printed an internal CHoCH (i choch) to the upside and built a Protected Low at $5.684 , the structural line for the bullish thesis.
On the corrective move down that followed, price swept all the liquidity resting at the lows below, then reacted powerfully from the Order Block ( $6.034 โ $6.176 ) โ a strong, high-conviction bounce that confirms buyers are defending this zone. From there, price broke the descending trendline of the correction to the upside, which is the signal that the corrective phase is ending. Price is currently trading around $6.699 .
๐ฏ The Bias
My base case is bullish continuation, but with patience for a cleaner entry. After breaking the trendline, I expect price to pull back to retest either the broken trendline or the Liquidity Void (the imbalance around its 50% at $6.315 โ $6.622 ) โ and from that retest, launch the next impulsive leg higher. The draw on liquidity is the buy-side liquidity (BSL) resting overhead at $7.117 .
In my view, the current zone stays bullish as long as price holds above the Protected Low ($5.684) โ buying the dip into the void/trendline retest is the cleaner setup than chasing the current candle. A decisive break below the Protected Low invalidates the idea and flips the structure back bearish.
๐ฐ Fundamental Backdrop
The bullish structural shift comes against a mixed but stabilizing fundamental backdrop. AVAX has spent much of the month grinding near its lows โ trading more than 90% below its 2021 all-time high โ as broad altcoin weakness and earlier institutional headwinds (index removals, treasury-liquidity concerns) weighed on sentiment. But the base-building we're seeing on the chart lines up with genuine adoption signals: the Avalanche ecosystem has continued expanding its payments and institutional partnerships, and the recent bounce reflects buyers stepping in at depressed levels. The bigger picture stays two-sided โ the long-term trend is still deeply corrective and AVAX remains highly sensitive to Bitcoin's lead and the overall risk tone, so this is a structural bounce to trade tactically rather than a confirmed trend reversal. As always with high-beta alts, respect that a broad-market risk-off move could override the bullish setup โ which is exactly why the Protected Low ($5.684) is the line that keeps this idea valid.
This analysis will be updated as the market evolves. If this breakdown added value, drop a like ๐ and a comment ๐ฌ to support the work โ and share where you see Avalanche heading next! Best Regards, BigBeluga ๐ณ
AVAX: Bearish Trend DominatesAVAX: Bearish Trend Dominates โ Optimal Risk Management Strategy Ahead of Price Compression
AVAX is moving highly accurately in line with the long-term macro downtrend scenario projected in our previous analysis, continuing to reinforce the bears' absolute market dominance. Trend-following Short positions have delivered highly impressive profit performance, with the initial entry achieving a solid 4R return and the subsequent position accumulation logging an additional 1R gain. Although the overall technical indicators remain aligned in favor of a continuous downward trajectory, short-term price behavior is displaying sensitive shifts that demand high caution.
Based on the visual data from the daily chart , following the steep plunge, the price action has started to decelerate and transition into a sideways compression phase. The price is currently narrowing inside a short-term descending triangle pattern. The emergence of consecutive lower highs squeezing against the horizontal support floor indicates that bears are accumulating further intense selling pressure before the market can resume its primary direction.
Under these tight compression conditions, forcing premature market action before a clean breakdown introduces elevated structural risks. The wisest strategy right now is to focus heavily on risk management by proactively trailing stop-loss orders on existing Short positions to safeguard accumulated capital in the safest manner possible. Remain patient on the sidelines and await a definitive breakout signal from this descending triangle pattern to determine the next optimal execution plan.
Disclaimer: This is not financial advice, DYOR.
AVAX/USDT - It climbed back but it has not escaped the cage yetKatsu on the Bridge. The AVAX radar is showing an interesting, but quite tricky structure right now.
From the first sideways range, price broke down, then almost fully climbed back toward the previous range inside an ascending channel. However, that ascending channel turned out to be more of a corrective bounce, because on July 8, price broke down from it.
Since then, a new range has formed, roughly between 6.34 and 6.80. Right now, price is trading around 6.72, so we are already in the upper third of the range. This is important because this is not a good place to chase longs, while shorts are not active either until we see real rejection.
What Does the Market Structure Say?
After the big drop, the ascending channel may have looked bullish at first, but:
price could not hold above 7.00;
price broke down from the ascending channel;
the lower side of the previous channel no longer held;
the top of the new range formed lower, around 6.80.
Because of this, the 4H picture is still neutral, with a slightly bearish structural tone.
To talk about a real bullish reversal, AVAX would need to reclaim at least the 6.80โ7.00 area and hold above it.
The RSI is around 56, so there is some positive momentum, but it is not overbought yet. Buyers are getting stronger, but the indicator alone does not confirm a range breakout. Visible buying and selling volume look fairly balanced, so there is no clear directional decision yet.
Key Support and Resistance Levels
7.00 โ has stopped the move several times already
6.80 โ top of the current range, first major resistance
6.45โ6.50 โ reaction zone below the range midpoint
6.36 โ a support level, but not a very strong one in my opinion; currently the bottom of the sideways range
6.01 โ slowdown zone; if this cannot hold, then the previous low and final 4H defensive zone is around 5.68
LONG Setup โ Breakout and Retest
I would not buy blindly at the current price.
A cleaner long setup would activate if:
a 4H candle closes above 6.82;
price retests the broken resistance;
on the 15-minute or 1H chart, the 6.78โ6.82 zone starts acting as support.
Possible Plan
Entry: 6.79โ6.83
Stop Loss: below 6.65
TP1: 7.02โ7.07
TP2: 7.50 โ quite ambitious
Invalidation: close back below 6.70
With an entry around 6.81 and a stop around 6.65, the 7.07 target gives roughly a 2.0 RR setup. The key word here is confirmation. A single wick above 6.82 could easily be a liquidity grab. For a long setup, I want to see a proper close and a successful retest. Without that, the entry is just a lottery ticket.
SHORT Setup โ Rejection From the Range High
Based on the current chart position, this setup is closer to activation, but it is still not an automatic entry.
Short Conditions
For the short setup, I would want to see:
price wicking into the 6.78โ6.82 area;
price failing to hold above it;
a bearish SFP, bearish engulfing candle, or bearish ChoCh on the lower timeframe;
price moving back below 6.74.
Possible Plan
Entry: 6.76โ6.80, after confirmation
Stop Loss: around the 6.91 OB
TP1: 6.50
TP2: 6.42
TP3: 6.34
Invalidation: stable 4H close above 6.82
An entry around 6.78, with a stop at 6.91 and a second target at 6.42, gives roughly a 2.7 RR setup. But if price only ranges between 6.70 and 6.78, then there is no short either. I want to see a clear reaction from the top of the range.
This is not financial advice.
The raccoon was simply thinking out loud about AVAX today. I wrote down what I see, what I think, and how I would trade it.
Then either I am rightโฆ
or we learn from it. :))
AVAX PRESSURE IS BUILDING โ BREAKOUT OR TRAP?Yello Paradisers! Are you prepared for a potential sharp move on #AVAX, or are you still underestimating whatโs quietly building behind the scenes? At first glance, this structure might seem like a simple and healthy pullback. But when we strip away emotions and analyse the chart objectively, a completely different narrative emerges. This is not random price action โ this is a high-risk, high-opportunity zone where discipline matters far more than opinions.
๐#AVAX has recently printed a classic selling climax, followed by a climactic action candle supported by ultra-high volume. This is a textbook indication of accumulation. Historically, this exact behaviour appears when smart money begins positioning ahead of a larger move. While subtle to the untrained eye, this probability carries significant weight for experienced traders.
๐#AVAX has swept the lower trigger line of the selling climax and followed it with a strong momentum candle closing back within that trigger zone. It suggests that weak hands are being forced out, while stronger participants are stepping in with conviction. we have also seen a two-bar reversal forming near the bottom after the selling climax, adding another layer of bullish confluence. The most important level to watch now is just above the high of the climactic action candle. A confirmed breakout, supported by strong momentum, could open the path toward 9.700, which stands as a major structural resistance level.
๐#AVAX continues to respect its descending support trend-line. The recent price action has also formed a potential inverse head-and-shoulders pattern, while the RSI is showing a clear bullish divergence. Together, these confirmations strengthen the probability of bullish scenario, As long as prices maintains momentum inside the demand zone, the structure remains constructive. The first major resistance level to monitor is 8.500.
๐If #AVAX fails to hold bullish momentum and a momentum candle closes below 5.400, the current bullish probability becomes invalid. In that case, we could see further downside pressure.
That is why Paradisers, we are playing it safe right now. If you want to be consistently profitable, you need to be extremely patient and always wait only for the best, highest probability trading opportunities only on confirmations.
MyCryptoParadise
iFeel the success๐ด
AVAX USDT SHORT SIGNAL#77.AVAX ./USDT โ Trade Setup (SHORT )
๐ Position Type: SHORT
๐ Timeframe: 1H
๐ Market: Futures
๐ฐ Entry Zone:
6.703
๐ Stop-Loss:
6.887
๐ฏ Take-Profit Targets:
โข TP1..6.605
โข TP2: 6.480
โข TP3: 6.336
โข TP4: 6.178
โ๏ธ Leverage:
5 *10
โซ๏ธ After TP1, move SL to Entry + 0.2%.
โช๏ธ Exit Plan:
โข 40% at TP1
โข 20% at TP2
โข 20% at TP3
20% at. TP4
๐ Risk Management:
Risk only 1โ2% of your capital per trade.
โ ๏ธ Always check and confirm the setup on your chart before entering the trade.
โ ๏ธ
AVAX USDT SHORT SIGNAL#62. AVAX/USDT โ Trade Setup (SHORT)
๐ Position Type: SHORT
๐ Timeframe: 1 H
๐ Market: Futures
๐ฐ Entry Zone:
6.727
๐ Stop-Loss:
6.909
๐ฏ Take-Profit Targets:
โข TP1:ย 6.591
โข TP2:ย 6.456
โข TP3:ย 6.332
โข TP4:ย 6.172
TP5:ย
TP6:ย
โ๏ธ Leverage:
5- 10
โ ๏ธ After reaching TP1, move Stop-Loss to Entry Price.
๐ Risk Management:
Risk only 1โ2% of your capital per trade.
Always confirm the setup on your chart before entry
AVAX โ Local Breakout, Bigger Target Ahead**Technology Overview**
Avalanche (AVAX) is a Layer 1 blockchain designed to deliver high throughput, low transaction fees, and strong scalability for DeFi, NFTs, and decentralized applications (dApps). Its unique consensus mechanism and subnet architecture make it one of the leading blockchain platforms in the industry.
**Technical Analysis**
On the **1-hour chart**, the **larger trading range represents the long-term structure**, with price still trading within this broader framework.
At the same time, the **smaller trading range represents the local structure**, where price is currently approaching a potential breakout. We'll only consider a long position after a confirmed breakout of the local range. If that occurs, our **initial target** will be the **upper boundary of the larger trading range**.
If price then manages to break above the upper boundary of the larger range with confirmation, we'll look for continuation toward the **upper supply zone**, highlighted in red, which represents the **final target** of the trade.
Ideally, we'd like to see this setup develop alongside **strength in both Bitcoin and Ethereum**, as a bullish move in the two leading cryptocurrencies would significantly increase the probability of success. Even if AVAX shows relative strength on its own, we'll still wait for full confirmation and avoid entering based solely on the breakout.
Trade management will always be based on price action, market structure, and proper risk management.
**Disclaimer:**
This analysis is for educational and informational purposes only and should not be considered financial or investment advice. Always conduct your own research and manage your risk before making any trading decisions.
**Good luck to all of us!**
**Yours, The Chief.**
AVAX: local squeeze with $7.400 destinationThe Macro Picture ๐บ๏ธ
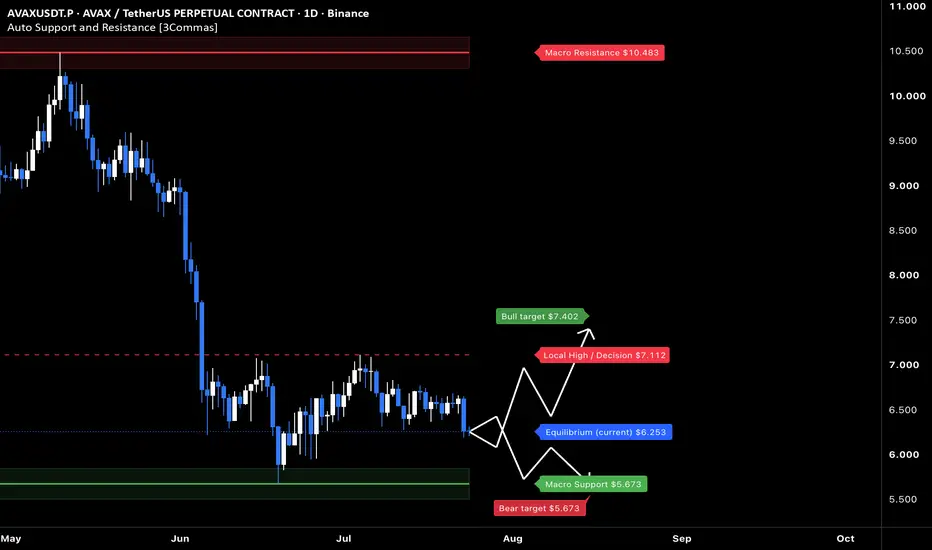
AVAX unwound from the $10.483 macro ceiling and has spent the summer basing in a $6โ7 band, now at $6.251 above the $5.673 macro floor. The steep selling has given way to a sideways grind โ a base rebuilding, not a breakdown.
The Setup โ๏ธ
The Range Floor ๐ข
$5.673 (Macro Support) is the demand base the range pivots on. It has held on retest through July, and that's the floor a recovery would build from.
The Decision Point ๐ด
$7.112 (Local High) is the gate. A daily close above it flips the local structure bullish; the $7.400 measured-move target sits just above it as the first objective.
The Roadmap ๐ฃ๏ธ
Hold above $5.673 โ break $7.112 โ run toward $7.400. Invalidation is a clean daily close below $5.673 โ that breaks the range.
This is a GRID Range Play: a defined band to rotate, buying the lower half and scaling out into the breakout.
More setups in profile.
#AVAX #Avalanche #crypto #trading #TA #3Commas #GRID
Potential Rebound Inside the Parallel Channel | Bullish SetupAVAX is approaching the lower boundary of a well-defined parallel channel, where a potential bullish reaction could occur.
If buyers defend this support zone, the price may start a recovery toward the channel's midline and possibly the upper resistance. This area offers an interesting risk-to-reward opportunity, but confirmation from price action and volume is recommended before entering a trade.
Key Levels:
Support: Lower boundary of the parallel channel
Target 1: Middle of the channel
Target 2: Upper channel resistance
Invalidation: A strong daily close below the channel support
Trade safe, manage your risk, and always wait for confirmation before entering a position
AVAX Stuck in Range, Next Breakout TO $7 ? Avalanche ( BINANCE:AVAXUSDT ) is trading inside a well-defined consolidation range on the 4H timeframe, following a strong impulse move earlier this month. After failing to sustain its previous uptrend, price is now compressing between key support and resistance while the 9 EMA and 20 EMA converge, signaling that a significant move could be approaching.
๐ Market Overview
Asset: Avalanche ( BSE:AVAX )
Pair: AVAX/USDT
Timeframe: 4H
Current Price: ~$6.67
Market Structure: Consolidation
Trend: Neutral (Awaiting Breakout)
EMA 9: ~$6.58
EMA 20: ~$6.54
๐ Technical Analysis
BINANCE:AVAXUSDT has transitioned from an impulsive rally into a sideways consolidation phase, repeatedly respecting both the upper and lower boundaries of the range.
The tight alignment of the 9 EMA and 20 EMA reflects market indecision, a condition that often precedes a strong directional move. Until price escapes this range, traders should focus on confirmation rather than anticipation.
๐ Bullish Scenario
A decisive 4H close above $6.7741 would confirm a breakout from the consolidation range and restore bullish momentum.
Bullish Targets
๐ฏ $7.0032
๐ฏ $7.2468
๐ Bearish Scenario
If sellers force a breakdown below the range floor, downside momentum could accelerate toward lower support levels.
Bearish Targets
๐ฏ $6.1210
๐ฏ $5.9664
๐ Key Levels
Resistance
$6.7741 (Range High)
$7.0032
$7.2468
Support
$6.3732 (Range Low)
$6.1210
$5.9664
๐ก Trading Insight
AVAX is currently in a compression phase where volatility is decreasing. These conditions often lead to explosive moves once the range is broken.
Bullish Confirmation: 4H candle closes above $6.7741 with rising volume.
Bearish Confirmation: 4H candle closes below $6.3732, exposing deeper support levels.
Patience remains the best strategy until the market chooses a direction.
Disclaimer: This analysis is for educational purposes only and is not financial advice.
AVAX Analysis... Early signs to watch for. Avalanche is trying to build a base after the sharp selloff, but the market structure has not fully turned bullish yet.
The first potential CHOCH came from the strong reaction off the lows and the recovery back above local support. However, AVAX still needs to break and hold above the recent swing highs near the lower edge of the overhead supply zone before that structural shift is confirmed.
Price is currently consolidating around a major volume area, showing that buyers and sellers are still fighting for control. Holding the current range and forming another higher low would strengthen the bullish case. A confirmed breakout could open the door for price to move deeper into the large imbalance and supply zone above.
The Synergy Signal oscillator is forming rising lows, showing improving underlying momentum. However, some shorter-term readings are becoming extended, so a pullback or liquidity sweep could happen before another push higher.
Bullish confirmation comes from reclaiming the recent range highs with volume. Losing the current support structure would weaken the recovery and place the major lower support zone back in focus.
For now, AVAX looks like an early recovery setup, but confirmation is still needed before calling it a complete trend reversal.
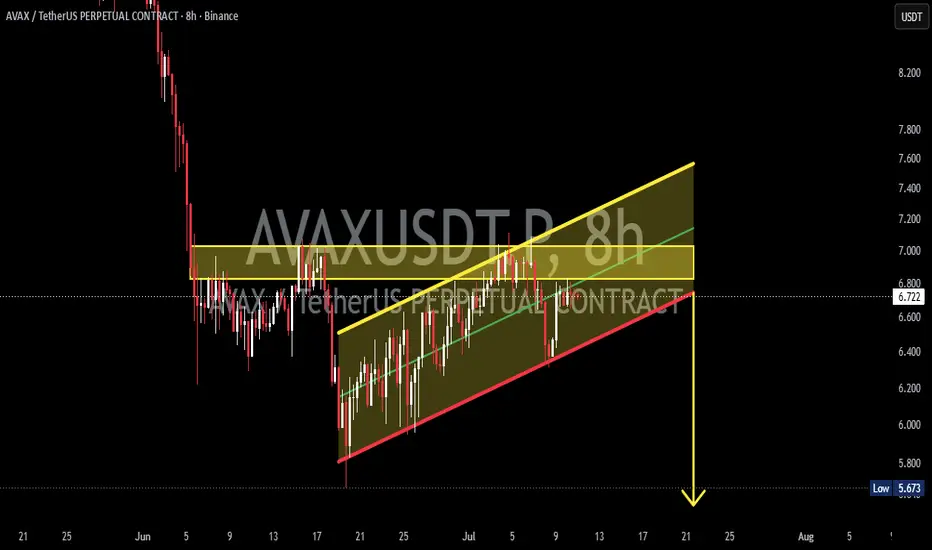
AVAXUSDT - Breakdown or Breakout?Based on the chart, AVAXUSDT is still trading inside a ๐ Rising Channel (Ascending Channel) after experiencing a sharp decline. The price is currently sitting at a crucial area, right around the ๐ฅ lower trendline support of the channel while remaining below the ๐จ horizontal resistance zone highlighted by the yellow box.
โ ๏ธ From a technical perspective, this is a critical decision point that could determine the next major move. Traders should closely monitor the price reaction around both support and resistance levels.
---
๐ก๐ Pattern Identified: Rising Channel
A ๐ Rising Channel is a chart pattern formed by two parallel upward-sloping trendlines.
โจ Key Characteristics:
โ
Indicates a gradual upward trend.
โ ๏ธ However, when it forms after a previous downtrend, a Rising Channel often acts as a Bearish Continuation Pattern, suggesting that the broader downtrend may eventually resume.
๐ Buyers are still attempting to maintain the upward momentum, but sellers continue to apply pressure whenever the price approaches the upper resistance of the channel.
๐ On this chart, the price has failed multiple times to break above the 6.9โ7.0 USDT resistance area, making it a strong Supply Zone.
---
๐ข๐ Bullish Scenario
A bullish confirmation would occur if:
โ
Price successfully holds above the Rising Channel support.
โ
Buyers manage to break above the horizontal resistance zone (yellow box).
โ
An 8H candle closes above resistance with increasing trading volume.
๐ฏ If a valid breakout occurs, the next upside targets could be:
๐ The upper boundary of the Rising Channel
๐ฏ 7.4โ7.6 USDT
๐ช As long as the channel support remains intact, the bullish structure remains valid.
---
๐ด๐ Bearish Scenario
The bearish scenario becomes the primary outlook if:
โ Price breaks below the Rising Channel support.
โ An 8H candle closes below the support trendline accompanied by increasing selling volume.
โ ๏ธ If this breakdown is confirmed, the Rising Channel would fail and likely act as a Bearish Continuation Pattern, signaling a continuation of the previous downtrend.
๐ฏ The first downside target is around:
๐ป 5.67 USDT (as indicated on the chart)
๐ป If selling pressure intensifies, the price could continue toward lower support levels.
๐ The stronger the selling volume during the breakdown, the higher the probability of reaching the bearish target.
---
๐๐ฏ Key Levels to Watch
๐จ Major Resistance
๐ 6.9โ7.0 USDT
๐ Upper Rising Channel
๐ฅ Major Support
๐ Lower Rising Channel
๐ฏ Bearish Target
๐ป Around 5.67 USDT
---
๐๐ Conclusion
AVAXUSDT is currently at a critical decision point, with the Rising Channel support serving as the key level to watch.
๐ If the price successfully breaks above resistance, it could open the door for a move toward the 7.4โ7.6 USDT area.
๐ On the other hand, if the price breaks below the channel support, it would confirm a bearish signal and increase the probability of a decline toward 5.67 USDT, or even lower if selling pressure continues to strengthen.
โณ Traders are advised to wait for an 8H candle confirmation before making any trading decisions, as the current price action around support and resistance is likely to determine the next major trend.
---
> โ ๏ธ Disclaimer: This analysis is based solely on Price Action and the technical chart pattern shown above. It is not financial advice or a recommendation to buy or sell any asset. Always Do Your Own Research (DYOR) and practice proper Risk Management before making any trading decisions.
#AVAX #AVAXUSDT #Avalanche #Crypto #Cryptocurrency #Trading #TradingView #TechnicalAnalysis #PriceAction #ChartAnalysis #Altcoins #Binance #Bullish #Bearish #RisingChannel #Support #Resistance #Breakout #Breakdown #RiskManagement #DYOR
AVAX: recovery dip into the $6 accumulation zoneThe Macro Picture ๐บ๏ธ
AVAX broke down hard in June, collapsing from its $9 range floor into a $5.7 liquidity sweep that dragged RSI into deep oversold and flushed the over-leveraged longs. Buyers stepped in aggressively at the lows and drove a recovery back to $7, but that first push has now cooled into a pullback toward the $6.4 equilibrium. This is the healthy backfill after a capitulation bounce โ price is retracing into support rather than making new lows, and the $6 zone is exactly where the structure gets its next test. The macro trend is still repairing, but the sweep-and-reclaim sequence favors buyers over another leg down.
The Setup โ๏ธ
The Reaction: The $5.7 macro support (solid green) absorbed the June capitulation and launched the recovery. It stacks under the $6 local low to form a high-confluence demand shelf โ the line that must hold to keep the reversal intact.
The Accumulation Zone: The $6โ$6.4 band is a textbook pocket for staggered, averaging-based entries โ price is pulling back into it after the bounce, letting buyers build into the recovery instead of chasing the initial reclaim.
The Ceiling: The $7 local decision (red dashed) capped the first push. A decisive daily close above it reopens the path toward the $9 macro supply band.
The Roadmap: Primary target sits at $7 โ the green roadmap points toward a retest of the decision level as buyers defend the accumulation zone. Invalidation: a sustained 1D close below $5.7 would void the recovery and reopen the downtrend to fresh lows.
More setups in profile.
AVAX USDT SHORT SIGNAL#30. AVAX/USDT โ Trade Setup (SHORT)
๐ Position Type: SHORT
๐ Timeframe: 1 H
๐ Market: Futures
๐ฐ Entry Zone:
6.382
๐ Stop-Loss:
6.583
๐ฏ Take-Profit Targets:
โข TP1:ย 6.225
โข TP2:ย 6.055
โข TP3:ย 5.885
โข TP4:ย 5.757
TP5:ย
TP6:ย
โ๏ธ Leverage:
5- 10
โ ๏ธ After reaching TP1, move Stop-Loss to Entry Price.
๐ Risk Management:
Risk only 1โ2% of your capital per trade.
Always confirm the setup on your chart before entry
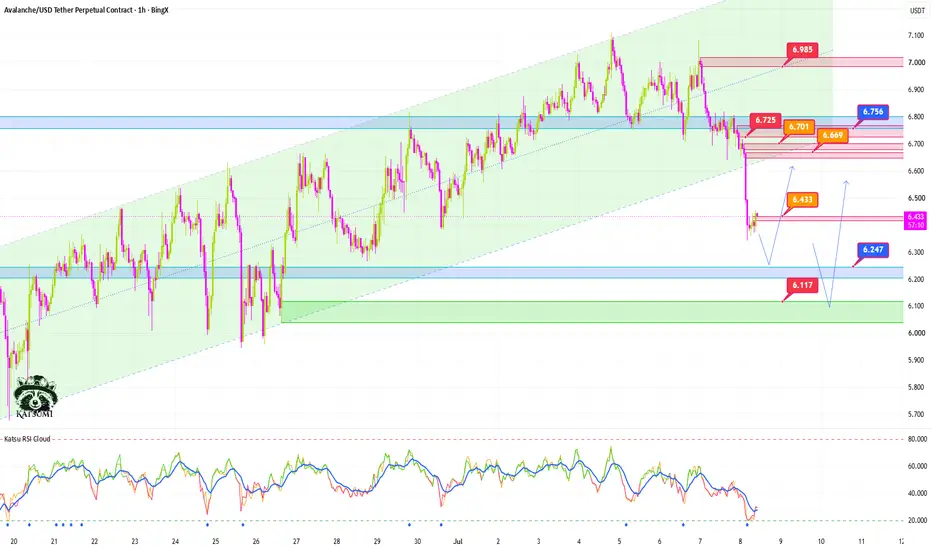
Technical Update: Liquidity Cascade, Key OBs, and FVG TargetsThe price had been moving nicely inside an ascending channel until yesterday, when it broke down from the structure.
The current drop was caught by an older Order Block, but it is clearly visible that the large bearish candle was not random. As price moved lower, long positions were likely stopped out one after another, adding extra sell pressure to the move.
I marked a support zone in blue, which could hold the price if the decline continues. If that level fails, I marked a stronger Order Block in green, where price could potentially react and turn back to the upside.
It is also worth noting that the move left behind an FVG. If price bounces, this imbalance could later be revisited, which may offer a clean trading opportunity.
I also marked the bearish Order Blocks above. The orange zones represent smaller, weaker OBs, while the red zones are stronger resistance areas.
Whenever price reaches these zones, something usually happens: price may reject, consolidate, or break through and accelerate. That is why I marked them. These areas can be traded well if we combine them with additional confirmation, such as candlestick patterns, volume, lower-timeframe RSI, or other signals.
The RSI still looks acceptable, and there is no clear divergence. On the 1H timeframe, RSI is currently in oversold territory, so a short-term bounce or sideways movement would not be surprising before the market cools down and potentially attempts another move lower.
I marked the path I am currently watching on the chart. My main scenario is that price may move slightly lower first, then potentially start turning back to the upside from one of the marked demand zones.
Supports: 6.247 / 6.117
Minor resistances: 6.433 / 6.669 / 6.701
Major resistances: 6.725 / 6.756 / 6.985
Please treat these levels as zones, not exact prices. That is why I draw areas instead of single lines.
Avax longSong of Solomon 7:12 โ "Let us get up early to the vineyards; let us see if the vine flourish, whether the tender grape appear, and the pomegranates bud forth: there will I give thee my loves."
The vineyard of AVAX awaiteth between 6.9 and 7.1.
Enter in that narrow gate. Linger not outside it.
For what bloometh in that valley shall flourish greatly.
#AVAXUSDT#AVAX
The price is moving within a descending channel on the 1-hour timeframe and has reached the lower boundary. It is now poised for a bounce and is expected to retest this boundary.
The Relative Strength Index (RSI) indicates a downward trend, which is likely to continue given the overbought conditions.
There is a key support zone (in green) at 6.33, and the price has bounced off this zone several times, making it a strong support level.
The price is trending towards the 100-period moving average, which we are approaching. This trend supports an upward move.
Entry Price: 6.75
Target 1: 6.86
Target 2: 6.98
Target 3: 7.15
Stop Loss: At the resistance zone (in green)
Remember this simple rule: Money Management.
Any questions? Please leave a comment.
Thank you.
$AVAX *Quick trick*So far this has worked for me in the past 3 weeks. I back tested this trick and I wish I would have known this October of 2025. if you know you know. ๐ซ .
On the 1hour and 4hour time from, if you use the Fibonnacci retracement, if the candle after the first high bounces off of the 38.20% and does not go past the 50%, then you can bet your trade will bounce off that 38.20% to 300% to 360% everytime.
In my current chart, its a good chance Avalanche will climb from $6.90 to $7.50 based on my theory.
If you dont understand this I hope my chart explains it better. Take care and have fun.
$AVAX - Sell Area - $7.50The last 30 days have been extremely choppy. Even though we are still trending up in a parallel channel, you should be careful to set a STOP loss each trade. I too am afraid of Liquidity Sweeps.
On the 4- hour you can see a Gap around $7.50.
Be careful of Long plays up to $7.50 because the liquidity sweep could be a possibility soon. I personally will be Selling @ that GAP of $7.50 until $4.15 moving my stop loss down every 20 to 30 pips.
Good Luck Beautiful People.