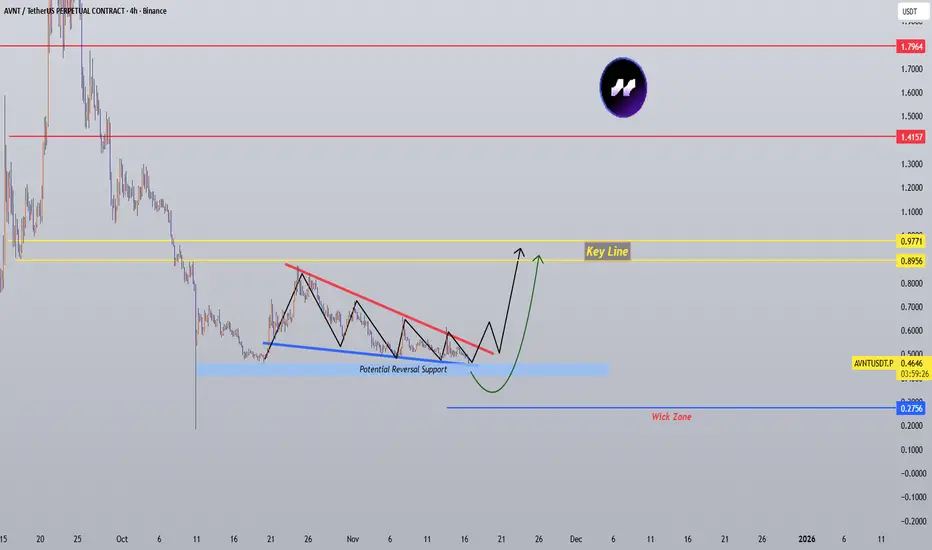
AVNT Avantis Technical AnalysisAVNT is showing a strong recovery after building a clear base near support. Price has reclaimed short-term momentum and is now pushing into a key resistance zone.
The main area to watch is the current supply zone. This is where sellers may react, so a small pullback or retest would be healthy as long as AVNT holds the breakout area.
Key support sits near the recent reclaim zone. If price holds above it, the structure remains bullish and continuation toward the upper resistance zone becomes possible.
Volume is improving and momentum is leaning bullish, but confirmation is still needed. A clean break and hold above resistance would strengthen the setup. Rejection could lead to another reset before the next attempt higher.
Bullish case: Hold support and break the upper range.
Bearish case: Lose the reclaim zone and return to consolidation.
AVNT is improving, but confirmation is key.
In-depth trading ideas
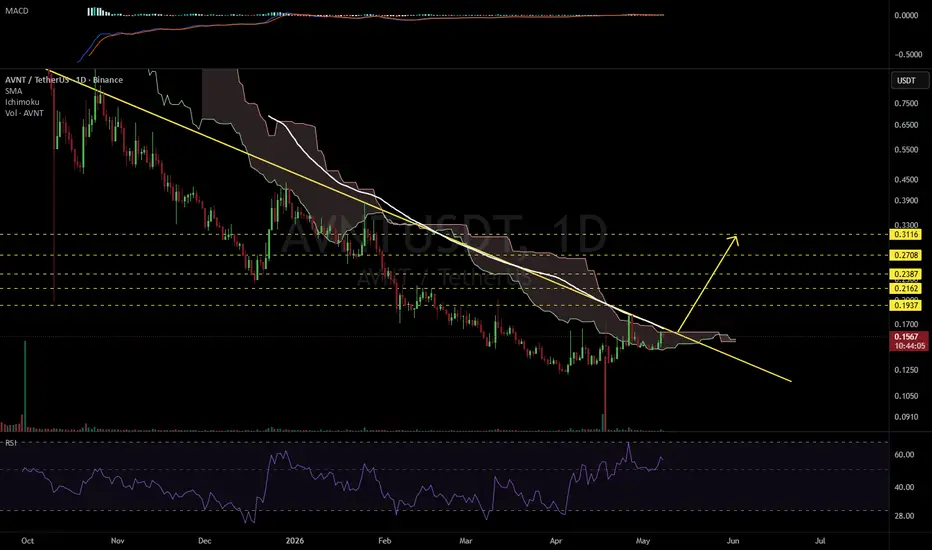
AVNTUSDT 1DKeep an eye on #AVNT daily chart. Consider entering this coin after a solid breakout above the resistance cluster, which includes the Ichimoku cloud, the descending resistance, and the daily SMA100. If that happens, the potential upside targets are:
🎯 $0.1937
🎯 $0.2162
🎯 $0.2387
🎯 $0.2708
🎯 $0.3116
⚠️ Always remember to use a tight stop-loss and maintain proper risk management.
AVNTUSDT - Preparing for a Major Breakout?AVNTUSDT on the 1D timeframe is still moving within a medium-term downtrend structure, but the chart is beginning to show early signs of recovery after successfully holding the strong support area around 0.12–0.13 USDT. 🛡️
The main focus on this chart is the Descending TrendLine, which has acted as a major dynamic resistance since November and continuously pushed the price downward. Currently, price action is approaching a crucial breakout area that could determine the next major market direction. 👀⚡
📉 Pattern Formation — Descending TrendLine
The chart structure shows a consistent lower high pattern, forming a descending resistance line that continues to suppress price movement.
✨ Pattern characteristics:
🔸 Price repeatedly fails to create higher highs
🔸 Sellers have remained dominant for several months
🔸 The bottom area is starting to form a base accumulation zone
🔸 Volatility is decreasing as price approaches breakout territory
If the trendline is broken with strong volume confirmation, the bearish structure could potentially shift into a reversal phase or at least a significant relief rally. 🚀📊
━━━━━━━━━━━━━━━
🟢 Bullish Scenario
Bullish confirmation will occur if AVNT successfully breaks out and closes strongly above the descending trendline. ✅📈
🎯 Important resistance levels:
🔹 0.18 USDT
🔹 0.21 USDT
🔹 0.23 USDT as the main target
If the breakout succeeds:
🚀 The lower high structure could become invalid
🚀 Buyer momentum may increase significantly
🚀 Potential short squeeze & FOMO could appear
🚀 The chance of forming a new higher high becomes stronger
As long as price holds above the trendline after breakout, the opportunity for continuation toward the 0.21–0.23 area remains wide open. 🔥
━━━━━━━━━━━━━━━
🔴 Bearish Scenario
The bearish scenario remains valid if price fails once again to break above the descending trendline and experiences a strong rejection. ⚠️📉
📌 Important things to watch:
🔸 The trendline still acts as the market’s main resistance
🔸 Weak breakout volume could trigger a fake breakout
🔸 If price falls back below 0.145–0.14, selling pressure may increase rapidly
🛑 Important support levels:
🔻 0.145 USDT
🔻 0.13 USDT
🔻 0.12 USDT as the major support zone
If the 0.12 support breaks down, the downtrend could continue and potentially create new lows. 🩸
━━━━━━━━━━━━━━━
📊 Conclusion
AVNTUSDT is currently sitting at a critical area after spending months trading below the descending trendline. The current structure shows early recovery attempts, but the main confirmation still depends on a valid breakout above the trendline resistance. 🔑
💡 A successful breakout could open the path for a reversal toward 0.21–0.23 USDT, while another rejection would maintain bearish market dominance.
⚡ The current zone is highly interesting to watch because it may become the starting point of the next major trend reversal.
━━━━━━━━━━━━━━━
#AVNT #AVNTUSDT #Crypto #TradingView #TechnicalAnalysis #Breakout #DescendingTrendline #Bullish #Bearish #Altcoin #CryptoTrading #Binance #SupportResistance #Trendline #Trader #ChartAnalysis #CryptoMarket #PriceAction #Altseason #ReversalSetup
$AVNT – Base Built, Breakout Next?After weeks of basing and grinding inside this range, BINANCE:AVNTUSDT is finally trying to reclaim momentum from the lows. we’ve been holding the demand zone pretty well and structure is starting to look a lot healthier here.
The main level to watch is still 0.15–0.145. If it holds 0.15–0.145, could still go higher into .18–.20s (vwap)
First hurdle sits around .165, where supply starts getting heavier. Reclaiming this level would open the path for a move into the higher range targets.
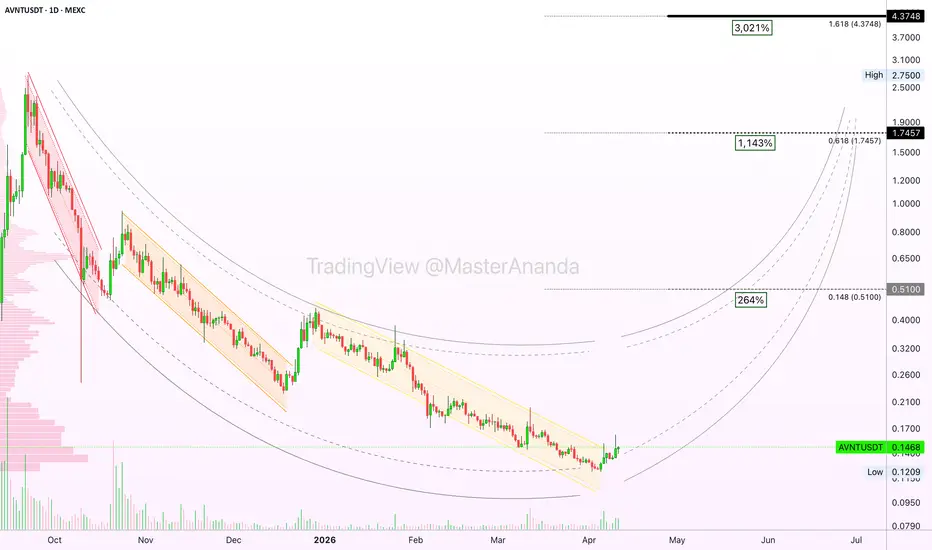
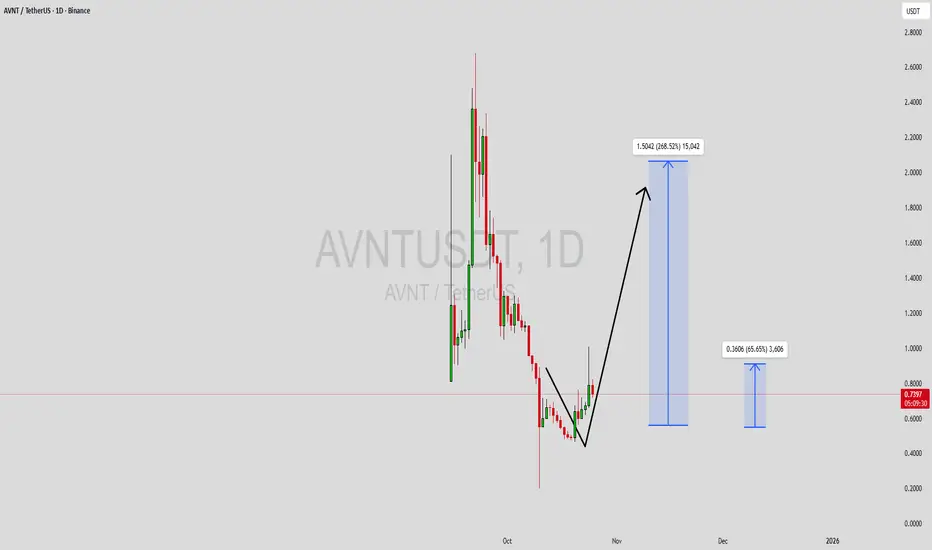
Avantis · High potential ·1100% mid-term or 3000% long-termLet's go with the chart structure. The left side shows red, orange and yellow. This is the drop and is composed of low frequency colors. Notice the curve.
Then we will have blue, green and purple. This is the rise and is composed of higher frequency colors. Notice the curve. And the project is Avantis—AVNTUSDT.
Huge potential for growth here in the coming months. The easy target at $0.51 opens up 264% profits potential. Short-term in this type of trading equals one month, within 30 days. Mid-term within three months, 90 days. And long-term within 3-6 months. Then we have long long-term and so on.
All the targets can be hit within 3-6 months. With a strong cycle, the second one at $1.74 becomes high probability, and this is huge. 1,143% total profits potential, more than 12X.
The all-time low happened only days ago, 2-April and volume goes up. We are looking at true bottom prices and this is the best possible. If you are reading this now, you are either smart, lucky or blessed, or all three combined and then some. It is hard to find the market when it looks like this. It is even harder to take action.
I've been in situations when I am in the market for months at the bottom and just ignore it as if something is off. When the action starts, then I am rushing to buy—late. When everything is up I wonder, "why didn't I buy when prices were low?"
And this happens but only on our first cycle. On the second one we have experience but we tend to buy before the bottom is in, another mistake. On the third one we are more than ready but growth happens sooner than expected. The fourth one we are experts we get the bottom and enjoy the maximum profits possible.
What I am trying to say with this story is that it takes time. Incredible profits are possible but it takes years of practice, of being around, reading, and eventually we get the right timing, the right projects and success. It is all about experience, it is all about being in the market, it is all about buy-hold... You have to trust. Trust the Master, you will do great.
Namaste.
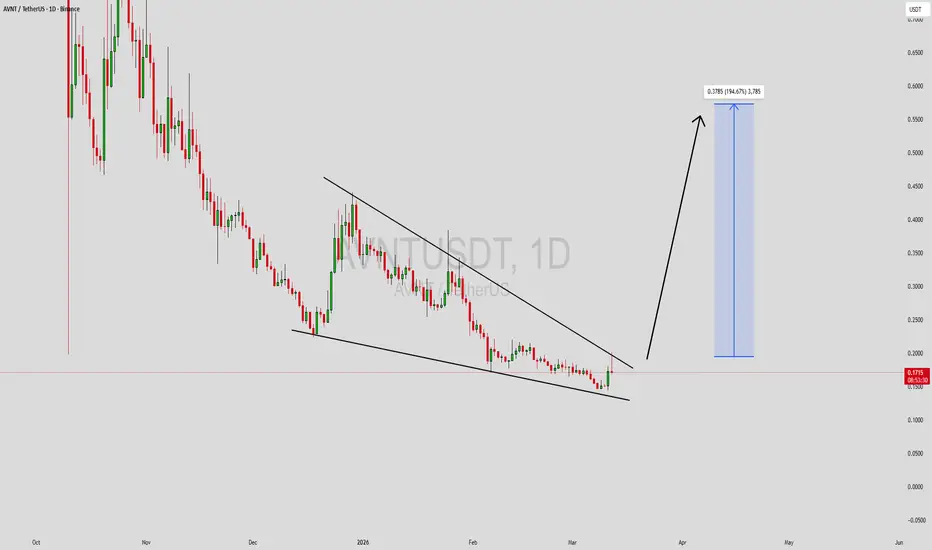
AVNTUSDT Forming Falling WedgeAVNTUSDT is forming a clear falling wedge pattern, a classic bullish reversal signal that often indicates an upcoming breakout. The price has been consolidating within a narrowing range, suggesting that selling pressure is weakening while buyers are beginning to regain control. With consistent volume confirming accumulation at lower levels, the setup hints at a potential bullish breakout soon. The projected move could lead to an impressive gain of around 140% to 150% once the price breaks above the wedge resistance.
This falling wedge pattern is typically seen at the end of downtrends or corrective phases, and it represents a potential shift in market sentiment from bearish to bullish. Traders closely watching AVNTUSDT are noting the strengthening momentum as it nears a breakout zone. The good trading volume adds confidence to this pattern, showing that market participants are positioning early in anticipation of a reversal.
✅ Show your support by hitting the like button and
✅ Leaving a comment below! (What is your opinion about this Coin)
Your feedback and engagement keep me inspired to share more insightful market analysis with you!
Spring in play?The crypto market just went through another heavy liquidation event, with BTC flushing down to 59k. As expected, altcoins took the brunt of the move with many breaking structural lows and sentiment capitulating.
Even so, a number of alts are now showing tradeable relief‑rally structures. These aren’t guarantees nothing ever is, but the setups are technically clean, with clear invalidation levels and logical upside targets if the market stabilises.
The key thing to keep in mind:
If BTC continues lower (which is still very possible), many of these setups will likely get invalidated and push into their yearly S2 pivots or deeper support zones. Until then, the structure on several alts supports the idea of short‑term relief before the next major decision point.
I’ll be using this same template across multiple charts so the logic stays consistent.
Price swept the October 10th lows and printed a low‑volume spring relative to the selling climax. It has since closed back inside the range and is currently holding above the new yearly S1 support (at least for now).
Targets & Management
TPs
- First target sits just below the yearly pivot
- If price reaches that level, trail the stop toward the range EQ
Depending on BTC’s strength, the stop can continue to trail, but one step at a time
Risk
As always, risk management is everything. These setups are valid only while structure holds, and BTC remains the dominant variable.
AVNTUSDT Forming Descending ChannelAVNTUSDT is currently showing bearish pressure on the 4H timeframe, with price breaking and retesting the key support zone around 0.280–0.265.
The chart shows a clear breakdown from the descending channel / larger falling structure, followed by a failed attempt to reclaim the broken level. Price is now trading below that zone and printing lower lows + lower highs, with the momentum candles staying predominantly red and volume not showing meaningful buying interest on the bounces yet.
Current price action (~0.2426) is sitting right at/near the lower dotted support line (~0.240–0.235 area). A clean break below this level with volume would open the door for a deeper move toward 0.200–0.180 region (next major liquidity pocket and psychological level).
Short-term structure remains bearish until we see:
- a strong bullish reversal candle with high volume closing back above 0.265–0.270
- or a clear higher low + higher high formation that invalidates the current downtrend.
What is your current bias on AVNT — still waiting for a bounce or already positioned short? Drop your thoughts below!
✅ Smash the like button if this breakdown analysis helped
✅ Comment your take on AVNT right now — bullish trap or more downside coming?
Your feedback keeps these updates coming — let's stay sharp together!
AVNT TECHNICALS LOOKING BULLISH🔥 Fortune AI Radar — NYSE:AVNT
Fresh activity detected on NYSE:AVNT today.
Data suggests increasing market interest & buyers stepping in.
Technicals currently lean bullish, with momentum trending upward.
Whales showing hints of accumulation and hype rising among trader
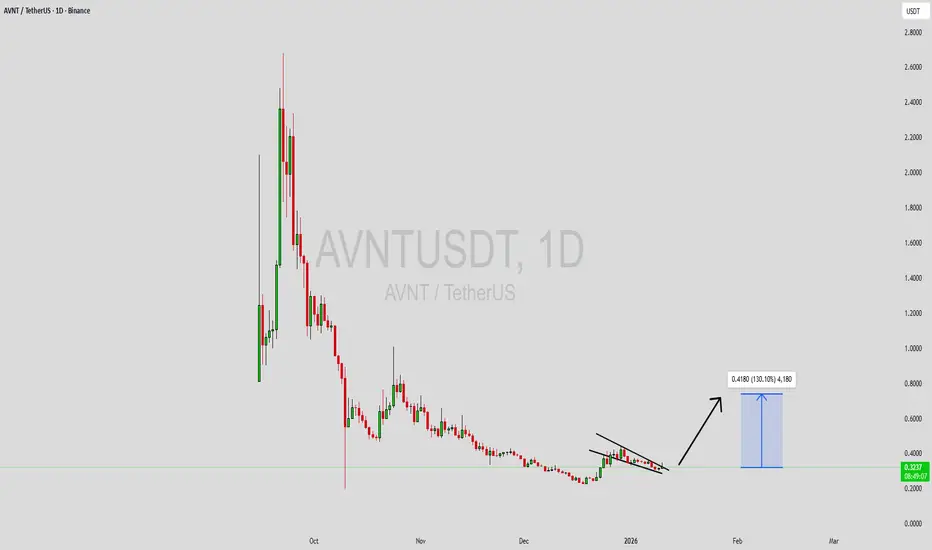
AVNTUSDT Forming Falling WedgeAVNTUSDT is forming a clear falling wedge pattern, a classic bullish reversal signal that often indicates an upcoming breakout. The price has been consolidating within a narrowing range, suggesting that selling pressure is weakening while buyers are beginning to regain control. With consistent volume confirming accumulation at lower levels, the setup hints at a potential bullish breakout soon. The projected move could lead to an impressive gain of around 90% to 100% once the price breaks above the wedge resistance.
This falling wedge pattern is typically seen at the end of downtrends or corrective phases, and it represents a potential shift in market sentiment from bearish to bullish. Traders closely watching AVNTUSDT are noting the strengthening momentum as it nears a breakout zone. The good trading volume adds confidence to this pattern, showing that market participants are positioning early in anticipation of a reversal.
Investors’ growing interest in AVNTUSDT reflects rising confidence in the project’s long-term fundamentals and current technical strength. If the breakout confirms with sustained volume, this could mark the start of a fresh bullish leg. Traders might find this a valuable setup for medium-term gains, especially as the wedge pattern completes and buying momentum accelerates.
✅ Show your support by hitting the like button and
✅ Leaving a comment below! (What is your opinion about this Coin?)
Your feedback and engagement keep me inspired to share more insightful market analysis with you!
$AVNT Breakout AttemptAvantis is trying to break out of its descending wedge and just made a strong push higher, tagging around $0.41.
On the daily chart, this marks the second test of the channel. Price has been grinding higher with clear higher lows, and if volume continues to hold up, there’s room for a squeeze toward the $0.50–0.60 area.
That said, any strong rejection around $0.50 could set up a decent short, with the downside opening back up toward the $0.20 area as an initial target.
AVNTUSDT UPDATEAVNT
UPDATE
AVNT Technical Setup
Pattern: Falling Wedge Pattern
Current Price: 0.3514 USDT
Target Price: 0.7814 USDT
Target % Gain: 285.80%
Technical Analysis: AVNT is breaking out of a falling wedge pattern on the 1D chart, indicating bullish potential. The price has recently pushed above the descending resistance trendline after a prolonged downtrend, supported by expanding price action. This breakout structure validates a potential upside move toward the 0.7814 USDT resistance zone.
Time Frame: 1D
Risk Management Tip: Always use proper risk management.
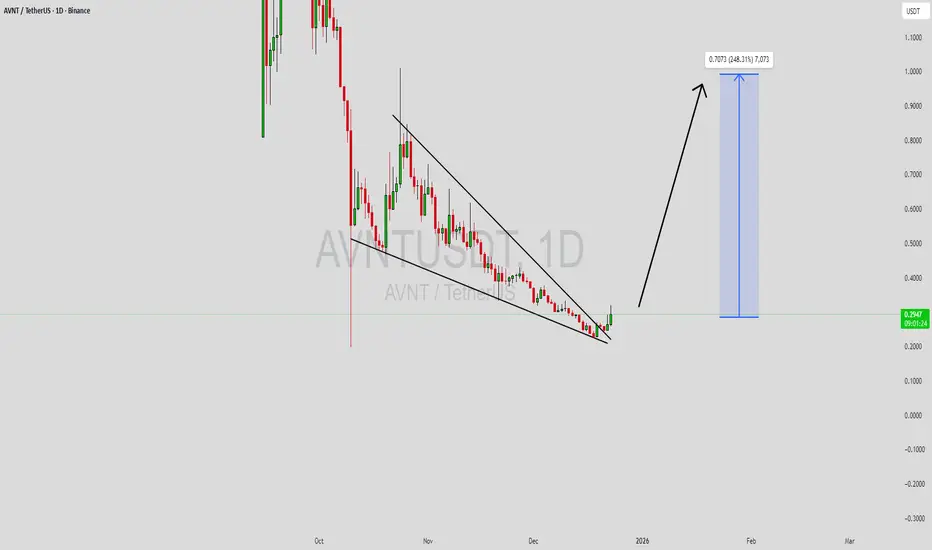
AVNTUSDT Forming Falling WedgeAVNTUSDT is forming a clear falling wedge pattern, a classic bullish reversal signal that often indicates an upcoming breakout. The price has been consolidating within a narrowing range, suggesting that selling pressure is weakening while buyers are beginning to regain control. With consistent volume confirming accumulation at lower levels, the setup hints at a potential bullish breakout soon. The projected move could lead to an impressive gain of around 190% to 200% once the price breaks above the wedge resistance.
This falling wedge pattern is typically seen at the end of downtrends or corrective phases, and it represents a potential shift in market sentiment from bearish to bullish. Traders closely watching AVNTUSDT are noting the strengthening momentum as it nears a breakout zone. The good trading volume adds confidence to this pattern, showing that market participants are positioning early in anticipation of a reversal.
Investors’ growing interest in AVNTUSDT reflects rising confidence in the project’s long-term fundamentals and current technical strength. If the breakout confirms with sustained volume, this could mark the start of a fresh bullish leg. Traders might find this a valuable setup for medium-term gains, especially as the wedge pattern completes and buying momentum accelerates.
✅ Show your support by hitting the like button and
✅ Leaving a comment below! (What is your opinion about this Coin?)
Your feedback and engagement keep me inspired to share more insightful market analysis with you!
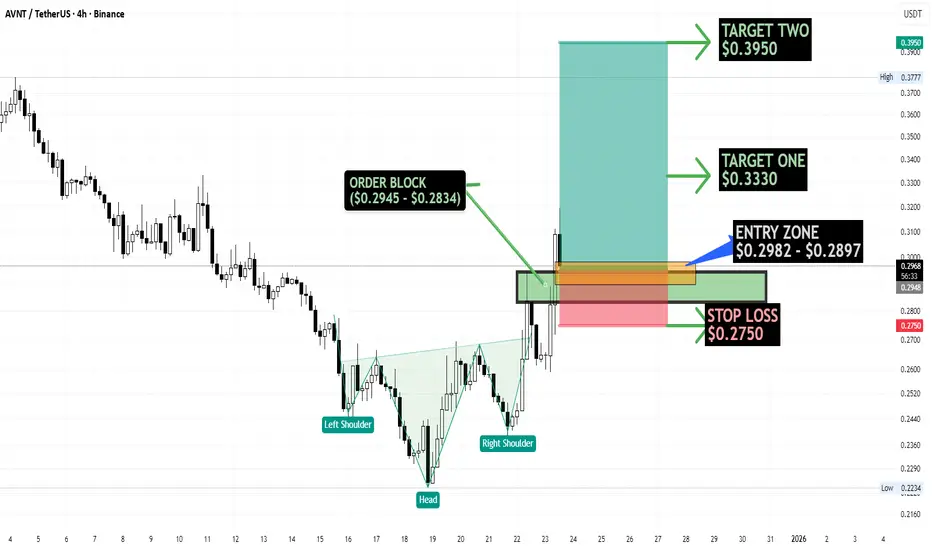
$AVNTUSDT Breaks Structure — Bulls Regain ControlBINANCE:AVNTUSDT (4H) has confirmed a bullish reversal after completing a Head & Shoulders pattern and breaking structure to the upside, signaling a clear shift in market control toward buyers.
Price has retraced into the key bullish order block and demand zone at $0.2945 – $0.2834. As long as this zone holds, bullish continuation remains favored, with upside targets at $0.3330 and $0.3950.
A sustained break below $0.2750 would invalidate the setup.
Risk management is essential.
AVNT Testing Key Resistance After Trendline BreakNYSE:AVNT is testing a key resistance zone after breaking above the descending trendline. While this bounce looks promising, price needs to hold above this level for any sustained upside.
A rejection here could lead to another pullback, so confirmation is key.
DYOR, NFA
AVNTUSDT Forming Falling WedgeAVNTUSDT is forming a clear falling wedge pattern, a classic bullish reversal signal that often indicates an upcoming breakout. The price has been consolidating within a narrowing range, suggesting that selling pressure is weakening while buyers are beginning to regain control. With consistent volume confirming accumulation at lower levels, the setup hints at a potential bullish breakout soon. The projected move could lead to an impressive gain of around 190% to 200% once the price breaks above the wedge resistance.
This falling wedge pattern is typically seen at the end of downtrends or corrective phases, and it represents a potential shift in market sentiment from bearish to bullish. Traders closely watching AVNTUSDT are noting the strengthening momentum as it nears a breakout zone. The good trading volume adds confidence to this pattern, showing that market participants are positioning early in anticipation of a reversal.
Investors’ growing interest in AVNTUSDT reflects rising confidence in the project’s long-term fundamentals and current technical strength. If the breakout confirms with sustained volume, this could mark the start of a fresh bullish leg. Traders might find this a valuable setup for medium-term gains, especially as the wedge pattern completes and buying momentum accelerates.
✅ Show your support by hitting the like button and
✅ Leaving a comment below! (What is your opinion about this Coin?)
Your feedback and engagement keep me inspired to share more insightful market analysis with you!
Avantis middle term targets! AVNT after listing perform pretty good! But its not a mistake always after 100% withdraw initial deposit! I dont't know why and how people buying this type of tokens after crazy uptrend! Maybe they are greedy and 2 dollar is not enough! zones of interest based on IAP model shared before! BITGET:AVNTUSDT
Here is a current levels what i would like to see! Test of marked levels where we will almost close wick after 10 october! And than we will see bounce back to October open and Equilibrium of downtrend since end of september! After we will come back to this idea again!
Lowes point for correction marked with rectangle under key levels! If price will go lower than its will be invalidation and price discovery mode
Thanks for support
#AVNT Update — RWA Sector Watch Chart shows
Nice falling wedge forming here.
AVNT is sitting between two options:
hold the current range and attempt a breakout following Aster’s movement,
or make a short-term breakdown with a wick toward 0.32 – 0.27.
Both zones are solid buy regions in my view.
🔑 Key Levels
Support zone: 0.32 – 0.27
Recovery line: 0.90 – 1.20
Breakout path: 2.20 – 3.50 (ATH recovery range)
Max investment on AVNT → 3 % of portfolio.
Trade it as a rotation play with clear stops and staged exits.
🧾 About Avantis
Avantis is the largest RWA perpetuals DEX in DeFi, built and backed on Base.
It allows trading of crypto and real-world assets (FX, commodities, indices, equities).
Supported by Pantera and Coinbase, it’s currently the top DEX on Base by volume,
offering institutional-grade products and up to 500× leverage in a transparent, permissionless way.
Avantis introduced Zero-Fee Perpetuals (ZFP) — traders pay fees only when they profit.
It also brought leveraged RWAs on-chain, driving rapid growth:
over 20 billion USD in cumulative volume and 15 million run-rate revenues since February 2024.
(See CMC for more background.)
✅ Quick Recap
Pattern: Falling wedge
Buy zones: 0.32 – 0.27
Recovery line: 0.90 – 1.20
Breakout targets: 2.20 – 3.50
Allocation: 3 % max
Trend bias: Bullish recovery if wedge holds
⚓ Renzo Tip
“When a wedge tightens, patience becomes your best entry signal; force it, and you miss the release.”
🤲 Prayer
May Allah bless us with calm decisions, protect our trades from haste,
and grant us the clarity to wait for confirmation before every move.
I’ve traded this coin from the early base around 0.30 → 1.80,
so returning to these levels offers a strong risk-to-reward window.
📈
$AVNT – Testing the demand zone againAfter a prolonged correction from the $1.5 resistance zone, NYSE:AVNT has once again found support at the same demand zone that previously triggered strong reversals.
Price is respecting the green support area around 0.45–0.50
The descending trendline has been tested multiple times, showing weakening bearish pressure
Each time price entered this zone, buyers stepped in with momentum
If NYSE:AVNT manages to hold this area, a potential bounce or short-term recovery could follow.
However, a clean breakdown below 0.45 would invalidate the setup and open the door for deeper downside.
Key levels:
🟢 Support: 0.45–0.50
🔴 Resistance: 1.20–1.50
Watching closely for confirmation of a reversal.
$AVNT (6-HOUR): SPOT BUY (21 OCT at $0.65) - UPDATENYSE:AVNT SPOT BUY made 10 days ago at 65C... It did very well at the beginning, hit my first TP at $1.01 (50%+ RETURN), and that turned out to be the LOCAL TOP.
Below my ENTRY, at 58 CENTS now, and below the 50 MA, sadly, so short-term not looking good.
Some positives though — RSI has become super OVERSOLD at 18, and what I like the most about this #AVNT coin: no DISTRIBUTION at all that’s visible in OBV. Quite the opposite — more signs of ACCUMULATION lately, a BULLISH OBV DIVERGENCE, etc.
VOLUMES extremely low, no SELLERS. The only thing that worries me is the ON-CHAIN DATA of their PERPS — weak volumes and even weaker OPEN INTEREST, which has fallen from $61 M to $32 M just this week. Not sure what the issue is with this #DEX as I have never used it.
The data does worry, though.
My STOP LOSS was set at 53.5 C for the remaining part of the position (two-thirds). There should be a BOUNCE soon, and I will have to see if the 50 MA (65.8 C) rejects it or not. Possible manual EXIT on rejection.
👽💙
AVNTUSDT: trend in 30-Min time frames(((((((((This coin is very risky but investing in the specified area is good))))))
The color levels are very accurate levels of support and resistance in different time frames, and we have to wait for their reaction in these areas.
So, Please pay special attention to the very accurate trend, colored levels, and you must know that SETUP is very sensitive.
Be careful
BEST
MT
AVNTUSDT Forming Bullish WaveAVNTUSDT is showing a promising bullish wave pattern, indicating a potential continuation of upward momentum after a healthy consolidation phase. This technical setup often highlights renewed buyer strength and signals that the asset could be preparing for its next leg higher. The pattern’s structure suggests that market sentiment is gradually turning optimistic, with buyers stepping in to accumulate at key support levels.
The trading volume remains solid, confirming growing participation and interest from investors who are positioning for potential upside. With an expected gain of 50% to 60%+, AVNTUSDT could soon break through its current resistance zone, triggering a wave of bullish momentum across the chart. Such setups are often followed by short-term rallies driven by technical traders and breakout enthusiasts, making this an attractive pair to watch closely in the coming sessions.
Investor sentiment toward AVNT has been improving as confidence builds around its long-term potential and market cover outlook. The combination of strong fundamentals and a bullish technical structure makes this pair one to monitor for potential gains. If the momentum continues to build, AVNTUSDT could outperform several mid-cap crypto assets in the near term, offering traders a valuable opportunity for strategic entry.
✅ Show your support by hitting the like button and
✅ Leaving a comment below! (What is You opinion about this Coin)
Your feedback and engagement keep me inspired to share more insightful market analysis with you!