AXL — Compression Near HighsAXL is pressing into a key area after a strong move, and now the question is whether this is true acceptance near highs… or the start of distribution before rejection.
This is the kind of spot where I’m less interested in predicting and more interested in watching how participants behave around the
AXLUSDT 1D Chart Analysis 18-Dec-25Stop Loss: 0.0112
Entry Point: 0.0872
Take Profit 1: 0.1618
Take Profit 2: 0.2424
Based on 1D and 4H chart analysis, a clear bullish divergence has formed, indicating a potential trend reversal from bearish to bullish. The suggested entry is around 0.0872, with expectations for the price to move to
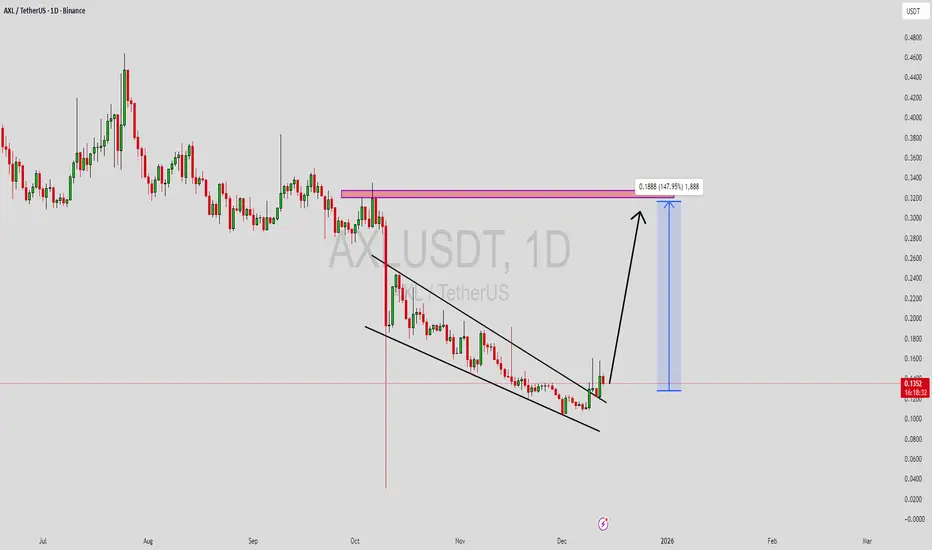
AXLUSDT Forming Falling WedgeAXLUSDT is forming a clear falling wedge pattern, a classic bullish reversal signal that often indicates an upcoming breakout. The price has been consolidating within a narrowing range, suggesting that selling pressure is weakening while buyers are beginning to regain control. With consistent volume
The Big Short AXLUSDT
Market Context
This idea is based on higher timeframe structure and short confluence.
It represents a probability based scenario, not a prediction.
The setup forms near a potential D1 top area.
Strategy
Strategy name: The Big Short
This setup focuses on short signals when multiple conditions a
AXLUSDT Forming falling WedgeAXLUSDT is forming a clear falling wedge pattern, a classic bullish reversal signal that often indicates an upcoming breakout. The price has been consolidating within a narrowing range, suggesting that selling pressure is weakening while buyers are beginning to regain control. With consistent volume
AXLUSDT 1D#AXL is moving inside a falling wedge pattern on the daily chart and has also formed a double bottom pattern.
Short-term targets:
🎯 $0.2317
🎯 $0.2606
In case of a breakout above the wedge resistance, the potential targets are:
🎯 $0.3084
🎯 $0.3470
🎯 $0.3855
🎯 $0.4404
🎯 $0.5104
⚠️ Always remember t
AXLUSDT 1D#AXL is moving within a descending triangle on the daily chart. Recently, it bounced off the support zone and was rejected from the triangle resistance line and the Ichimoku cloud. We believe it will break above the resistance soon. If that happens, the potential targets are:
🎯 $0.4533
🎯 $0.5099
🎯
See all ideas
Summarizing what the indicators are suggesting.
Oscillators
Neutral
SellBuy
Strong sellStrong buy
Strong sellSellNeutralBuyStrong buy
Oscillators
Neutral
SellBuy
Strong sellStrong buy
Strong sellSellNeutralBuyStrong buy
Summary
Neutral
SellBuy
Strong sellStrong buy
Strong sellSellNeutralBuyStrong buy
Summary
Neutral
SellBuy
Strong sellStrong buy
Strong sellSellNeutralBuyStrong buy
Summary
Neutral
SellBuy
Strong sellStrong buy
Strong sellSellNeutralBuyStrong buy
Moving Averages
Neutral
SellBuy
Strong sellStrong buy
Strong sellSellNeutralBuyStrong buy
Moving Averages
Neutral
SellBuy
Strong sellStrong buy
Strong sellSellNeutralBuyStrong buy
Displays a symbol's price movements over previous years to identify recurring trends.