In-depth trading ideas
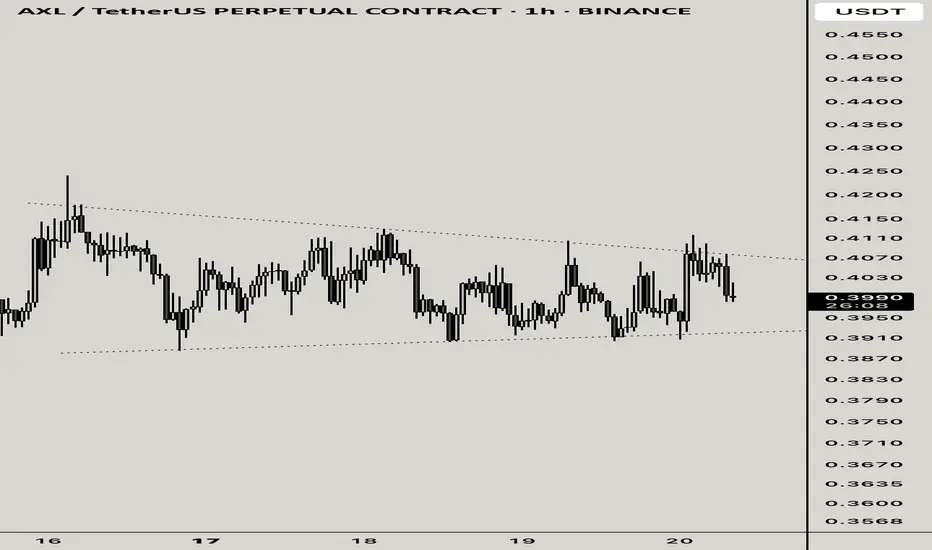
AXL — Compression Near HighsAXL is pressing into a key area after a strong move, and now the question is whether this is true acceptance near highs… or the start of distribution before rejection.
This is the kind of spot where I’m less interested in predicting and more interested in watching how participants behave around the current range.
⚛️ HTF Context:
On the higher timeframe, AXL has already shown a meaningful shift in character. Instead of continuing lower, price has started to stabilize and build structure underneath the highs.
That matters because strong continuation usually comes from compression after expansion, not from chasing extended price after the move is already obvious.
At this stage, the market is trying to show whether higher prices are being accepted or whether this move is running out of participation.
⚛️ LTF Structure:
On the lower timeframe, price is tightening up near the highs rather than impulsively rejecting.
That usually matters.
When price compresses near highs, it often means one of two things:
🟢 participants are accepting higher prices and preparing for another expansion
🔴 or price is stalling, losing participation, and setting up for a failure back into the range
So for me, this is a decision area.
Not a place to force a bias — a place to read behavior.
⚛️ Cycle Position:
This looks like a Base & Break / Continuation-type area if price can maintain acceptance above the recent structure.
If that acceptance fails, then this can quickly shift from continuation behavior into a rejection rotation.
⚛️ Scenarios:
🟢 Continuation:
If AXL continues to hold above the recent base and volume starts to expand, I’d view that as participants accepting higher prices. In that case, the expectation would be continuation out of compression.
🔴 Failure:
If price loses the base, slips back into prior structure, and cannot reclaim, that would suggest the market was not actually accepting higher prices. Then this likely turns into a rejection and rotation setup instead of continuation.
⚛️ Execution Mindset:
I’m not interested in blindly buying because price is near highs.
What I want to see is whether price is actually being accepted here.
If the market holds tight, respects the structure, and participation comes in, that supports continuation.
If it starts slipping back through the base and reclaim attempts fail, that tells me the move may not be ready yet.
⚛️ Closing Line:
The best setups usually don’t come from guessing.
They come from identifying compression, understanding where we are in the cycle, and then letting participation confirm whether expansion is ready.
Not a signal. Just how I’m reading structure and participation.
AXLUSDT 1D Chart Analysis 18-Dec-25Stop Loss: 0.0112
Entry Point: 0.0872
Take Profit 1: 0.1618
Take Profit 2: 0.2424
Based on 1D and 4H chart analysis, a clear bullish divergence has formed, indicating a potential trend reversal from bearish to bullish. The suggested entry is around 0.0872, with expectations for the price to move toward the projected targets at 0.1618 and 0.2424.
⚠️ Always remember to protect your capital with a proper stop-loss and disciplined risk management.
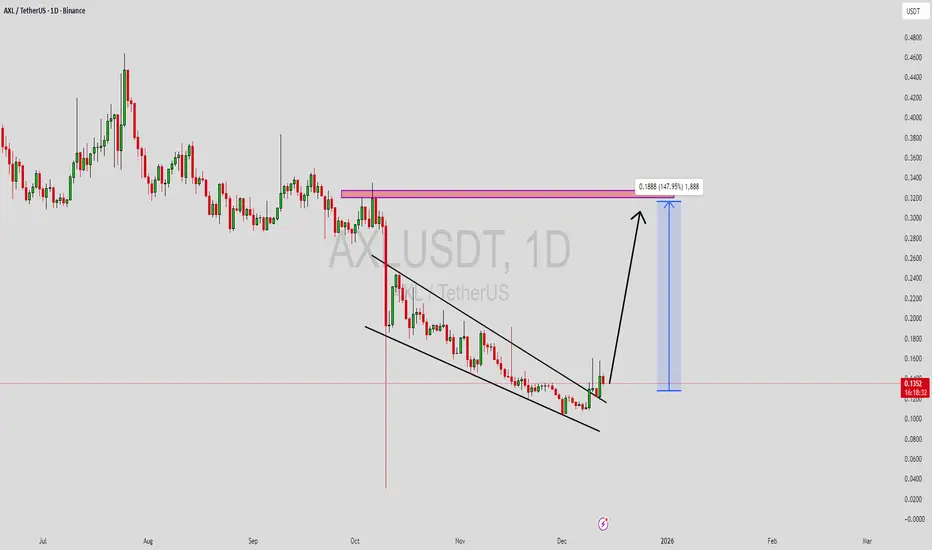
AXLUSDT Forming Falling WedgeAXLUSDT is forming a clear falling wedge pattern, a classic bullish reversal signal that often indicates an upcoming breakout. The price has been consolidating within a narrowing range, suggesting that selling pressure is weakening while buyers are beginning to regain control. With consistent volume confirming accumulation at lower levels, the setup hints at a potential bullish breakout soon. The projected move could lead to an impressive gain of around 90% to 100% once the price breaks above the wedge resistance.
This falling wedge pattern is typically seen at the end of downtrends or corrective phases, and it represents a potential shift in market sentiment from bearish to bullish. Traders closely watching AXLUSDT are noting the strengthening momentum as it nears a breakout zone. The good trading volume adds confidence to this pattern, showing that market participants are positioning early in anticipation of a reversal.
Investors’ growing interest in AXLUSDT reflects rising confidence in the project’s long-term fundamentals and current technical strength. If the breakout confirms with sustained volume, this could mark the start of a fresh bullish leg. Traders might find this a valuable setup for medium-term gains, especially as the wedge pattern completes and buying momentum accelerates.
✅ Show your support by hitting the like button and
✅ Leaving a comment below! (What is your opinion about this Coin?)
Your feedback and engagement keep me inspired to share more insightful market analysis with you!
The Big Short AXLUSDT
Market Context
This idea is based on higher timeframe structure and short confluence.
It represents a probability based scenario, not a prediction.
The setup forms near a potential D1 top area.
Strategy
Strategy name: The Big Short
This setup focuses on short signals when multiple conditions align.
When confluence appears at higher timeframe levels, price may move quickly.
Leverage amplifies both risk and reward.
Risk management is mandatory.
Entry Zones
Planned short zones:
0.19
0.22
0.24
Position should be managed in parts to reduce execution risk.
Trade Management
Possible management approach:
Partial profit taking or active management based on price reaction.
With leverage, returns can be significant if the scenario plays out.
Losses must be predefined if structure fails.
Time Expectation
This setup is expected to develop over a short term window.
It follows the current cycle rather than intraday noise.
Risk Note
Always define invalidation before entry.
If price breaks the structure, the idea is invalid.
Capital protection comes first.
AXLUSDT Forming falling WedgeAXLUSDT is forming a clear falling wedge pattern, a classic bullish reversal signal that often indicates an upcoming breakout. The price has been consolidating within a narrowing range, suggesting that selling pressure is weakening while buyers are beginning to regain control. With consistent volume confirming accumulation at lower levels, the setup hints at a potential bullish breakout soon. The projected move could lead to an impressive gain of around 90% to 100% once the price breaks above the wedge resistance.
This falling wedge pattern is typically seen at the end of downtrends or corrective phases, and it represents a potential shift in market sentiment from bearish to bullish. Traders closely watching AXLUSDT are noting the strengthening momentum as it nears a breakout zone. The good trading volume adds confidence to this pattern, showing that market participants are positioning early in anticipation of a reversal.
Investors’ growing interest in AXLUSDT reflects rising confidence in the project’s long-term fundamentals and current technical strength. If the breakout confirms with sustained volume, this could mark the start of a fresh bullish leg. Traders might find this a valuable setup for medium-term gains, especially as the wedge pattern completes and buying momentum accelerates.
✅ Show your support by hitting the like button and
✅ Leaving a comment below! (What is your opinion about this Coin?)
Your feedback and engagement keep me inspired to share more insightful market analysis with you!
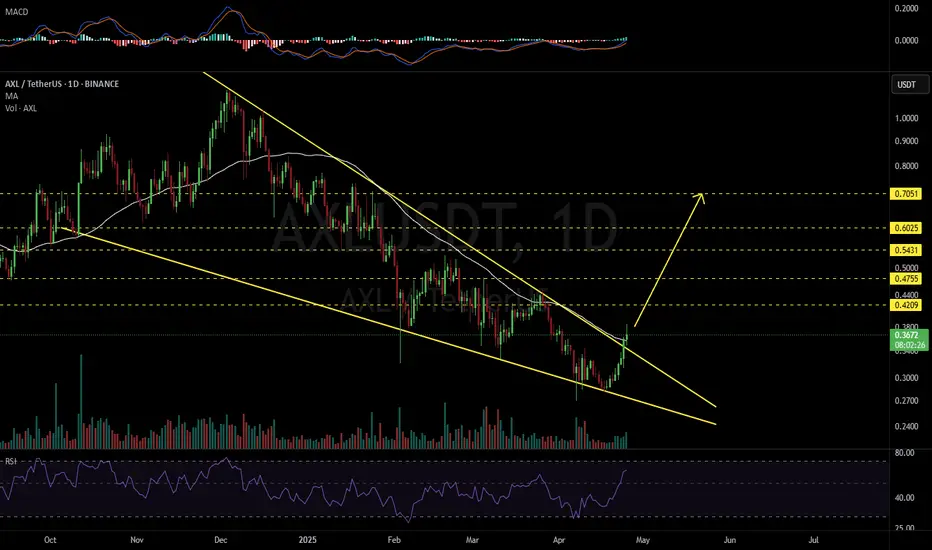
AXLUSDT 1D#AXL is moving inside a falling wedge pattern on the daily chart and has also formed a double bottom pattern.
Short-term targets:
🎯 $0.2317
🎯 $0.2606
In case of a breakout above the wedge resistance, the potential targets are:
🎯 $0.3084
🎯 $0.3470
🎯 $0.3855
🎯 $0.4404
🎯 $0.5104
⚠️ Always remember to use a tight stop-loss and maintain proper risk management.
AXLUSDT 1D#AXL is moving within a descending triangle on the daily chart. Recently, it bounced off the support zone and was rejected from the triangle resistance line and the Ichimoku cloud. We believe it will break above the resistance soon. If that happens, the potential targets are:
🎯 $0.4533
🎯 $0.5099
🎯 $0.5664
🎯 $0.6469
🎯 $0.7495
⚠️ Always remember to use a tight stop-loss and follow proper risk management.
AXLUSDT — Demand Zone Defense or Bearish Breakdown?📝 Overview
Currently, AXLUSDT (1D, Binance) is trading inside a key demand zone between 0.27–0.33 (yellow box on the chart). This area has been tested multiple times since April 2025, showing strong buying interest whenever price dips into it.
However, the broader structure still shows a clear downtrend with consistent lower highs, meaning the market is now at a critical decision point: will this demand zone hold and trigger an accumulation phase leading to reversal, or will sellers push price into a deeper bearish continuation?
---
📍 Key Technical Levels
Main Demand/Support Zone: 0.27 – 0.33
Lowest wick: 0.2702
Current mid-range: around 0.3143
Major Resistances above:
0.3726 → 0.4453 → 0.5099 → 0.5818 → 0.8150 → 1.1242 / 1.14 (High)
---
🔎 Structure & Pattern
Range base at the bottom of a downtrend: Price has been consolidating within this range since April.
Liquidity sweeps (fakeouts): Long wicks below the zone were quickly absorbed, signaling strong buyers defending the area.
Reversal confirmation: Only valid if price can close daily above 0.3726 and sustain it with a successful retest. Until then, risk of sideways chop or breakdown remains.
---
🚀 Bullish Scenario
1. Price sustains above 0.30 without a daily close below 0.27.
2. Breakout trigger: Daily close > 0.3726, followed by a successful retest → reversal confirmation.
3. Upside targets:
🎯 TP1: 0.4453
🎯 TP2: 0.5099
🎯 TP3: 0.5818
🎯 Extended: 0.8150 → 1.12–1.14 if momentum strengthens.
4. Bullish invalidation: Daily close < 0.27.
Aggressive approach: Buy around 0.30–0.31, SL below 0.27.
Conservative approach: Wait for breakout above 0.3726 and buy the retest.
---
📉 Bearish Scenario
1. Failure to hold the 0.27–0.33 demand will weaken structure further.
2. Daily close below 0.27 opens the door for deeper downside.
3. Next bearish targets:
First support: 0.2550
If broken, potential new lows due to lack of historical demand below.
---
⚖️ Conclusion
The 0.27–0.33 demand zone is a make-or-break level for AXLUSDT.
As long as price holds above it, the possibility of accumulation and reversal remains alive, especially with a breakout above 0.3726.
But if the zone fails, sellers may extend the downtrend to fresh lows.
In short: This is the golden zone for a decisive move — either accumulation to fuel a reversal, or a breakdown to continue the bearish trend.
#AXLUSDT #AXL #CryptoAnalysis #PriceAction #SupportResistance #DemandZone #RangeTrading #BreakoutSetup #BearishScenario #BullishScenario #CryptoTrading #DYOR
AXL : THE GENERATIONAL WEALTH CREATOR .. coming⚠️ RISK LEVELS (Know Your Exits)
🛡️ Support 1: $0.35 - Triangle support
🔴 ABORT: $0.25 - Major structure break
⚠️ MAX RISK: Never more than 5% of portfolio
⏰ TIMING IS EVERYTHING: THE COUNTDOWN BEGINS
PRICE TARGETS THAT WILL CHANGE LIVES
🚀 CONSERVATIVE TARGETS (High Probability)
🎯 Target 1: $0.80 (+95%) - First major resistance
🎯 Target 2: $1.20 (+192%) - Psychological barrier
🎯 Target 3: $1.60 (+290%) - Triangle height projection
_____________________________
Strategy: Buy and hold through breakout
Entry: $0.30 - $0.35
Stop Loss: $0.25 (Below all major support)
Target: $1.60 - $2.50 (290-500% gain)
Position Size: 3-5% of portfolio
Time Horizon: 2 - 5 months
Risk/Reward: 1:15 to 3:20
⚠️ This is not financial advice. Cryptocurrency investments carry high risk. Only invest what you can afford to lose completely. Always do your own research ⚠️
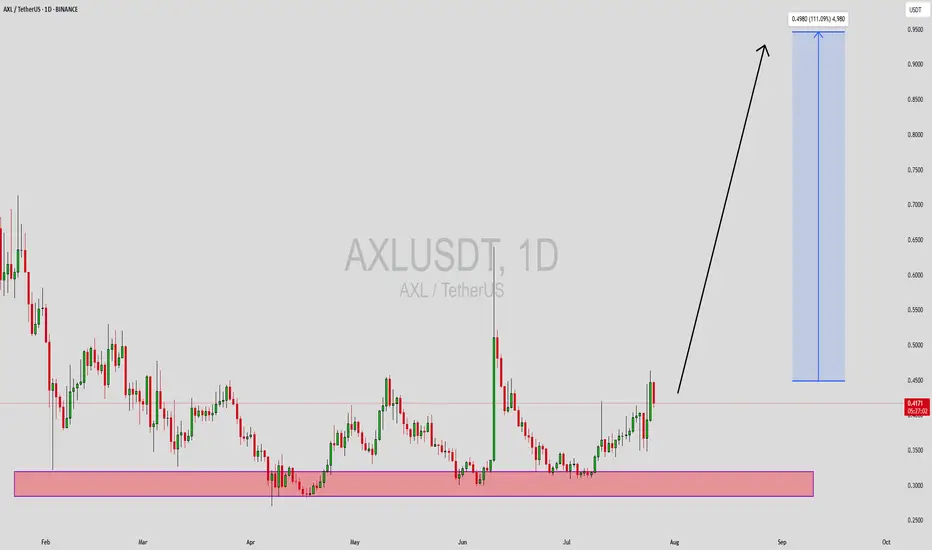
AXLUSDT Forming Bullish ReversalAXLUSDT is showing clear signs of a bullish reversal pattern on the daily timeframe, indicating a potential shift in market sentiment from bearish to bullish. This pattern is typically characterized by a slowing of downward momentum followed by a breakout to the upside, and AXL is currently forming higher lows—often the early signal of a trend reversal. The current price action suggests accumulation, and with increasing volume behind the recent moves, we may be on the verge of a significant breakout.
This technical setup is further strengthened by improved market structure and growing interest from traders and investors alike. The volume profile shows increasing participation at current levels, a strong indication that smart money could be stepping in. With bullish momentum building and the price reclaiming key support zones, the technical target points toward a 90% to 100% upside potential in the coming weeks.
AXL has been under the radar, but that may not last much longer. The project fundamentals are solid, and with market participants beginning to recognize the recovery potential, a trend shift seems imminent. As more traders start to identify this bullish reversal, we could see a rapid increase in price, especially if it breaks above resistance with strength.
Traders should keep a close eye on volume confirmation and price behavior around key levels to catch the breakout early. If momentum continues to build and resistance is flipped into support, AXLUSDT could deliver one of the stronger moves in the mid-cap altcoin space this quarter.
✅ Show your support by hitting the like button and
✅ Leaving a comment below! (What is You opinion about this Coin)
Your feedback and engagement keep me inspired to share more insightful market analysis with you!
Altcoins Market Bull Market Confirmed, AxelarThis is the same chart as Ravencoin; These are the same price dynamics and awesomely, the same results.
Good morning my fellow Cryptocurrency trader, this is a wonderful day because the altcoins market bull market is already confirmed, let me show you some more proof.
I used first Ravencoin as an early signal showing that the 2025 bull market is here, strong long-term growth; a bullish continuation, a new advance, higher prices next. The biggest bullish wave and bullish action since 2021 for the entire Cryptocurrency market.
Here is the pattern again explained:
1) There is a rise in late 2024, it lasted only one month from November through December. This coming off the August 2024 market bottom, when Bitcoin produced a flush.
2) The December 2024 high leads to a strong correction. This correction has three stop points. 3-Feb. mid-March and 7-April. 7-April marks the bottom for most pairs with the usual variations.
3) An initial recovery from the 7-April 2025 low leads to some growth. Some pairs grew 100-300% while others grew 30-60%.
4) This recovery gets corrected and ends in a higher low.
5) This higher low signal the start of the next advance, very strong bullish action. This is what you see on the chart.
Axelar (AXLUSDT) produced a very strong bullish breakout, we have more than 90% green on a single day. This is only the beginning, and many altcoins will be doing the same. Literally hundreds of altcoins will perform like this in the coming days.
The bull market is here and already confirmed.
It is still early, choose wisely.
Some will move now while others will continue lower.
Some will move but it will take months before they turn green.
Take your time looking at the charts and making your choice, choosing correctly means everything. It means the difference of winning daily and big vs staying holding something doesn't that doesn't grow.
If you agree make sure to follow.
If you have any questions, your comments are welcomed below.
Thanks a lot for your continued support.
Namaste.
AXLUSDT Forming Descending Wedge bullishAXLUSDT is currently showing strong bullish signals after consolidating at a significant support level, with a notable uptick in trading volume. This renewed volume interest often precedes a breakout move, and the technical structure is shaping up for a potential surge. With momentum building and price action tightening, a projected gain of 60% to 70% is realistically within reach in the short to mid-term. This aligns well with historical price behavior and upcoming support-to-resistance flips.
Axelar (AXL) continues to attract investor interest due to its foundational role in cross-chain communication and interoperability. As more blockchains develop in silos, the need for protocols like Axelar grows. Its ability to facilitate seamless transfers across multiple chains makes it a strong contender in the next wave of infrastructure-focused crypto projects. Market participants are increasingly positioning themselves in utility-driven tokens like AXL that solve real scalability and connectivity problems in DeFi and the broader crypto ecosystem.
From a technical perspective, AXLUSDT is forming a bullish continuation pattern, suggesting that the recent consolidation is simply a pause before another impulsive leg to the upside. The presence of strong support zones, combined with increased volume and investor sentiment, makes this a high-probability setup for breakout traders and swing investors alike. If bullish momentum continues, the upside targets fall well within the 60% to 70% projected gain range.
Traders should keep a close watch on breakout confirmation signals and volume spikes, which could mark the start of a sustained bullish rally. As adoption and attention around cross-chain solutions grow, AXL is likely to see further market traction and price appreciation.
✅ Show your support by hitting the like button and
✅ Leaving a comment below! (What is You opinion about this Coin)
Your feedback and engagement keep me inspired to share more insightful market analysis with you!
AXL/USDT – Falling Wedge Breakout! Time to Ride the Wave!!🚀 AXL Breakout Alert – 100% Potential Incoming?! 👀🔥
Hey Traders! If you're all about high-conviction plays and real alpha, smash that 👍 and tap Follow for more setups that actually deliver! 💹💯
AXL has broken out of its long-term falling wedge pattern on the daily timeframe—this is a strong reversal signal and could set the stage for a big move ahead! 🔥
🟢 Entry Zone:
CMP (Current Market Price)
Add more up to: $0.38
🎯 Targets:
🎯 TP1: $0.515
🎯 TP2: $0.634
🎯 TP3: $0.751
🎯 TP4: $1.007+
🛡️ Stop Loss: $0.325 (below wedge support)
💡 Insight:
This breakout is aligning with the overall bullish momentum we're seeing in the altcoin market. Watch for a healthy retest of the breakout zone to confirm strength. 🚀
📊 Risk Management Tip: Start taking partial profits at each target and trail your SL to lock in gains.
Let’s ride this breakout smartly! 🔥
AXLUSDT UPDATE
AXL/USDT Technical Setup
Pattern: Falling Wedge Breakout
Current Price: \$0.3837
Target Price: \$0.73
Target % Gain: 95.47%
Technical Analysis: AXL has broken out of a falling wedge on the 2D chart with a strong bullish candle and 11.48% daily gain. Volume is rising, confirming the breakout with clear upside potential toward \$0.73.
Time Frame: 2D
Risk Management Tip: Always use proper risk management.
#AXL/USDT#AXL
The price is moving within a descending channel on the 1-hour frame, adhering well to it, and is heading for a strong breakout and retest.
We are experiencing a rebound from the lower boundary of the descending channel, which is support at 0.3360.
We are experiencing a downtrend on the RSI indicator, which is about to break and retest, supporting the upward trend.
We are looking for stability above the 100 Moving Average.
Entry price: 0.4040
First target: 0.4336
Second target: 0.4580
Third target: 0.4925