AXSUSD Could Be Setting Up for a Major Reversal ??AXS Could Be Setting Up for a Major Reversal ??
I've been watching NYSE:AXS closely, and one thing stands out. Price is still holding a strong demand zone after testing it multiple times. Buyers are continuing to defend this area, which tells me the downside is becoming weaker. However, I'm not interested in entering just because price is sitting at support.
For this long setup to become valid, I want to see the market prove itself first. A clean breakout above the descending trendline, followed by a solid 4H candle close above it, is the first confirmation. After that, I want to see a successful retest where the trendline flips into support. If buyers can hold that level and continue printing higher lows, the probability of a larger move increases significantly.
Patience is what separates good traders from everyone else. I don't chase candles or guess reversals. I wait for confirmation, manage risk, and let the market show its hand first. If these conditions are met, AXS could offer a very attractive long opportunity toward the next higher liquidity zones.
In-depth trading ideas
AXS at macro floor: base recovery toward $1.28The Macro Picture 🗺️
AXS unwound the full move from the $1.78 spike down to the $0.87 June low, then stopped falling. Price has spent weeks basing on the round $1.00 level, with RSI flattening near 48 — the slow, sideways grind that marks a bottom being built rather than a trend still breaking down.
The Setup ⚙️
The Accumulation Zone 🟢
$0.87–1.00 is where sellers ran out. The June flush got absorbed and every dip back toward $0.90 has been defended. This is the demand base the recovery works from.
The Decision Point 🔴
$1.13 (Local High) is the first hurdle. Reclaiming it flips the local structure bullish and opens the road to the $1.28 macro ceiling.
The Roadmap 🛣️
Hold the $1.00 base → break $1.13 → run toward $1.28 macro resistance. Invalidation is a clean daily close below $0.87 — that voids the accumulation thesis.
This is a textbook DCA Accumulation Zone setup: scale in across the $0.87–1.00 band and let the base do the work.
More setups in profile.
#AXS #AxieInfinity #crypto #trading #TA #3Commas #DCA
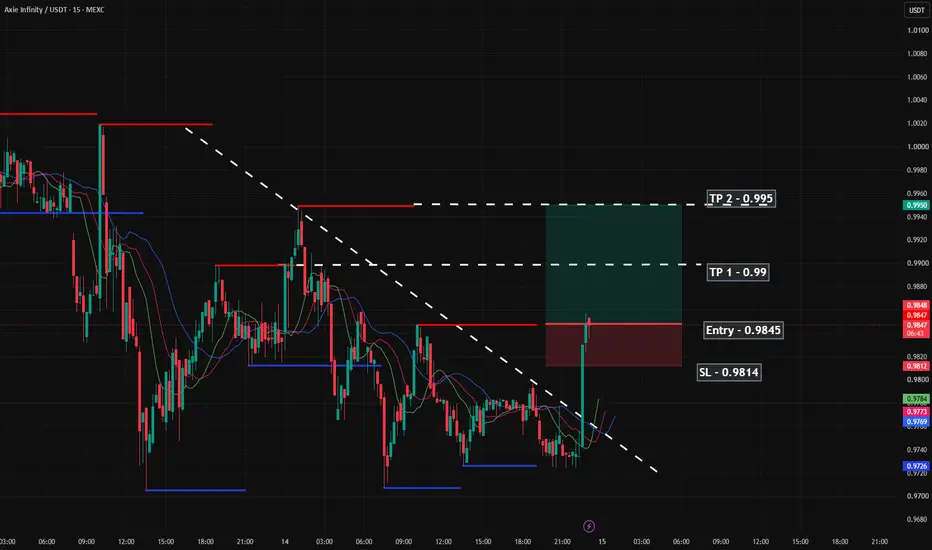
ShortInstructions:
Entry point: yellow
Stop loss: red
Take profit: green
👉Leverage x 5-10-20 for crypto
👉Leverage x 20-50-100 for commodities, stocks, indices, and forex
👉Margin 1-5% max.
Always practice risk and money management.
Invest a maximum of 5% on any trade or across all your trades.
Invest only what you can afford to lose, as no one is in control of the market.
👉Our analyses are primarily based on:
breakouts: two trend lines (ascending and descending) and a line indicating a horizontal breakout.
chart patterns: shoulders and head, triangle parttern, elliott impulse, etc etc.
We don't always have the time to track them at all times or to represent them visibly, given the numerous signals, the number of channels to manage, and especially because of the often rapid pace of market movements.
indicators: We associate at least two indicators with this technique.
👉Depending on the circumstances, we use specific indicators, often setting 3 or more take profit levels.
👉Indeed, there are good days in trading and also bad days. No one can promise to win every trade, and like all traders worldwide, we also experience stop-loss orders. However, we win more than we lose and remain positive.
👉You can close the position before or after the take profit orders indicated by the green lines if you are personally satisfied; the same applies to stop loss orders.
👉We must stay positive, clear-headed, and humble.
we cannot provide all instructions or all trades here on this channel.
Good luck to us all, and may God guide us. Amen.
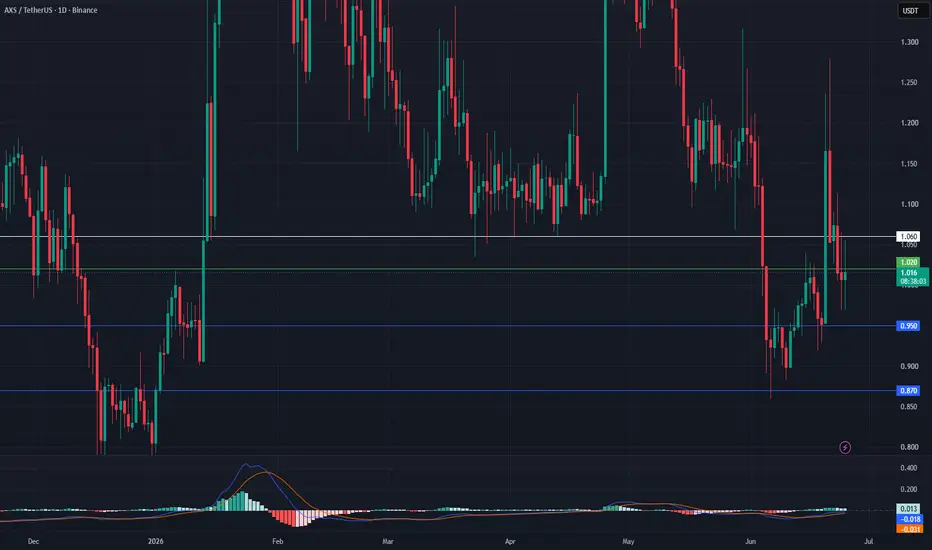
AXS Bearish Setup: Support Test Could Open Further DownsideAXS is currently testing support after a prolonged period of weakness.
If negative headlines emerge and risk-off sentiment returns, a breakdown from current levels could accelerate the next move lower.
This remains one of the cleaner downside setups if selling pressure continues to build.
Trade Levels:
Entry: $1.02
Take Profit 1: $0.95
Take Profit 2: $0.87
Stop Loss: $1.06
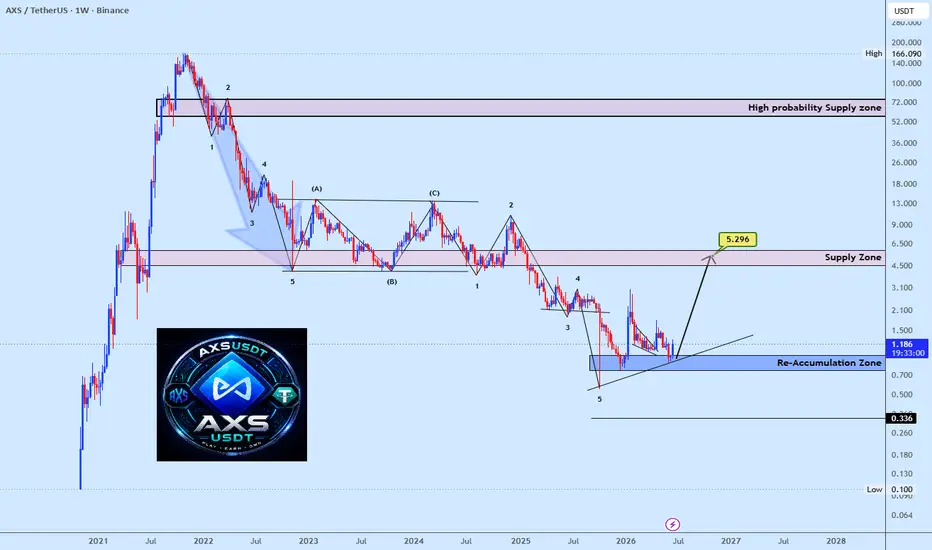
AXSusdt Structure Suggests a New Uptrend Is BrewingAXS appears to have completed a prolonged corrective phase and is now showing early signs of a fresh impulsive structure emerging from a key re-accumulation zone. The recent higher low formation and trendline support suggest that sellers may be losing control, opening the door for a trend reversal. If buyers continue to defend the current base, the next major objective lies around the $5.30 supply zone, which could mark the beginning of a broader expansion phase. The completed correction may have set the stage for a new bullish cycle, making the current region one to watch closely.
AXSUSDT 1D#AXS is on the verge of breaking out above the descending resistance and the daily SMA50 on the daily chart. If the daily candle closes above these levels and a successful retest follows, the potential upside targets are:
🎯 $1.248
🎯 $1.356
🎯 $1.464
🎯 $1.617
🎯 $1.813
⚠️ Always remember to use a tight stop-loss and maintain proper risk management.
Axsusdt short Instructions:
Entry point: yellow
Stop loss: red
Take profit: green
👉Leverage x 5-10-20 for crypto
👉Leverage x 20-50-100 for commodities, stocks, indices, and forex
👉Margin 1-5% max.
Always practice risk and money management.
Invest a maximum of 5% on any trade or across all your trades.
Invest only what you can afford to lose, as no one is in control of the market.
👉Our analyses are primarily based on:
breakouts: two trend lines (ascending and descending) and a line indicating a horizontal breakout.
chart patterns: shoulders and head, triangle parttern, elliott impulse, etc etc.
We don't always have the time to track them at all times or to represent them visibly, given the numerous signals, the number of channels to manage, and especially because of the often rapid pace of market movements.
indicators: We associate at least two indicators with this technique.
👉Depending on the circumstances, we use specific indicators, often setting 3 or more take profit levels.
👉Indeed, there are good days in trading and also bad days. No one can promise to win every trade, and like all traders worldwide, we also experience stop-loss orders. However, we win more than we lose and remain positive.
👉You can close the position before or after the take profit orders indicated by the green lines if you are personally satisfied; the same applies to stop loss orders.
👉We must stay positive, clear-headed, and humble.
we cannot provide all instructions or all trades here on this channel.
Good luck to us all, and may God guide us. Amen.
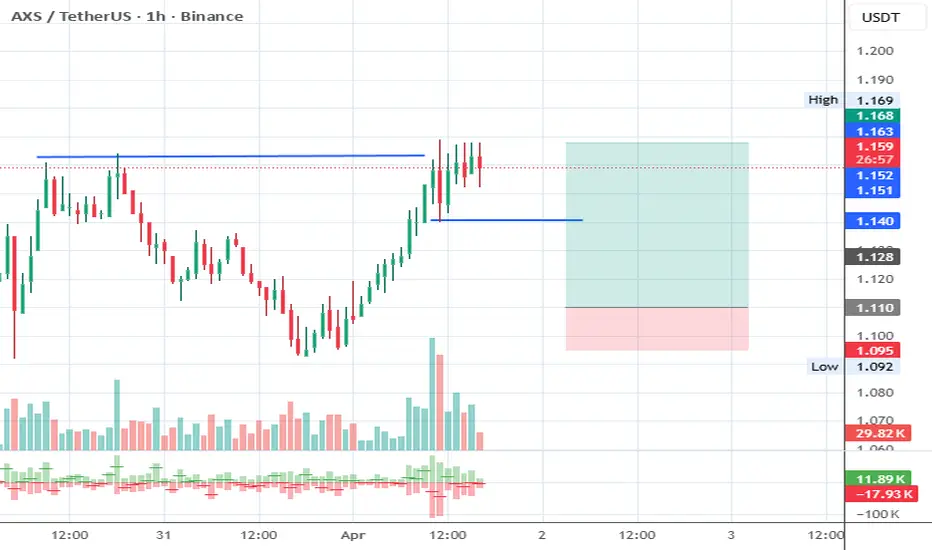
Axsusdt longInstructions:
Entry point: yellow
Stop loss: red
Take profit: green
👉Leverage x 5-10-20 for crypto
👉Leverage x 20-50-100 for commodities, stocks, indices, and forex
👉Margin 1-5% max.
Always practice risk and money management.
Invest a maximum of 5% on any trade or across all your trades.
Invest only what you can afford to lose, as no one is in control of the market.
👉Our analyses are primarily based on:
breakouts: two trend lines (ascending and descending) and a line indicating a horizontal breakout.
chart patterns: shoulders and head, triangle parttern, elliott impulse, etc etc.
We don't always have the time to track them at all times or to represent them visibly, given the numerous signals, the number of channels to manage, and especially because of the often rapid pace of market movements.
indicators: We associate at least two indicators with this technique.
👉Depending on the circumstances, we use specific indicators, often setting 3 or more take profit levels.
👉Indeed, there are good days in trading and also bad days. No one can promise to win every trade, and like all traders worldwide, we also experience stop-loss orders. However, we win more than we lose and remain positive.
👉You can close the position before or after the take profit orders indicated by the green lines if you are personally satisfied; the same applies to stop loss orders.
👉We must stay positive, clear-headed, and humble.
we cannot provide all instructions or all trades here on this channel.
Good luck to us all, and may God guide us. Amen.
AXS Price Setup Suggests Explosive Move Toward $1.95 means 42%Hi,
I’m expecting a few strong bullish weeks for $axsusdt. The high trading volume, combined with solid support on the daily chart and the trendline holding up well, points to at least a 42% upside, with a price target of around $1.95 .
Need a little love!
We pour love into every post your support keeps us inspired! Don’t be shy, we’d love to hear from you on comments. Big thanks
AXS is ready to break resistances one after otherAxie Infinity (AXS) is showing strong technical indications that a significant upward move is approaching. The chart reveals a clear pattern of increasing volume in two distinct sections, both occurring near the monthly support zone. In technical analysis, volume expanding at a major support level is a classic sign of accumulation – large players are absorbing supply while retail interest remains low.
This volume increase has already translated into real price appreciation. Over the previous months, AXS has recorded gains of approximately +50% to +100% . Following this initial leg up, the price entered a period of rest and consolidation – a healthy pause that often precedes the next impulsive wave.
Given the volume structure, the proximity to monthly support, and the bullish price action observed in recent months, there are strong indications that something big is cooking. The current consolidation appears to be a continuation pattern rather than a reversal, and further gains are expected to materialize soon.
AXSI was entertaining the idea that alt coins could have a surge this year due to most of them being -99% or more from their all time highs in 2021. This idea has been gaining more and more validity due to several high volume pumps on different alts, particularly gaming alts. To me this price action feels like whales have been quiet accumulating the past few months and are now making moves to finally change the multi year downtrend to induce the market into a multi month bull run.
This would be a long play aiming to hold for 6-9 months, not without volatility and several ups and downs, and profits will most likely fluctuate a lot, but those who trade the longer timeframes will of course withstand the pressure of selling early. I am holding only a handful of coins myself, AXS being one of them, but I am tracking 20 names in the gaming space that seem to be coming to life in the recent days. We will see where this goes in the next months, I am expecting a green May for lots of names, as it seems that BTC and ETH will also pump in May.
The narrative will probably shift quickly, as in any bull market. I expect the story this time around will be the games that incorporate AI in some form or fashion to their users. The stock market has also been going nuts reaching all time highs recently. If the FED gives the market at least 1 rate cut in the next months that will probably be enough to fuel wild speculation and pump alts to new highs. Names I am tracking are the likes of IMX, SAND, MANA, GALA, APE, ENJ, ALICE, etc. Some of them are already seeing high volume green days, which to me, signals a move from big money entering huge positions for a long term hold.
AXSUSDT Forming Bullish MomentumAXSUSDT is currently forming a clear bullish momentum pattern, a classic wave structure that often signals an upcoming breakout. The price has been consolidating within a narrowing range, indicating that selling pressure is gradually weakening while buyers are beginning to regain control. With consistent volume supporting accumulation at lower levels, the setup suggests a potential bullish breakout in the near term.
If the price breaks above the wedge resistance, the projected move could be strong, with a potential gain of around 90% to 100%. This type of bullish momentum pattern is commonly seen at the end of downtrends or corrective phases, signaling a possible shift in market sentiment from bearish to bullish.
Traders closely monitoring AXSUSDT are noticing strengthening momentum as it approaches a key breakout zone. The presence of solid trading volume adds confidence to this setup, indicating that market participants may already be positioning themselves ahead of a potential reversal.
Growing investor interest in AXSUSDT reflects rising confidence in its technical strength and overall market potential. If the breakout is confirmed with sustained volume, it could mark the beginning of a fresh bullish leg. This setup may provide a valuable opportunity for medium-term traders as momentum builds and the pattern completes.
✅ Show your support by hitting the like button
✅ Leave a comment below (What is your opinion about this coin?)
Your feedback and engagement keep me motivated to share more insightful market analysis with you!
AXSUSDT the 3$ and even 10$ is not anymore dreamMarket strength has returned, creating a favorable environment for altcoins to resume their upward momentum. Historically, periods of renewed market strength have often led to significant rallies across the altcoin sector, particularly for assets with strong fundamentals or technical setups.
One notable example is AXS (Axie Infinity) , which has demonstrated strong potential from a technical perspective. The current chart structure suggests that AXS is positioning itself for a manageable and realistic upside move.
In this environment, we are targeting a conservative and low-risk objective on this chart. By utilizing low leverage to manage risk effectively, the primary target aligns with the channel resistance level, which currently corresponds to approximately 2x from the current price.
Educational Note:
When market strength returns, it typically refers to a rise in market-wide buying pressure, often confirmed by increasing total market capitalization, volume expansion, or Bitcoin dominance stabilizing or declining in favor of altcoins. Trading with low leverage in such setups helps protect against unexpected volatility or false breakouts, especially when targeting clear technical levels like channel resistance.
✍🏼Author's word: Like & comment(your thoughts) if you found it helpful.🩷
$AXS at a Key Support Zone — Bounce or Breakdown?Something interesting caught my attention on the $AXS/USDT chart.
Price reached this key zone on October 10th and showed strong liquidity absorption, leaving a large wick on the daily timeframe.
In my view, this area looks like a potential buying zone. If price revisits the level, we could see a reaction and possibly a double bottom forming.
This level comes from higher timeframes (Weekly / Monthly), which makes it a strong support area.
Do you think NYSE:AXS will hold this support or break below it?
#Crypto #AXS #CryptoTrading #TechnicalAnalysis #Altcoins
BNB Futures Squeeze Fired but Spot Didn't Follow - Classic Trap
1. BNB Futures Squeeze Fired but Spot Didn't Follow - Classic Trap Setup
Overview
BNB is in a moderate bear trend at 64.4% bearish but showing early signs of recovery. Price has bounced 1.1% at 2.4x strength which is flagged as recovered. The problem is the recovery is happening on dead volume with a 342x futures to spot ratio flagged as manipulation. Futures squeeze has fired but spot hasn't - that's the same "Futures Only Trap" divergence. One bright spot: whales are buying and OBV has flipped to inflow. The question is whether whale accumulation can overcome the leverage distortion.
Price Context
Spot: 614.3
Futures: 613.8
Retrace: -0.4% (barely pulled back)
Bounce: 1.1% at 2.4x (recovered status)
Spread: 17.9% (moderate)
Price action is tight here. Barely any retrace, modest bounce, but the 2.4x multiplier on the bounce earned it a recovery flag. Spread at 17.9% is moderate - not stretched but not calm either. The spot-futures gap is only 50 cents which is healthy, meaning no major dislocation between the two markets on price alone.
Bias
Moderate bear at 41.1 bull vs 58.9 bear with 50% clarity. This is a coin flip environment.
EMA structure is 0:9 bearish - trend is clearly down across almost every timeframe. Ichimoku is 4:9 which is bearish but showing some resistance from the bull side. Candle signals lean bullish at 9:4 which means short-term price action is trying to fight back.
Counter signals at 5:9 still favor bears. Engulfing is 2:1 bullish. Star patterns at 2:1. Pattern totals at 3:1 favoring bulls. SS/DD is 1:5 bearish which means supply zones dominate overhead.
Classification is "None" - no clean pattern resolution, just a bear trend with early bullish signals trying to form at the edges.
Volume Intelligence
Volume is the weak link here.
Spot Z: -0.55 (quiet)
Futures Z: -0.59 (quiet)
Combined Z: -0.59 (quiet)
Momentum: 0.08 and rising
OBV Z: -1.47 with inflow - this is the standout signal
Futures to Spot ratio: 342.39x flagged as manipulation. Spot volume is 167.69K against 57.41M in futures. Dollar terms: 103.01M spot vs 35.27B futures. That's an absurd ratio for BNB. The futures market is running 342 times larger than spot. Price discovery is not happening on the spot market right now.
Whale activity: Whale BUYING detected. This is significant because it contradicts the overall bearish structure. Someone with size is accumulating while retail volume is asleep.
OBV at -1.47 with inflow means selling pressure has been heavy historically (hence the negative Z-score) but the direction has now flipped to inflow. That's early accumulation behavior. The question is whether it sticks.
Futures squeeze: FIRED
Spot squeeze: Not fired
Divergence: Futures Only flagged as TRAP
Same pattern as AXS - the expansion is coming from leveraged positioning, not spot. Spot squeeze momentum is expanding at 1% which is barely anything. Until spot catches up, the move is suspect.
Leverage
Current: 347.6x flagged as manipulation
Percentile: 0% bottom
All-time max: 631.1x (10946 bars ago)
All-time min: 67.16x (17713 bars ago)
50-bar range: 347.6 to 351.64
200-bar range: 347.6 to 357x
This is interesting. Leverage is at its absolute floor for recent history. The 0th percentile means leverage has never been this low relative to its own range. The 50-bar and 200-bar ranges are incredibly tight, all hovering around 347-357x. BNB consistently runs with extreme leverage ratios as a baseline.
For BNB specifically, 347x might just be normal operating conditions rather than a danger signal. The AT min of 67x was nearly 18,000 bars ago - a completely different era. What matters more is the direction: is leverage expanding or contracting? At the bottom of its recent range, it could expand from here which would amplify any directional move.
Premium
Premium: -0.08% (essentially flat, neutral)
Z-score: -0.3 (normal range)
Yield: -84% APY at -0.3 sigma
Mean Z: -1.14 sigma falling
Premium is a non-event here. Futures are trading almost exactly at spot price. No extreme fear or greed showing in the basis. The mean Z falling at -1.14 suggests the longer-term premium trend has been declining but nothing is screaming at current levels.
Standard deviation at 0.024% is stable and normal. No volatility in the premium itself which means no sudden repositioning by the futures market.
Squeeze
Status: No active squeeze on the combined reading
Momentum: Bull with uptick
Bandwidth: 1.06%
Futures squeeze: FIRED
Spot squeeze: Not fired
Divergence: Futures Only flagged as TRAP
Bandwidth at 1.06% is tight. The combined squeeze hasn't triggered but momentum is already bullish with an uptick. If compression continues for a few more bars and spot catches up to the futures fire, the breakout could carry real weight. But right now we're in the same trap territory - futures leading without spot confirmation.
Spot momentum is expanding at just 1% - barely registering. This needs to accelerate significantly before anyone should trust a bullish squeeze resolution.
Scenarios
Whale Accumulation Leads to Reversal (35% probability):
Whale buying plus OBV inflow flip are genuinely bullish signals that don't show up often. If spot volume picks up to confirm what the whales are doing, the squeeze could resolve higher. Candle patterns at 9:4 bullish and engulfing at 2:1 support a short-term turn. Target would be back toward the supply zones overhead. The risk is that one whale doesn't make a market and retail needs to follow.
Futures Trap Plays Out, Bears Continue (40% probability):
The dominant trend is still bearish with 0:9 EMA and 5:9 counter signals. The futures-only squeeze fire is statistically unreliable. Dead spot volume at -0.55 Z means there's nobody underneath to catch a move if it reverses. Leverage at the bottom of its range could expand in either direction but the 342x ratio means the move will be driven by liquidations, not organic flow.
Sideways Grind in Compression (25% probability):
BNB is a large cap and can absorb pressure without moving much. Volume is dead on both sides, premium is flat, and the squeeze hasn't fully formed on the combined reading. This could just chop around current levels until a catalyst shows up. The whale buying might be slow accumulation that takes days or weeks to play out rather than an imminent move.
Watch List
1. Spot squeeze fire - the single most important confirmation needed, without it the futures move is a trap
2. Whale flow persistence - one reading of whale buying needs follow-through, watch for continued accumulation
3. OBV direction - just flipped to inflow, needs to hold and deepen to confirm accumulation
4. Spot volume Z - must break above 0 to show real participation
5. EMA structure - 0:9 bearish, first signs of any timeframes flipping would signal trend exhaustion
6. Futures to spot ratio - 342x needs to compress, ideally below 100x for cleaner price action
Risk
BNB has a structurally high leverage environment which makes it permanently noisy. The 342x ratio is extreme even by BNB standards and means every price move is amplified by leveraged positioning rather than spot demand. The futures-only squeeze trap is the second one seen today across different assets - it's a market-wide pattern right now where futures are leading and spot is absent.
The whale buying is the most interesting signal here and the one worth monitoring. Whales don't buy on dead volume for no reason. But one whale buy reading doesn't override a full bearish structure with 0:9 EMAs and no spot volume. Wait for confirmation: spot squeeze fire, rising spot Z, and continued whale accumulation. If all three show up, the long side gets interesting. Until then, this is a watch not a trade.
More analysis on my profile.
Tags: BNBUSDT, BNB, Binance Coin, volume analysis, futures, spot, leverage, squeeze, premium, manipulation, whale, accumulation, trap
AXS Bears in Full Control but a Squeeze is Building. Which Way DOverview
AXS is in a strong bear trend with 69.4% bearish bias and the structure is overwhelmingly red. But there's a twist - a high squeeze has been compressing for 11 bars with bullish momentum building. The problem is the futures squeeze already fired while the spot squeeze hasn't. That's a divergence flagged as "Futures Only Trap." Whales are selling, leverage is in the 86th percentile at 67x, and spot volume is dead. The squeeze might pop but the underlying conditions say don't trust it.
Price Context
- Spot: 1.335
- Futures: 1.325
- Retrace: -0.3% (barely off lows)
- Bounce: 1.3% at 4.3x (breakout level but unconfirmed)
- Spread: 34.6% (stretched)
Price is basically sitting on its lows with almost no retrace. The 4.3x bounce ratio looks strong on paper and is flagged as a breakout, but without volume or spot confirmation it's just leverage doing the pushing. A 34.6% spread tells you the asset is extended and volatile.
---
## Bias
Strong bear at 32.7 bull vs 67.3 bear. The breakdown by signal type tells the story:
EMA structure is fully red at 0:10 - not a single timeframe has bullish moving average alignment. Ichimoku is the same at 1:10. These are the trend indicators and they're screaming down.
Candle signals are more balanced at 7:6 and patterns are 2:0 bullish with engulfing at 2:0. So short-term price action is trying to turn, but it's fighting against a wall of bearish structure above.
Supply/demand is 0:9 bearish. Nine timeframes showing supply zones overhead. Counter signals at 5:9 confirm bears still dominate the longer view.
Classification is "None" which means there's no clean pattern completion - just raw trend pressure.
---
## Volume Intelligence
Everything is quiet and what little activity exists is bearish.
- Spot Z: -0.55 (quiet, below average)
- Futures Z: -0.6 (quiet)
- Combined Z: -0.6 (quiet)
- Momentum: 0.08 and rising slightly
- OBV Z: 0.66 with outflow - distribution, not accumulation
Futures to Spot ratio: 66.94x flagged as danger. Spot volume is 2.06M against 138.2M in futures. Dollar terms: 2.74M spot vs 183.11M futures. For every dollar traded on spot, there's 67 dollars in futures. This is not real demand.
Whale activity: Active whale SELLING detected. Big players aren't buying the dip - they're distributing into it.
The critical signal here is the squeeze divergence. Futures squeeze has FIRED but spot squeeze hasn't triggered. This is flagged as "Fut Only Trap" - meaning the breakout is being driven entirely by leveraged positioning, not by actual spot market participation. These moves tend to reverse violently once the leverage unwinds.
Spot squeeze momentum is expanding at 4.4% which could precede a spot squeeze firing too. If spot catches up to futures, the move could become legitimate. But right now it's one-sided.
Leverage
- Current: 67.33x flagged as danger
- Percentile: 86.6% - upper range, almost at historical extremes
- All-time max: 70.97x just 135 bars ago
- All-time min: 3.69x (way back at 19927 bars ago)
- 50-bar min: 67.33x (current IS the 50-bar min, meaning it's been even higher recently)
This is wild. Leverage has been pinned near its all-time max for an extended period. The 50-bar range is 67.33 to 70.91 which means leverage hasn't cooled off at all recently. It's been running hot for a long time. That's a spring loaded for a violent deleveraging event in either direction.
## Premium
- Premium: -0.75% backward (futures trading below spot)
- Z-score: 0.7 (slightly above normal but not extreme)
- Yield: -820% APY at 0.70 sigma
Futures cheaper than spot means the leveraged crowd is positioned net short or at least not willing to pay a premium for longs. This aligns with the bearish bias. The Z-score isn't extreme though, so the premium displacement isn't at panic levels yet. Mean Z at 0.68 is normal territory.
Squeeze
- Status: HIGH compression for 11 bars
- Momentum: Bull with uptick
- Bandwidth: 1.13%
- Futures squeeze: FIRED
- Spot squeeze: Not fired
- Divergence: Futures Only - flagged as TRAP
This is the most important signal on the chart right now. Eleven bars of high compression means energy is stored and a big move is coming. Momentum has shifted bullish which normally favors an upside break.
But the futures squeeze firing without spot is a major red flag. It means the expansion is being driven by leveraged derivatives, not by real buying. These divergent squeezes have a high failure rate. When the futures move isn't backed by spot, it tends to reverse and trap everyone who chased it.
Watch for spot squeeze to fire. If it does, the move could become real. If it doesn't and futures momentum stalls, expect a flush back down.
Scenarios
Bearish Continuation / Squeeze Trap (50% probability):
The base case. Strong bear structure, 0:10 EMA, 1:10 Ichimoku, whale selling, OBV outflow, futures-only squeeze fire. The squeeze breaks down, leverage unwinds from the 86th percentile, and price makes new lows. The 4.3x breakout signal gets invalidated and becomes a bull trap.
Squeeze Breakout Higher (30% probability):
The squeeze has 11 bars of compression and bullish momentum. If spot squeeze fires and volume enters, this could rip higher purely on short liquidations. Leverage at 67x means a lot of shorts are exposed. Engulfing patterns at 2:0 and the star/pattern signals support a reversal attempt. Watch for spot Z to cross above 0 with momentum acceleration.
Grind and Recompress (20% probability):
The squeeze fizzles, momentum dies, and price enters a new compression cycle. Volume is quiet on both sides so there might not be enough energy to break in either direction yet. Bandwidth at 1.13% is tight but could get tighter before the real move.
Watch List
1. Spot squeeze - needs to fire to validate the futures breakout, otherwise treat it as a trap
2. Whale flow - currently selling, flip to buying would change the picture fast
3. Spot volume Z - sitting at -0.55, needs to push above 0 for any real participation
4. Leverage percentile - at 86.6%, a deleveraging event could come from either direction
5. OBV direction - outflow needs to flip to inflow for accumulation confirmation
6. EMA structure - 0:10 bearish, watch for even one or two timeframes to flip as early reversal signal
---
## Risk
This is a high-risk setup in either direction. The squeeze is storing energy but the conditions underneath are bearish - whale selling, OBV outflow, futures-only breakout, and leverage near all-time highs. The most dangerous trade here is buying the squeeze breakout without spot confirmation. If you're short, the squeeze could blow up in your face if spot catches fire. If you're long, you're fighting the trend with no volume backing you.
Best approach: wait for spot squeeze to fire and confirm direction. If it fires bullish with rising spot volume, ride the momentum. If it doesn't fire within the next few bars while futures momentum fades, the trap is confirmed and shorts have the edge.
More analysis on my profile.
**Tags:** AXSUSDT, AXS, Axie Infinity, altcoin, volume analysis, futures, spot, leverage, squeeze, premium, manipulation, whale, breakout, trap
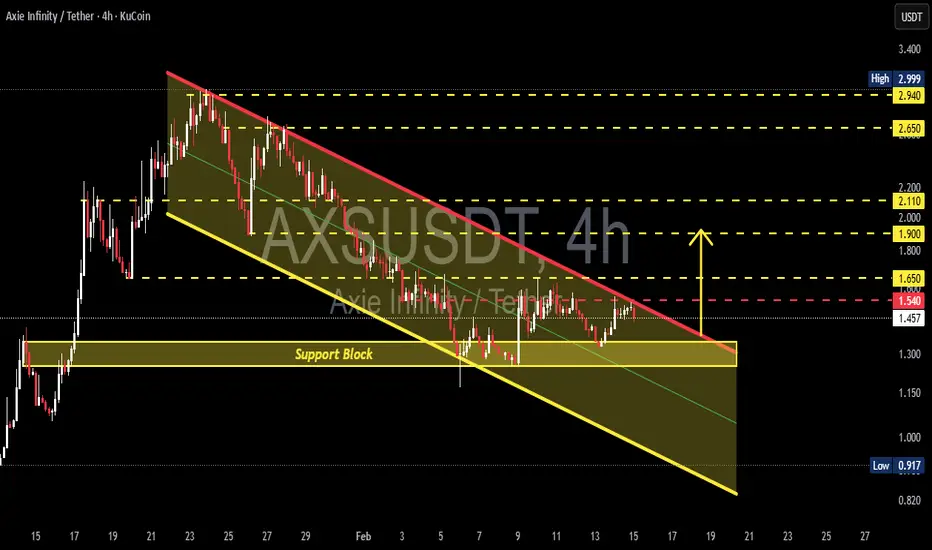
AXSUSDT Ready to Explode? Channel Break Could Trigger Relief!The Axie Infinity / USDT pair on the 4H timeframe is still within a mid-term downtrend structure after failing to hold the supply area around 2.9 – 3.0 USDT.
Price action continues forming consistent Lower Highs (LH) and Lower Lows (LL), indicating strong seller dominance. Currently, price is consolidating right above a crucial support block following rejection from the main trendline resistance.
---
Structure & Pattern Formation
1. Descending Channel / Falling Wedge Hybrid
Two descending trendlines are visible:
Resistance trendline (red) → connecting LHs.
Support trendline (yellow) → holding LLs.
Structure is tightening → indicates volatility compression.
This type of pattern often results in:
Continuation if breakdown occurs.
Reversal if an upside breakout happens.
2. Support Block Demand Zone
The strong demand area is located at:
1.30 – 1.35 USDT
Key confluence factors:
Previous base before impulsive rally.
Multiple wick rejections.
Volume absorption showing buyer defense.
---
Key Levels
Resistance:
1.54 → Minor resistance / latest rejection.
1.65 → Mid-channel resistance.
1.90 → Horizontal resistance.
2.11 → Supply flip area.
2.65 → Major resistance.
2.94 – 3.00 → Macro supply / swing high.
Support:
1.30 – 1.35 → Major support block.
1.15 → Minor channel support.
0.91 → Extreme low / liquidity target.
---
Bullish Scenario
Bullish confirmation requires:
1. Breakout above the red resistance trendline.
2. Strong candle close above 1.54.
3. Successful retest turning resistance into support.
Upside targets:
1.65
1.90
2.11
2.65
2.94
Additional confirmation:
Volume expansion on breakout.
Bullish RSI divergence (if present).
Market structure shift from LH → HH.
Meaning:
Buyers escape channel pressure and initiate a mid-term reversal phase.
---
Bearish Scenario
Bearish continuation activates if:
1. The 1.30 – 1.35 support block breaks.
2. Candle closes below the demand zone.
3. Retest fails to reclaim the area.
Downside targets:
1.15
1.00 psychological level
0.91 (liquidity sweep zone)
A breakdown would confirm a new Lower Low, continuing the downtrend structure.
---
Conclusion
Primary trend: Bearish (mid-term)
Current position: Above key demand
Structure: Descending channel compression
Potential: Reversal on breakout / Dump on support loss
This is a decision zone.
Price reaction between 1.30 – 1.54 will determine whether AXS:
Starts a relief rally.
Or continues distribution lower.
#AXSUSDT #AXSAnalysis #CryptoTechnicalAnalysis #AltcoinSetup #DescendingChannel #SupportResistance #DemandZone #BreakoutSetup #TradingViewAnalysis #CryptoTrading #AltcoinSeason #PriceAction
AXS the entry of that 10x signal hit again AXS is once again testing a critical support zone near $1.10, a level that has historically attracted significant buying interest. This area represents a major technical foundation from which a renewed bullish impulse could emerge.
Immediate Target:
Should the support hold and a confirmed reversal pattern form—characterized by bullish candlestick confirmation and increasing volume—the first measured move target projects a rally toward the $4.00 resistance zone.
Upside Potential:
A successful breach of the monthly trendline could initiate a move toward the $10.00 resistance zone, representing a 10x appreciation from current support levels. This projection aligns with measured move calculations based on the depth of the prior bear market and the scale of the basing pattern.
✍🏼Author's word: Like & comment(your thoughts) if you found it helpful.🩷