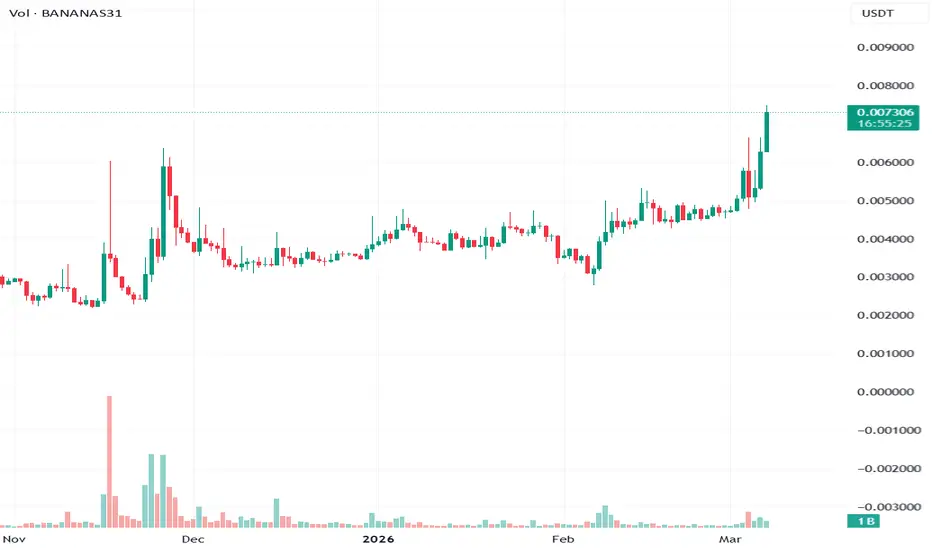
BANANAS31USDT Forming Bullish MomentumBANANAS31USDT is forming a clear bullish momentum pattern, a classic bullish wave signal that often indicates an upcoming breakout. The price has been consolidating within a narrowing range, suggesting that selling pressure is weakening while buyers are beginning to regain control. With consistent v
BANANAS31USDT — Both Squeezes Fired Into a CeilingPrice is at 0.007320 with a slight futures premium at 0.007338. Both spot and futures squeezes fired simultaneously with spot momentum expanding at 347.3%. 41 bullish reads against 17 bearish out of 112, OBV showing inflow, momentum rising. On the surface this looks like a clean breakout setup.
The
BANANAS31 READY FOR BULL RALLYBANANAS31 Technicals look very Bullish here. Traders are likely reacting to the breakout above $0.004, Sustained volume could stabilize prices, while a drop may indicate fading hype! While bullish momentum is evident, but the token’s lack of utility and reliance on hype heightens downside risk if s
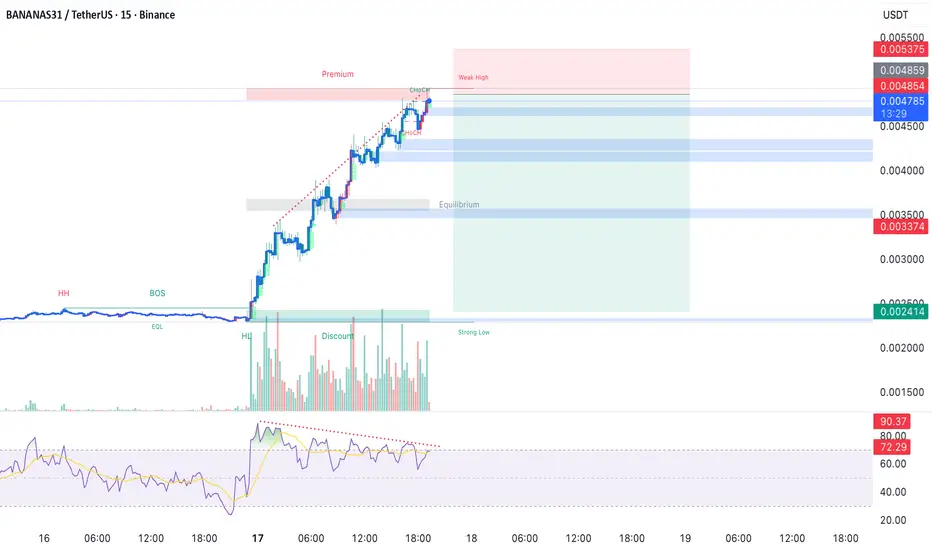
Scalp SHORT – BANANAS31🐻 Scalp SHORT – BANANAS31
BANANAS31 is showing clear overbought conditions with bearish divergence forming simultaneously on the 15m and 1h timeframes — a strong indication that bullish momentum is fading.
Current price action confirms this weakening, suggesting that a downside correction is likely
Scalp SHORT – Bananas31🐻 Scalp SHORT – Bananas31
RSI is extremely overbought across the 15m, 1h, and 4h timeframes, indicating clear exhaustion in upward momentum. The 15m chart shows a strong bearish divergence, confirming weakening strength. Current price action suggests distribution, setting up a high-probability shor
BANANAS31 / USDT : Breaking out from symmetrical triangleBANANAS31/USDT is breaking out of its trendline resistance. If this breakout holds, a short-term rally toward $0.0075 looks likely.
📌 Best strategy: Wait for confirmation through a bullish move or successful retest before entering. Always manage risk and avoid chasing without confirmation.
Bananas31 Usdtstill it taking support with 4 H candle
almost 12 hour its not break this support.
But still it not strong support
its can be down to
support area 0.0062 - 0.0061
its major strong support
or Bullish version
it need to be Break Red Resistance line then
we can go for 0.0075 to 0.0107 targets.
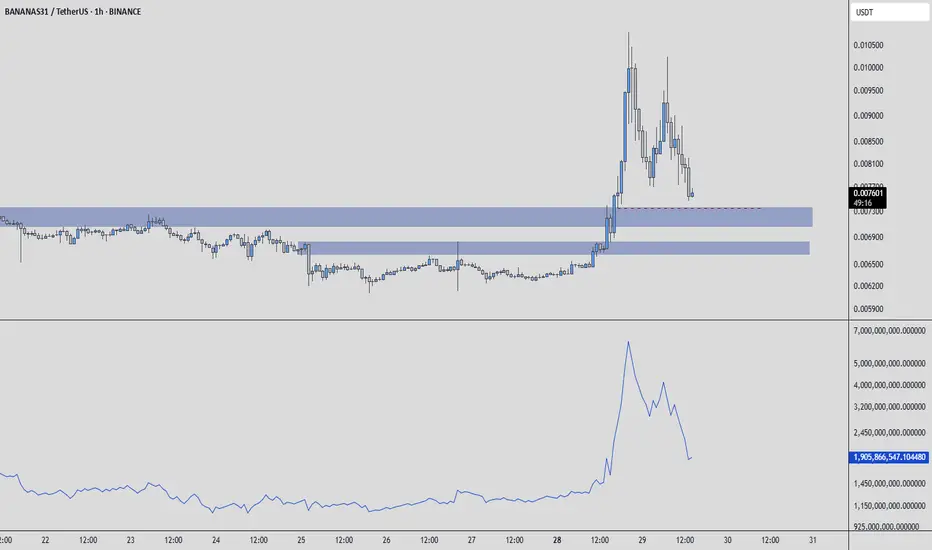
BANANAS31USDT – Smart Entries, Not Chasing Pumps🍌 BANANAS31USDT – Smart Entries, Not Chasing Pumps
Although price has seen a remarkable rise, I believe the uptrend could still have fuel left in the tank.
I’ve marked two blue boxes as potential entry zones. These are not magic reversal levels — they’re simply areas where I’m willing to observe an
See all ideas
Summarizing what the indicators are suggesting.
Oscillators
Neutral
SellBuy
Strong sellStrong buy
Strong sellSellNeutralBuyStrong buy
Oscillators
Neutral
SellBuy
Strong sellStrong buy
Strong sellSellNeutralBuyStrong buy
Summary
Neutral
SellBuy
Strong sellStrong buy
Strong sellSellNeutralBuyStrong buy
Summary
Neutral
SellBuy
Strong sellStrong buy
Strong sellSellNeutralBuyStrong buy
Summary
Neutral
SellBuy
Strong sellStrong buy
Strong sellSellNeutralBuyStrong buy
Moving Averages
Neutral
SellBuy
Strong sellStrong buy
Strong sellSellNeutralBuyStrong buy
Moving Averages
Neutral
SellBuy
Strong sellStrong buy
Strong sellSellNeutralBuyStrong buy
Displays a symbol's price movements over previous years to identify recurring trends.