BANANAS31USDT Forming Bullish MomentumBANANAS31USDT is forming a clear bullish momentum pattern, a classic bullish wave signal that often indicates an upcoming breakout. The price has been consolidating within a narrowing range, suggesting that selling pressure is weakening while buyers are beginning to regain control. With consistent volume confirming accumulation at lower levels, the setup hints at a potential bullish breakout soon. The projected move could lead to an impressive gain of around 90% to 100% once the price breaks above the wedge resistance.
This bullish momentum pattern is typically seen at the end of downtrends or corrective phases, and it represents a potential shift in market sentiment from bearish to bullish. Traders closely watching BANANAS31USDT are noting the strengthening momentum as it nears a breakout zone. The good trading volume adds confidence to this pattern, showing that market participants are positioning early in anticipation of a reversal.
Investorsโ growing interest in BANANAS31USDT reflects rising confidence in the projectโs long-term fundamentals and current technical strength. If the breakout confirms with sustained volume, this could mark the start of a fresh bullish leg. Traders might find this a valuable setup for medium-term gains, especially as the momentum pattern completes and buying pressure accelerates.
โ
Show your support by hitting the like button!
โ
Leaving a comment below! (What is your opinion about this coin?)
Your feedback and engagement keep me inspired to share more insightful market analysis with you!
In-depth trading ideas
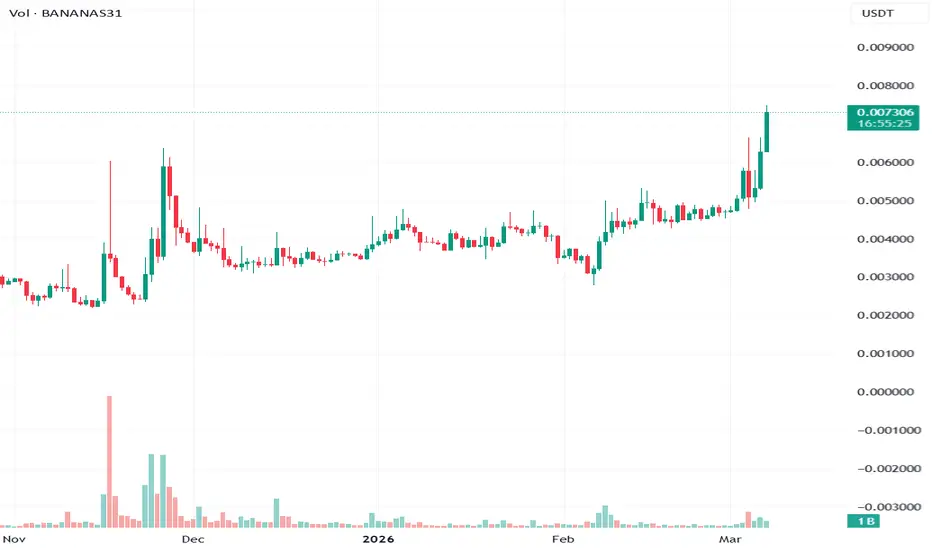
๏ปฟBANANAS31USDT โ Both Squeezes Fired Into a CeilingPrice is at 0.007320 with a slight futures premium at 0.007338. Both spot and futures squeezes fired simultaneously with spot momentum expanding at 347.3%. 41 bullish reads against 17 bearish out of 112, OBV showing inflow, momentum rising. On the surface this looks like a clean breakout setup.
The problem is price percentile at 98.2%. That is the ceiling of the historical range. This asset is not breaking out from a discounted base โ it's squeezing at the top of everything it has ever done. The all-time high was only 110 bars ago at 13.62x. Price has not pulled back meaningfully before this squeeze fired.
The yield is reading 269% APY at 3.2 standard deviations bearish. That level of funding cost is the market pricing in a reversal. Someone is paying heavily to stay long at this level, and that cost typically resolves by price coming down rather than funding normalizing. Leverage percentile at 64.1% is mid-range elevated โ not extreme, but not clean either.
The squeeze and OBV data would be compelling at a 5% price percentile. At 98.2% the same signals carry a completely different risk profile. A squeeze at the ceiling is more likely a blow-off than a sustained breakout.
The bounce probability is 71.6% at 34.5x, but that math is based on structure, not ceiling context. Watch funding cost โ if yield starts compressing toward neutral while price holds, the setup shifts. Until then, the ceiling is the story.
Is That Crypto Pump Real? Data Says No. Here's Why.
Stop Losing Money to Fake Volume. Find Real Moves Now.
Trade the REAL Crypto Volume. Stop Getting Faked Out.
BANANAS31 READY FOR BULL RALLYBANANAS31 Technicals look very Bullish here. Traders are likely reacting to the breakout above $0.004, Sustained volume could stabilize prices, while a drop may indicate fading hype! While bullish momentum is evident, but the tokenโs lack of utility and reliance on hype heightens downside risk if sentiment shifts. So, Use Proper Risk Management
Scalp SHORT โ BANANAS31๐ป Scalp SHORT โ BANANAS31
BANANAS31 is showing clear overbought conditions with bearish divergence forming simultaneously on the 15m and 1h timeframes โ a strong indication that bullish momentum is fading.
Current price action confirms this weakening, suggesting that a downside correction is likely to follow.
Key Signals
15m & 1h: Overbought + strong bearish divergence
Price action turning weak โ early sell pressure building
Momentum loss โ high probability of corrective drop
๐ฏ TP: 0.0236
๐ก๏ธ SL: 0.0377
๐ RR: 1 : 2.31
A technically solid short setup with clear signals of impending downside movement.
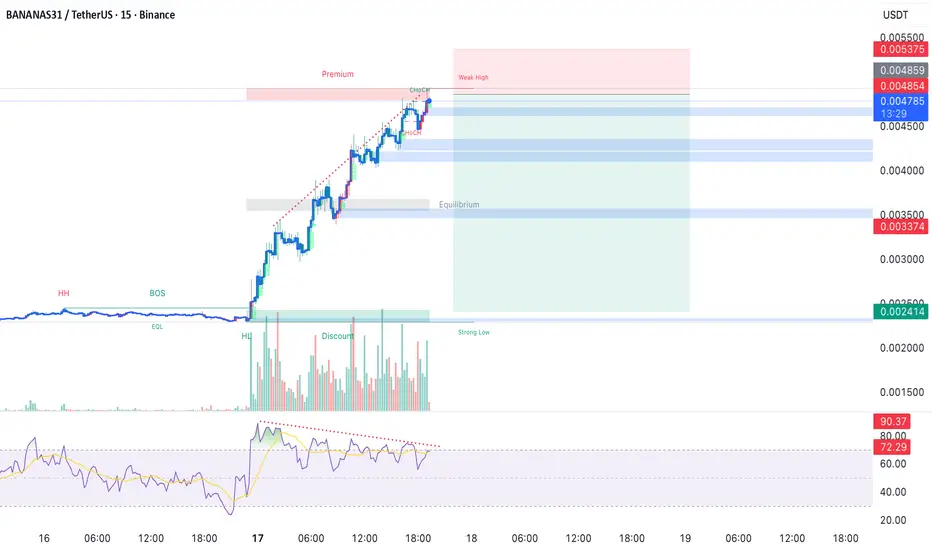
Scalp SHORT โ Bananas31๐ป Scalp SHORT โ Bananas31
RSI is extremely overbought across the 15m, 1h, and 4h timeframes, indicating clear exhaustion in upward momentum. The 15m chart shows a strong bearish divergence, confirming weakening strength. Current price action suggests distribution, setting up a high-probability short-term correction.
๐ฏ TP: 0.002418
๐ SL: 0.005375
๐ RR: 1 : 4.74
A clean short setup: concise, technically driven, and focused on multi-timeframe exhaustion signals.
BANANAS31 / USDT : Breaking out from symmetrical triangleBANANAS31/USDT is breaking out of its trendline resistance. If this breakout holds, a short-term rally toward $0.0075 looks likely.
๐ Best strategy: Wait for confirmation through a bullish move or successful retest before entering. Always manage risk and avoid chasing without confirmation.
Bananas31 Usdtstill it taking support with 4 H candle
almost 12 hour its not break this support.
But still it not strong support
its can be down to
support area 0.0062 - 0.0061
its major strong support
or Bullish version
it need to be Break Red Resistance line then
we can go for 0.0075 to 0.0107 targets.
Spot trade only.
tight stop loss under the
0.0060.
still M bullish till not stop loss.
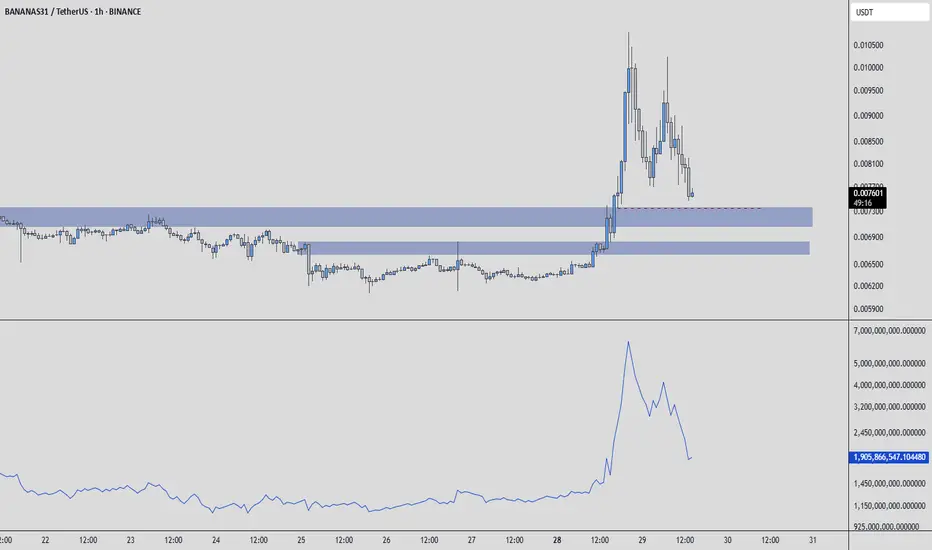
BANANAS31USDT โ Smart Entries, Not Chasing Pumps๐ BANANAS31USDT โ Smart Entries, Not Chasing Pumps
Although price has seen a remarkable rise, I believe the uptrend could still have fuel left in the tank.
Iโve marked two blue boxes as potential entry zones. These are not magic reversal levels โ theyโre simply areas where Iโm willing to observe and possibly take action.
๐ฏ My Strategy
When price reaches a blue box:
I switch to the 5-minute chart
I watch for an upward breakout
I confirm with a rising CDV (Cumulative Delta Volume)
If it all aligns, I spend one bullet โ just one, not the whole magazine. Risk is managed, emotion stays out.
These entries might not flip the market, but they can deliver solid, smart profits if executed with discipline.
โYou donโt win by predicting the market โ you win by preparing for it.โ
As always, donโt chase, donโt rush.
Wait for the plan to meet the price.
โ UmutTrades ๐
๐I keep my charts clean and simple because I believe clarity leads to better decisions.
๐My approach is built on years of experience and a solid track record. I donโt claim to know it all but Iโm confident in my ability to spot high-probability setups.
๐If you would like to learn how to use the heatmap, cumulative volume delta and volume footprint techniques that I use below to determine very accurate demand regions, you can send me a private message. I help anyone who wants it completely free of charge.
๐I have a long list of my proven technique below:
๐ฏ ZENUSDT.P: Patience & Profitability | %230 Reaction from the Sniper Entry
๐ถ DOGEUSDT.P: Next Move
๐จ RENDERUSDT.P: Opportunity of the Month
๐ ETHUSDT.P: Where to Retrace
๐ข BNBUSDT.P: Potential Surge
๐ BTC Dominance: Reaction Zone
๐ WAVESUSDT.P: Demand Zone Potential
๐ฃ UNIUSDT.P: Long-Term Trade
๐ต XRPUSDT.P: Entry Zones
๐ LINKUSDT.P: Follow The River
๐ BTCUSDT.P: Two Key Demand Zones
๐ฉ POLUSDT: Bullish Momentum
๐ PENDLEUSDT.P: Where Opportunity Meets Precision
๐ฅ BTCUSDT.P: Liquidation of Highly Leveraged Longs
๐ SOLUSDT.P: SOL's Dip - Your Opportunity
๐ธ 1000PEPEUSDT.P: Prime Bounce Zone Unlocked
๐ ETHUSDT.P: Set to Explode - Don't Miss This Game Changer
๐ค IQUSDT: Smart Plan
โก๏ธ PONDUSDT: A Trade Not Taken Is Better Than a Losing One
๐ผ STMXUSDT: 2 Buying Areas
๐ข TURBOUSDT: Buy Zones and Buyer Presence
๐ ICPUSDT.P: Massive Upside Potential | Check the Trade Update For Seeing Results
๐ IDEXUSDT: Spot Buy Area | %26 Profit if You Trade with MSB
๐ USUALUSDT: Buyers Are Active + %70 Profit in Total
๐ FORTHUSDT: Sniper Entry +%26 Reaction
๐ณ QKCUSDT: Sniper Entry +%57 Reaction
๐ BTC.D: Retest of Key Area Highly Likely
๐ XNOUSDT %80 Reaction with a Simple Blue Box!
๐ BELUSDT Amazing %120 Reaction!
๐ Simple Red Box, Extraordinary Results
๐ TIAUSDT | Still No BuyersโMaintaining a Bearish Outlook
๐ OGNUSDT | One of Todayโs Highest Volume Gainers โ +32.44%
๐ TRXUSDT - I Do My Thing Again
๐ FLOKIUSDT - +%100 From Blue Box!
๐ SFP/USDT - Perfect Entry %80 Profit!
๐ AAVEUSDT - WE DID IT AGAIN!
I stopped adding to the list because it's kinda tiring to add 5-10 charts in every move but you can check my profile and see that it goes on..
Potential idea for (BANANAS31USDT): Timeframe: 1D idea: potential breakout play :
look for a break above a descending trendline with increasing volume. A successful breakout and daily close above recent resistance could signal a trend reversal.
Entry: On breakout retest confirmation (support at previous resistance)
Target: 10โ20% above breakout zone
Stop-loss: Below recent swing low or trendline break
Indicators to Watch:
MACD Bullish Cross: Indicates momentum shift
RSI near 70: Watch for breakout strength or potential overbought
Make sure to confirm with volume and wider market sentiment before entering.
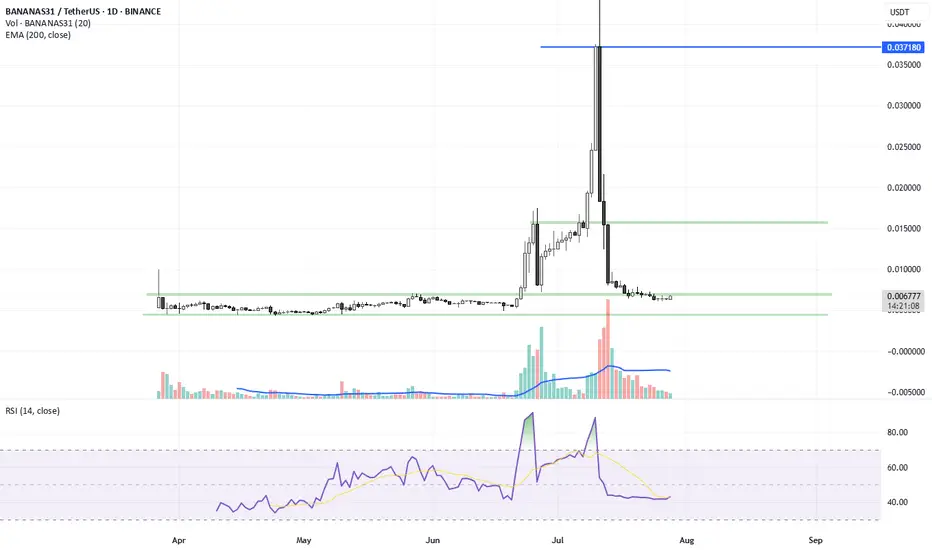
bananas31 usdtBuy 0.0065 - 0.0070
Sell 0.016 100% gain
Sell 0.037 250% gain
it can be 1 or 2 months but it will go to grab upper liquidity
same like it does for bottom liquidity.
Strong project available on binance.
Spot trading only.
for long term holding.
just buy now and set TP and look back after 1 month.
BANANAS31 price predictionbananas31 usdt on extreame orderblock of 4 hours timeframe and also on first order block on lower time i mean 15 minuts and also confirmed hunting liquidity after breakout of pattern on 1 minute time i think it is time to buy so its jurney against BTC and BTC now starting to mive down
BANANAS31USDT Forming Bullish FlagBANANAS31USDT is currently exhibiting a bullish flag pattern on the charts, which is a continuation setup often seen before the next leg up in an uptrend. This pattern reflects a short-term consolidation phase after a sharp upward movement, indicating that buyers are temporarily pausing before potentially pushing the price higher. The presence of good volume within this consolidation is a strong sign of underlying strength and accumulating interest from traders.
As the price coils within the flag structure, the likelihood of a breakout to the upside increases. With bullish momentum building and investor sentiment growing more confident, BANANAS31USDT could be gearing up for a 20% to 30%+ gain in the near term. The breakout zone and confirmation levels will be key to watch as a successful breakout from the flag pattern could trigger significant buy pressure, propelling the price towards the projected targets.
BANANAS31 continues to gain traction among crypto traders due to its rising community engagement and promising project fundamentals. Technical traders are particularly eyeing the current price action for signals of the next breakout. Given the structure and recent market behavior, this coin is positioned well for short- to mid-term growth, especially if broader market conditions remain favorable.
With the bullish flag signaling possible continuation and volume confirming healthy interest, BANANAS31USDT presents an attractive setup for both breakout traders and trend followers looking to capitalize on upcoming momentum.
โ
Show your support by hitting the like button and
โ
Leaving a comment below! (What is You opinion about this Coin)
Your feedback and engagement keep me inspired to share more insightful market analysis with you!
BANANAS31 Forming Bullish FlagBANANAS31USDT is currently displaying a bullish flag pattern, which is typically a continuation formation that appears after a strong upward movement. This pattern suggests that the market is temporarily consolidating before potentially continuing its bullish trend. The price action has pulled back slightly in a controlled and descending manner, forming a flag structure after a steep rise, indicating that bulls are taking a breather before possibly driving prices higher once again.
Volume remains healthy and consistent, supporting the legitimacy of the pattern. A breakout above the upper resistance of the flag would likely attract additional buyers and could trigger a new wave of momentum. This setup is particularly attractive to technical traders looking for breakout opportunities with clear entry and target zones. Given the current setup, a projected gain of 20% to 30% is reasonable and aligns well with recent resistance levels visible on the higher timeframes.
In addition to the pattern itself, market sentiment around BANANAS31USDT appears to be improving. Social engagement, increased interest from retail traders, and a rise in transaction activity suggest that this project is gaining attention. Short-term traders may find this an ideal opportunity to capitalize on a relatively low-risk/high-reward trade setup, especially if the broader crypto market continues its upward trajectory.
BANANAS31USDT is worth keeping on your radar if you are tracking breakout-ready coins. With solid technical structure and growing investor interest, this coin has the potential to deliver moderate but consistent gains in the coming sessions. Watching for a confirmed breakout with strong volume could be the key to capitalizing on this move.
โ
Show your support by hitting the like button and
โ
Leaving a comment below! (What is You opinion about this Coin)
Your feedback and engagement keep me inspired to share more insightful market analysis with you!
BANANAS31/USDTKey Level Zone: 0.006030 - 0.006180
HMT v8.1 detected. The setup looks promising, supported by a previous upward/downward trend with increasing volume and momentum, presenting an excellent reward-to-risk opportunity.
HMT (High Momentum Trending):
HMT is based on trend, momentum, volume, and market structure across multiple timeframes. It highlights setups with strong potential for upward movement and higher rewards.
Whenever I spot a signal for my own trading, Iโll share it. Please note that conducting a comprehensive analysis on a single timeframe chart can be quite challenging and sometimes confusing. I appreciate your understanding of the effort involved.
Important Note :
Role of Key Levels:
- These zones are critical for analyzing price trends. If the key level zone holds, the price may continue trending in the expected direction. However, momentum may increase or decrease based on subsequent patterns.
- Breakouts: If the key level zone breaks, it signals a stop-out. For reversal traders, this presents an opportunity to consider switching direction, as the price often retests these zones, which may act as strong support-turned-resistance (or vice versa).
My Trading Rules
Risk Management
- Maximum risk per trade: 2.5%.
- Leverage: 5x.
Exit Strategy
Profit-Taking:
- Sell at least 70% on the 3rd wave up (LTF Wave 5).
- Typically, sell 50% during a high-volume spike.
- Adjust stop-loss to breakeven once the trade achieves a 1.5:1 reward-to-risk ratio.
- If the market shows signs of losing momentum or divergence, ill will exit at breakeven.
The market is highly dynamic and constantly changing. HMT signals and target profit (TP) levels are based on the current price and movement, but market conditions can shift instantly, so it is crucial to remain adaptable and follow the market's movement.
If you find this signal/analysis meaningful, kindly like and share it.
Thank you for your support~
Sharing this with love!
HMT v2.0:
- Major update to the Momentum indicator
- Reduced false signals from inaccurate momentum detection
- New screener with improved accuracy and fewer signals
HMT v3.0:
- Added liquidity factor to enhance trend continuation
- Improved potential for momentum-based plays
- Increased winning probability by reducing entries during peaks
HMT v3.1:
- Enhanced entry confirmation for improved reward-to-risk ratios
HMT v4.0:
- Incorporated buying and selling pressure in lower timeframes to enhance the probability of trending moves while optimizing entry timing and scaling
HMT v4.1:
- Enhanced take-profit (TP) target by incorporating market structure analysis
HMT v5 :
Date: 23/01/2025
- Refined wave analysis for trending conditions
- Incorporated lower timeframe (LTF) momentum to strengthen trend reliability
- Re-aligned and re-balanced entry conditions for improved accuracy
HMT v6 :
Date : 15/02/2025
- Integrated strong accumulation activity into in-depth wave analysis
HMT v7 :
Date : 20/03/2025
- Refined wave analysis along with accumulation and market sentiment
HMT v8 :
Date : 16/04/2025
- Fully restructured strategy logic
HMT v8.1 :
Date : 18/04/2025
- Refined Take Profit (TP) logic to be more conservative for improved win consistency