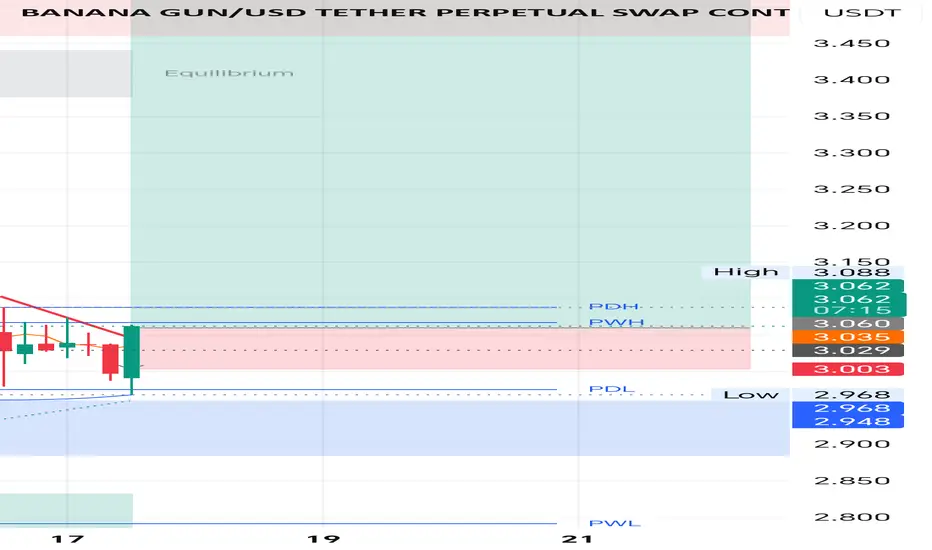
BANANAUSDT Forming Bullish MomentumBANANAUSDT is forming a clear bullish momentum pattern, a classic bullish wave signal that often indicates an upcoming breakout. The price has been consolidating within a narrowing range, suggesting that selling pressure is gradually weakening while buyers are beginning to regain control. With consi
BANANA/USDT — Descending Channel: Massive Breakout Soon?The BANANA/USDT chart on the 2D timeframe is currently still moving inside a very clear Descending Channel pattern, marked by the red diagonal resistance 🔴 as the upper boundary and the yellow diagonal support 🟡 as the lower boundary. This structure indicates that the market is still in a medium-ter
#BANANA #BANANA is currently consolidating 🤝 after a breakout from a falling wedge pattern. The price action indicates a potential continuation of the upward trend 🚀 as buyers step in. The next target is indicated at the 3.58 level 🎯 suggesting a bullish outlook.
Pay attention to chart patterns; they offer
BANANA GUN – Daily UpdateFrom the weekly perspective, price is still in a broader bearish structure.
The recent move is only a reaction after a prolonged downtrend — not a confirmed reversal yet.
On the Daily, price has broken the descending trendline, which is a first sign of potential change.
However, at this stage there
BANANA USDT LONG SIGNAL---
📢 Official Trade Signal – BANANA/USDT
📈 Position Type: LONG
💰 Entry Price: 7.340
🛑 Stop-Loss: 6.690
📊 Timeframe: 15m
⚖️ Risk per Trade: 0.650
⚙️ Suggested Leverage: 3×
---
🎯 Take-Profit Targets (Partial Exits):
• TP1: 8.135
• TP2: 9.000
• TP3: 10.000
• TP4: 11.219
• TP5: 12.810
• TP6: 14.890
BANANAUSDT Forming Falling WedgeBANANAUSDT is forming a clear falling wedge pattern, a classic bullish reversal signal that often indicates an upcoming breakout. The price has been consolidating within a narrowing range, suggesting that selling pressure is weakening while buyers are beginning to regain control. With consistent vol
BANANA Simple Weekly AnalysisBANANA is retesting a key weekly support zone that previously acted as an R/S flip, making this an important area for buyers to defend. The overall trend remains bearish, and structure only improves if price can reclaim the mid-range area and start forming higher highs. Until then, the previous week
See all ideas
Summarizing what the indicators are suggesting.
Oscillators
Neutral
SellBuy
Strong sellStrong buy
Strong sellSellNeutralBuyStrong buy
Oscillators
Neutral
SellBuy
Strong sellStrong buy
Strong sellSellNeutralBuyStrong buy
Summary
Neutral
SellBuy
Strong sellStrong buy
Strong sellSellNeutralBuyStrong buy
Summary
Neutral
SellBuy
Strong sellStrong buy
Strong sellSellNeutralBuyStrong buy
Summary
Neutral
SellBuy
Strong sellStrong buy
Strong sellSellNeutralBuyStrong buy
Moving Averages
Neutral
SellBuy
Strong sellStrong buy
Strong sellSellNeutralBuyStrong buy
Moving Averages
Neutral
SellBuy
Strong sellStrong buy
Strong sellSellNeutralBuyStrong buy
Displays a symbol's price movements over previous years to identify recurring trends.