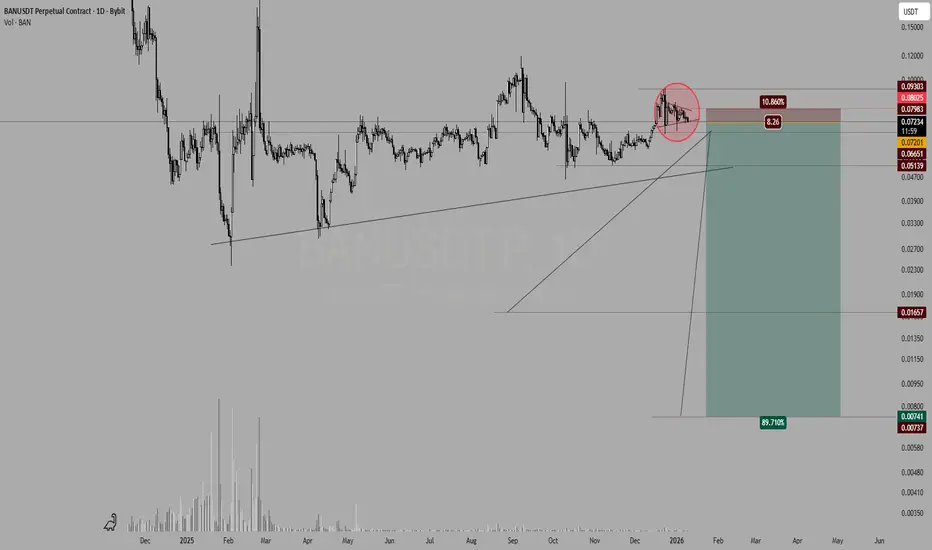
BANUSDT - Deep BullBANUSDT is trading at 0.08765 spot against 0.08783 futures with 17.21M volume. The ratio tells the real story — 566M futures against 86.92M spot is a 6.5x imbalance, and dollar flow confirms it at 7.62M spot versus 49.61M futures. Spot:Fut reads Normal on the surface but futures Z is running at 1.02
$BAN 3D CHART UPDATE
📌 MIL:BAN Technical Analysis: The market is currently maintaining a steady uptrend structure on the higher timeframe. On the 3-day chart, the price has been strictly respecting a rising trendline, having successfully touched and bounced from it four times already.
📌 Key Zone to Watch:
Trendlin
BAN Looks Bullish (1D)After 175 days, the price has managed to break out of an important level. Now, during the pullback, we can look for buying opportunities on BAN around the green zone.
The targets are marked on the chart.
Keep in mind that this is a low-volume altcoin, so manage your risk carefully and enter the po
BANUSDT CHART ANALYSİSHOW DO CRYPTO WALLETS WORK?
When someone sends Bitcoin, Ethereum, Dogecoin, or any other type
of digital currency to your crypto wallet, you are not actually
transferring any coins. What they are doing is signing off ownership
thereof to your wallet’s address. That is to say, they are confirming
t
BAN/USDT +100% BAN has been consolidating in a tight range for the past 100 days, building a strong base. Recent price action shows buyers stepping in with higher highs and higher lows, signaling the early stages of a bullish structure.
A breakout continuation from this accumulation range could first target the p
BAN Analysis (8H) This coin is somewhat risky and highly volatile, so only allocate a small amount of capital.
From the point where we placed the green arrow on the chart, a bullish phase seems to have formed on the BAN chart. This phase appears to be a diametric pattern, and we are currently in its final wave, wav
BAN Update – Inverse Bullish Head & Shoulders Forming!📈 BAN Update – Inverse Bullish Head & Shoulders Forming! 🚀
👀 BAN appears to be forming an Inverse Bullish Head and Shoulders pattern! This could signal a strong upward move if the blue resistance line (neckline) breaks! 🐂
⚠️ Watching for a clear breakout above the blue resistance line. If confirme
See all ideas
Summarizing what the indicators are suggesting.
Oscillators
Neutral
SellBuy
Strong sellStrong buy
Strong sellSellNeutralBuyStrong buy
Oscillators
Neutral
SellBuy
Strong sellStrong buy
Strong sellSellNeutralBuyStrong buy
Summary
Neutral
SellBuy
Strong sellStrong buy
Strong sellSellNeutralBuyStrong buy
Summary
Neutral
SellBuy
Strong sellStrong buy
Strong sellSellNeutralBuyStrong buy
Summary
Neutral
SellBuy
Strong sellStrong buy
Strong sellSellNeutralBuyStrong buy
Moving Averages
Neutral
SellBuy
Strong sellStrong buy
Strong sellSellNeutralBuyStrong buy
Moving Averages
Neutral
SellBuy
Strong sellStrong buy
Strong sellSellNeutralBuyStrong buy
Displays a symbol's price movements over previous years to identify recurring trends.