BANUSDT - Deep BullBANUSDT is trading at 0.08765 spot against 0.08783 futures with 17.21M volume. The ratio tells the real story — 566M futures against 86.92M spot is a 6.5x imbalance, and dollar flow confirms it at 7.62M spot versus 49.61M futures. Spot:Fut reads Normal on the surface but futures Z is running at 1.02 Elevated while spot Z sits at -0.01 Steady. This is a futures-led move with spot participation lagging.
42 green to 10 red out of 112 puts bull bias at 63.48% at 4.48x with clarity at only 46.43%. EMA is clean at 6 green zero red, candle structure perfect at 14 green zero red, engulfing at 6 green zero red. But DD/SS reads 2 demand to 4 supply — that is a supply-heavy structure inside what looks like a bull setup. C>T is narrowing at 8 green 6 red, Ichi TK at 8 green 4 red. Squeeze is in HIGH compression for 8 bars, momentum pointing bull, bandwidth at 49.17%. Bull Cascade is on bar 5 with a 57.3% five-bar move. The critical divergence flag: Sqz Div reads Futures Only Squeeze — the futures market is building compression but spot is not. That is a speculative signal, not a structural one.
Spot Z at -0.01 steady, futures Z at 1.02 elevated, combined at 0.90 active. The spot Z 5-bar recovery is rising from -0.41 to 0.4 which is constructive but spot is still flat in absolute terms. MeanZ is at 1.45σ Rising — price is stretching above mean on futures momentum alone. Bull:Bear Z at 1.79 to -0.38 reads Bull Lean, which is the one genuinely encouraging volume signal.
Leverage at 6.53x is rising and sitting at 61.8% percentile — Mid. This is the structural problem. At-max leverage was 10.55x some 431 bars ago, at-min was 0.015x 514 bars back. Price is at 35.3% of its full historical range, Lower but not Floor. Neither leverage nor price percentile is in the washed-out accumulation zone. Leverage rising into a cascade is the opposite of the clean flush-to-floor setups that carry with conviction.
OBV Z at -1.06 with a 5-bar recovery from -1.73 to 0.67 reads Strong Up — the recovery is real and meaningful. But OBV Z is still firmly negative in absolute terms, meaning cumulative selling pressure has not been fully absorbed. No whale prints, liquidations clear, OBV divergence reads Normal. The recovery is encouraging but OBV needs to cross zero before this can be called volume-confirmed.
The honest read: BANUSDT is showing the pattern of a futures-engineered squeeze with candles and EMA in agreement but the foundations are soft. Futures only squeeze divergence, leverage rising not falling, spot Z flatlined while futures runs hot, OBV still in negative territory despite recovery — these are speculative breakout conditions, not structural accumulation. The 118% bounce target at 13.4x is the measured move if it fires cleanly, but without spot volume stepping in to validate, this has the profile of a squeeze-and-fade rather than a sustained trend. Watch for spot Z to confirm above 0.3 with OBV Z turning positive before treating this as a real entry.
Is That Crypto Pump Real? Data Says No. Here's Why.
Stop Losing Money to Fake Volume. Find Real Moves Now.
Trade the REAL Crypto Volume. Stop Getting Faked Out.
In-depth trading ideas
$BAN 3D CHART UPDATE
📌 MIL:BAN Technical Analysis: The market is currently maintaining a steady uptrend structure on the higher timeframe. On the 3-day chart, the price has been strictly respecting a rising trendline, having successfully touched and bounced from it four times already.
📌 Key Zone to Watch:
Trendline Support: MIL:BAN is once again approaching this critical diagonal support.
Green Support Zone: This area aligns with the trendline, creating a high-confluence buy zone.
The Strategy: For the bullish momentum to continue, the price must touch and hold this green support zone.
📌 Bullish Outlook:
The Bounce: If buyers defend this floor for the fifth time, it confirms the trend's strength and sets the stage for a massive move up.
Targets: A successful hold here could drive the price toward its previous local highs and potentially challenge the All-Time High (ATH) resistance levels 🔥
BAN Looks Bullish (1D)After 175 days, the price has managed to break out of an important level. Now, during the pullback, we can look for buying opportunities on BAN around the green zone.
The targets are marked on the chart.
Keep in mind that this is a low-volume altcoin, so manage your risk carefully and enter the position with a small size.
A daily candle closing below the invalidation level would nullify this analysis.
For risk management, please don't forget stop loss and capital management
When we reach the first target, save some profit and then change the stop to entry
Comment if you have any questions
Thank You
BANUSDT CHART ANALYSİSHOW DO CRYPTO WALLETS WORK?
When someone sends Bitcoin, Ethereum, Dogecoin, or any other type
of digital currency to your crypto wallet, you are not actually
transferring any coins. What they are doing is signing off ownership
thereof to your wallet’s address. That is to say, they are confirming
that the crypto on the blockchain no longer belongs to their address but
yours. Two digital codes are necessary for this process: a public key
and a private key.
A public key is a string of letters and numbers automatically generated
by the crypto wallet provider. For example, a public key could look
like this: B1Robo539i7L822can5oY5xgV614.
A private key is another string of numbers and letters but one that only
the owner of the wallet should know.
BAN/USDT +100% BAN has been consolidating in a tight range for the past 100 days, building a strong base. Recent price action shows buyers stepping in with higher highs and higher lows, signaling the early stages of a bullish structure.
A breakout continuation from this accumulation range could first target the previous local high at $0.17, with extended upside potential toward the $0.22 – $0.25 zone, which marks a key resistance cluster and profit-taking area.
BAN Analysis (8H) This coin is somewhat risky and highly volatile, so only allocate a small amount of capital.
From the point where we placed the green arrow on the chart, a bullish phase seems to have formed on the BAN chart. This phase appears to be a diametric pattern, and we are currently in its final wave, wave G.
If the price reaches the red zone, we can look for sell/short positions.
A daily candle closing above the invalidation level will invalidate this analysis.
For risk management, please don't forget stop loss and capital management
Comment if you have any questions
Thank You
BAN Update – Inverse Bullish Head & Shoulders Forming!📈 BAN Update – Inverse Bullish Head & Shoulders Forming! 🚀
👀 BAN appears to be forming an Inverse Bullish Head and Shoulders pattern! This could signal a strong upward move if the blue resistance line (neckline) breaks! 🐂
⚠️ Watching for a clear breakout above the blue resistance line. If confirmed...
🎯 Target: Green line levels
BANUSDT CHART ANALYSİS - EDUCATIONAL POSTThe NFT Concept
You may already know that each unit of value in a blockchain is called a token. In an open blockchain, all tokens are equal and interchangeable. For example, one bitcoin can be easily replaced with another, and nothing will change.
Non-fungible tokens are a game-changer, which work differently. An NFT is a digital asset that cannot be replaced with another token without changing the value and basis of the object.
Like cryptocurrency, NFTs are created on a blockchain, which acts as a database to record all transactions. The blockchain guarantees the uniqueness, safety, and anonymity of non-fungible tokens. Thanks to this system, any user can verify the originality and transparency of the history of a particular NFT through the blockchain.
When you buy an NFT token, you are obtaining a certificate for a digital or real object. However, the work itself doesn’t move anywhere. You only use its digitized file or a certificate of ownership. Once created or purchased, the token sits in perpetual storage. This certificate is just lines of code that confirm it is the token owner who has the original copy of the object.
An NFT token can be compared to a painting, which may belong to a gallery, museum, or individual, but the audience can see it in a catalog or exhibition.
NFT tokens are sold in online marketplaces that operate like Amazon. The creators put them on marketplaces and wait for bids from buyers.
An NFT token can be created by you or by anyone for that matter. To do this, you need to take a digital object (picture, music, photo, etc.), register in a particular marketplace on a platform such as Rarible or OpenSea, and upload the object with a description and price. You will have to pay a fee for creating a blockchain entry on many platforms. However, the costs pay off in most cases, as NFTs are #1 in the crypto world today.
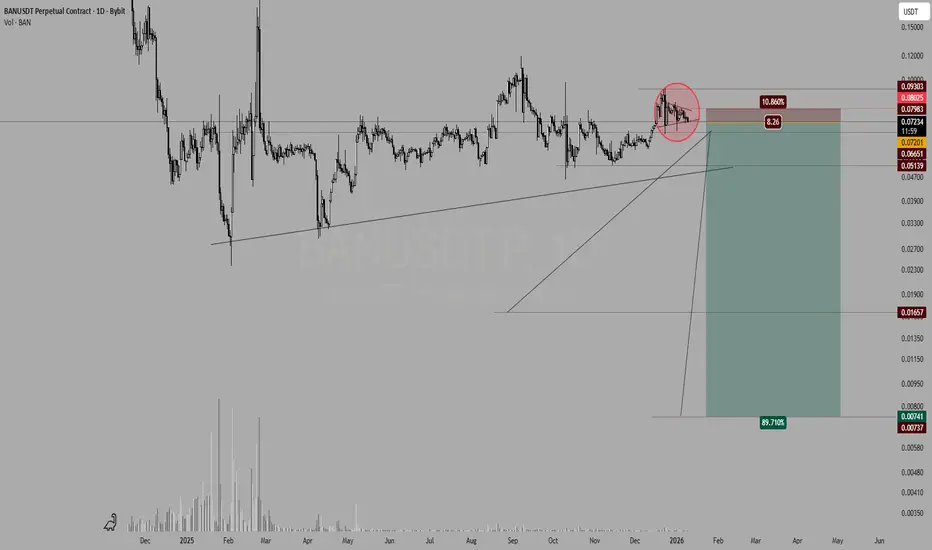
Bearish opportunity in BAN1. We have continuation CISD in H1
2. We have price showing its hand by the strong bearish drop >40% therefore longs are ow probability
3. We have price having draws on the H1 and major key levels up to 0.03
Alternative scenario:
As BTC has hit key level 85,000 though (not strong ), an impulsive pullback in BTC can mean a pullback in this pair as well
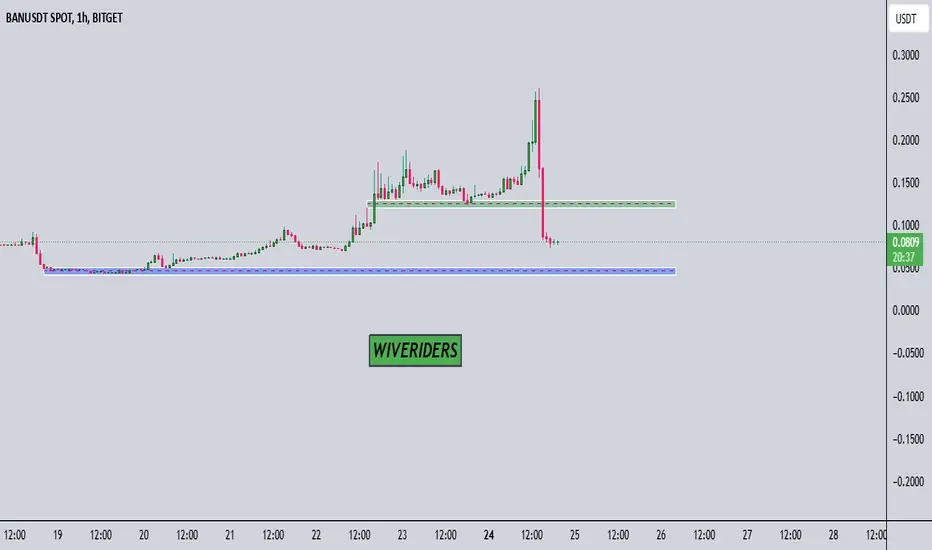
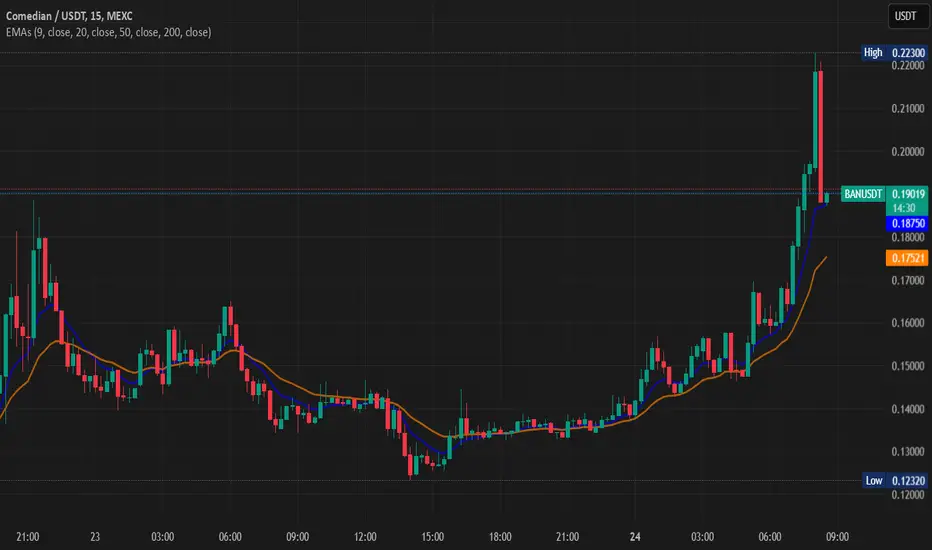
A big decline on BAN/USDT upcomingWhile every single indicator shows that BAN/USDT shows strong buy , our team diagree. Let's find out why..
Ban in the past 24hrs had a big pump of 120% , clear sign of manipulation..
Buyers started coming in and the coin will liquidate all of them..
A drop of 33% is expected from this coin..
Lets see if we are right on this one..
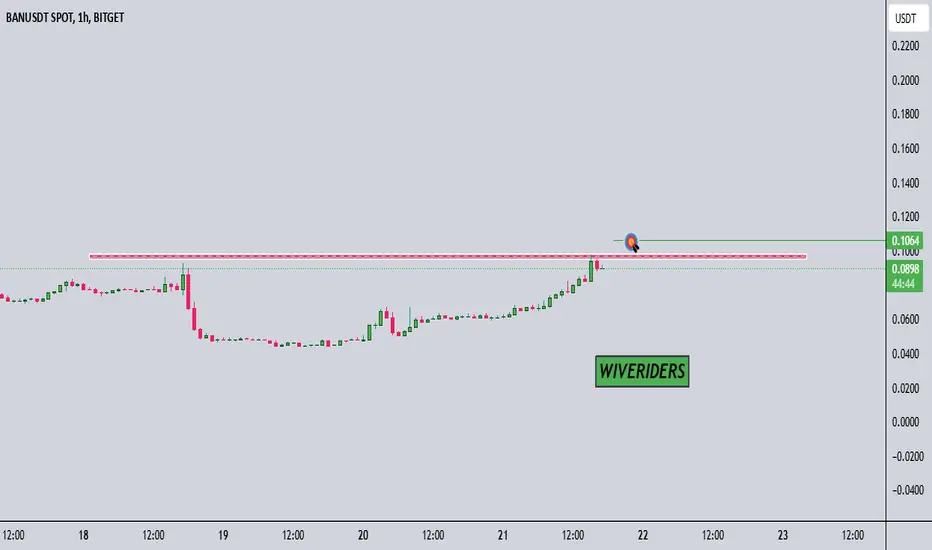
BANBAN broke the downtrend and the resistance area market with the red line, and in 1d tf it looks like the indicators is showing that it is in 0 line of the macd.
if its trend will not stop then it could get 0.12 during the weekend.
it is time to see market development, i would like to see btc stop here for some time and maybe alts to come in the play.
BAN/USDTKey Level Zone: 0.0550 - 0.0570
HMT v5 detected. The setup looks promising, supported by a previous upward/downward trend with increasing volume and momentum, presenting an excellent reward-to-risk opportunity.
HMT (High Momentum Trending):
HMT is based on trend, momentum, volume, and market structure across multiple timeframes. It highlights setups with strong potential for upward movement and higher rewards.
Whenever I spot a signal for my own trading, I’ll share it. Please note that conducting a comprehensive analysis on a single timeframe chart can be quite challenging and sometimes confusing. I appreciate your understanding of the effort involved.
Important Note :
Role of Key Levels:
- These zones are critical for analyzing price trends. If the key level zone holds, the price may continue trending in the expected direction. However, momentum may increase or decrease based on subsequent patterns.
- Breakouts: If the key level zone breaks, it signals a stop-out. For reversal traders, this presents an opportunity to consider switching direction, as the price often retests these zones, which may act as strong support-turned-resistance (or vice versa).
My Trading Rules
Risk Management
- Maximum risk per trade: 2.5%.
- Leverage: 5x.
Exit Strategy
Profit-Taking:
- Sell at least 70% on the 3rd wave up (LTF Wave 5).
- Typically, sell 50% during a high-volume spike.
- Adjust stop-loss to breakeven once the trade achieves a 1.5:1 reward-to-risk ratio.
- If the market shows signs of losing momentum or divergence, ill will exit at breakeven.
The market is highly dynamic and constantly changing. HMT signals and target profit (TP) levels are based on the current price and movement, but market conditions can shift instantly, so it is crucial to remain adaptable and follow the market's movement.
If you find this signal/analysis meaningful, kindly like and share it.
Thank you for your support~
Sharing this with love!
HMT v2.0:
- Major update to the Momentum indicator
- Reduced false signals from inaccurate momentum detection
- New screener with improved accuracy and fewer signals
HMT v3.0:
- Added liquidity factor to enhance trend continuation
- Improved potential for momentum-based plays
- Increased winning probability by reducing entries during peaks
HMT v3.1:
- Enhanced entry confirmation for improved reward-to-risk ratios
HMT v4.0:
- Incorporated buying and selling pressure in lower timeframes to enhance the probability of trending moves while optimizing entry timing and scaling
HMT v4.1:
- Enhanced take-profit (TP) target by incorporating market structure analysis
HMT v5 :
Date: 23/01/2025
- Refined wave analysis for trending conditions
- Incorporated lower timeframe (LTF) momentum to strengthen trend reliability
- Re-aligned and re-balanced entry conditions for improved accuracy
Is the BANUSDT Market on the Verge of a Breakout or a Breakdown?The cryptocurrency market thrives on unpredictability, and BANUSDT is currently testing traders' resolve. After retreating -91% from its historic high of $0.421 (November 2024), the token hovers near its all-time low at $0.03678. Such levels are often a breeding ground for high volatility and significant price movements. Will the market roar back, or will it sink further into the abyss?
Presently trading at $0.03777, BANUSDT appears oversold with a daily RSI14 of 28.99, hinting at potential upward momentum. However, its moving averages, notably the MA50 at $0.05556 and MA200 at $0.06184, cast shadows of resistance over immediate bullish aspirations. Additionally, recent VSA Buy Patterns suggest buying pressure, but the path upward remains fraught with resistance levels near $0.07753.
The critical question: Is this the time to buy the dip, or are we teetering on the brink of a deeper fall? Investors and traders, are you prepared for what’s next? Today marks a pivotal moment in BANUSDT’s journey—are you watching closely?
BANUSDT Roadmap: Patterns in Action
Navigating the rollercoaster of BANUSDT requires dissecting its pattern history. Here’s a clear roadmap of recent key events, filtering out the noise to highlight only the patterns that hit their mark. Ready to see how this market moves?
January 25, 2025 – VSA Buy Pattern Extra 2nd
This pattern signaled a bullish sentiment with its main direction as "Buy." The price opened at $0.05252, reaching a high of $0.05253, but eventually closed lower at $0.04747. The pattern hinted at a bullish breakout.
Confirmation: The next pattern aligned with this sentiment. The price attempted to rally further before settling lower, confirming the bullish drive was correct but short-lived.
January 25, 2025 – Buy Volumes Take Over
Despite its "Sell" direction, the market momentum showed limited downside. Opening at $0.06483, it quickly slid to $0.05598. This mismatch between prediction and actual price movement suggests either a false signal or strong counterforces.
Skipped: As the Sell failed to gain traction, this pattern is excluded for clarity.
January 26, 2025 – VSA Buy Pattern Extra 1st
Backed by bullish sentiment, this pattern triggered fresh optimism. Opening at $0.03752 and closing near the same level at $0.0374, it maintained a narrow range but supported further upward moves.
Confirmation: The next pattern reaffirmed this sentiment, demonstrating a steady rise as BANUSDT tested higher levels.
Key Takeaways
Successful patterns are those where the main direction aligned with subsequent price actions.
Neutral or false signals are filtered out to ensure actionable insights for traders.
January patterns show BANUSDT attempting to form a bullish base, but caution remains essential due to intermittent weak signals.
Looking Ahead
Investors should track these active support zones and stay alert for patterns aligning with broader momentum shifts. BANUSDT may yet surprise with its next move—are you ready to ride the wave?
Technical & Price Action Analysis: Key Levels to Watch
In trading, it’s all about the levels. Here’s your cheat sheet for BANUSDT's most critical zones. Whether you're scalping or holding, these levels are your lifeline to navigating price action like a pro.
Support Levels
0.03678 – This is the current all-time low, a psychological barrier where buyers previously stepped in. If this fails, expect it to flip into resistance.
0.05556 (MA50) – A dynamic support often acting as a magnet for price action. Break below, and it could create bearish momentum.
Resistance Levels
0.07753 – A key line in the sand. Sellers dominated here before; bulls need to claim this to change the narrative.
0.06184 (MA200) – A formidable level tied to institutional trading zones. Watch for fakeouts around this level.
Powerful Support Levels
0.0921 – The "big boss" support level. If price manages to push higher, this level becomes a safety net on the way down. However, if breached, this will likely become a ceiling for future price recovery.
Powerful Resistance Levels
None active currently – If bulls can reclaim some ground, look for future resistance formations tied to higher price action zones.
Note for Traders
When levels fail to hold, they don’t disappear—they flip roles. Support becomes resistance, resistance becomes a brick wall.
Play it smart: wait for confirmations before entering, and don’t get trapped in fakeouts. These levels are where price action loves to fake moves to lure traders in.
Watch these zones like a hawk and let the price action guide your next moves. It's all about staying sharp and adapting to what the chart is telling you!
Trading Strategies Based on Fibonacci Rays
The proprietary concept of Fibonacci Rays gives traders an edge in navigating dynamic market movements. Using these geometrically precise tools, we identify scenarios that balance flexibility and focus. Here's how we can apply this method to BANUSDT.
Concept of Rays
The Fibonacci Rays are designed from the origin of a movement, based on mathematical and geometric principles. They outline dynamic channels, predicting likely zones for price interaction. Here's the core idea:
When price touches a ray, two outcomes are probable: a reversal or a continuation.
Dynamic factors, such as Moving Averages (MA50, MA200), enhance the predictive accuracy of these rays.
Instead of aiming for precise levels, we analyze the probabilities of price movements within defined ranges.
Dynamic Factors: Moving Averages & Rays
MA50 (current: $0.05556) and MA200 (current: $0.06184) act as additional dynamic support and resistance zones. Interaction with these averages often confirms ray predictions.
Using VSA rays, price tends to move from one ray to the next, forming clear trading targets.
Scenarios
Optimistic Scenario
Price interacts with the ascending ray near $0.03678 (current support). A bounce signals a potential move toward the first ray at $0.05556, confirmed by MA50.
If momentum sustains, the next target aligns with the ray at $0.06184 (MA200).
Pessimistic Scenario
Price breaks below the $0.03678 ray, testing the next descending ray at $0.030 (hypothetical). In this case, MA50 flips to resistance, and bears gain control.
If MA200 is breached, expect further declines, with price navigating between descending rays.
Suggested Trades
Trade 1: Long from $0.03678 with targets at $0.05556 (MA50) and $0.06184 (MA200). Use confirmation from ray interaction before entering.
Trade 2: Short if price breaks $0.03678, targeting the descending ray at $0.030. Watch for bearish confirmation with MA50 acting as resistance.
Trade 3: Long breakout above $0.06184, targeting higher ascending rays. This trade aligns with a potential trend shift and broader bullish momentum.
Key Takeaway
The Fibonacci Rays allow traders to spot high-probability opportunities by combining dynamic ray interaction with Moving Averages. These tools offer clarity in uncertain markets, ensuring trades are aligned with structural momentum. Whether you're an optimist or a realist, there's a setup for every type of trader!
Let’s Connect and Trade Smarter Together
Trading isn’t just about levels; it’s about collaboration and constant learning. If you have questions, ideas, or just want to discuss this analysis, drop your thoughts right here in the comments. I’d love to hear from you and dive deeper into any topics you find valuable.
If you found this idea useful, don’t forget to hit Boost and save it. That way, you can revisit it later and track how the price moves along my markings—it’s the perfect way to refine your trading skills and spot opportunities.
By the way, all the rays and levels you see here? My custom indicator does the heavy lifting, drawing them automatically based on Fibonacci principles. It’s a private tool, but if you’re interested, feel free to reach out via direct messages—we’ll discuss how to make it work for you.
Need a custom analysis for your favorite asset? I’ve got you covered. Whether it’s a free idea shared with the community or a private, tailored breakdown for your strategy, we can work something out. Just leave a comment with the asset you want me to analyze, and I’ll do my best to help!
Rays work universally across all assets—crypto, stocks, commodities, you name it. If you’d like a personal markup for a specific chart, let me know. And remember, the more engagement this post gets, the more ideas I can share here for everyone.
Lastly, make sure to follow me here on TradingView to stay updated on all my future insights and strategies. Let’s build a community of smarter, sharper traders together! 🚀