Lombard BARD pump price analysisWhen is the absolute best time to pump a coin? 🤔
#Lombard ’s MM (market maker) apparently decided that today—with #NVDA shares sliding and dragging down US markets, AI, and the entire crypto space—was the perfect day to pump #BARD.
Whether that's a smart play or not, who knows 🤷♂️, but we've got a +70% surge today, and that's a fact.
Up ahead is a trendline around $0.145, and that's where things get really interesting:
• If we consolidate above it, there’s a real shot at pushing the #BARDUS
Lombard/USDT
No trades
No trades
In-depth trading ideas
BARD/USDT: Strong Bullish Momentum – Can Buyers Break $0.1400?BARD/USDT is showing strong bullish momentum, currently up approximately 66%. Buyers have pushed price higher, and the market is now consolidating around $0.1380.
Key levels to watch:
* Resistance: $0.1400
* Support: $0.1350
* Next support: $0.1300
A strong breakout above $0.1400 with increased volume could signal further upside. However, rejection at resistance may lead to a short-term pullback.
I’ll be watching volume and price action closely before considering the next move. Trade careful
BARD - we have a signal !2h signal - could be a strong reversal happening soon
BARD, it is the native token of the Lombard Protocol, a Bitcoin infrastructure and liquid staking project. Lombard's main product is LBTC, a liquid, yield-bearing Bitcoin token backed 1:1 by BTC and integrated with Babylon staking. BARD serves as the ecosystem token for governance, security staking, incentives, and ecosystem growth.
Key points:
LBTC = tokenized yield-bearing Bitcoin backed by BTC.
BARD = Lombard protocol token, not backe
BARD/USDT (1D) — Major Historical Demand Zone & Reversal SetupLooking at the daily timeframe for BARD/USDT, price action has experienced a significant correction and is now testing a major historical green demand zone around the 0.10 to 0.11 support region.
Technical Breakdown:
- Key Support / Accumulation Zone: The 0.10 – 0.11 support block is acting as a critical structural floor where historical buying pressure has previously originated.
- Upside Target: If buyers successfully defend this demand zone and momentum shifts, a strong recovery and expansion
BARDUSDT: Bullish Recovery Targets a Breakout Toward 0.11880BARDUSDT is showing a bullish recovery on the 15-minute chart after rebounding strongly from the recent lows. Price has transitioned from the earlier sell-off into a sequence of higher lows and higher highs, while the latest consolidation is forming near the top of the recovery structure.
The long setup is positioned around 0.11324, with 0.11080 acting as the key invalidation level. If buyers maintain control above this support zone, continuation could push BARDUSDT toward 0.11880.
The setup o
BARD LONGEzra 3:11 — "And they sang together by course in praising and giving thanks unto the Lord; because he is good, for his mercy endureth for ever toward Israel: and all the people shouted with a great shout, when they praised the Lord."
The BARD hath been silent long enough.
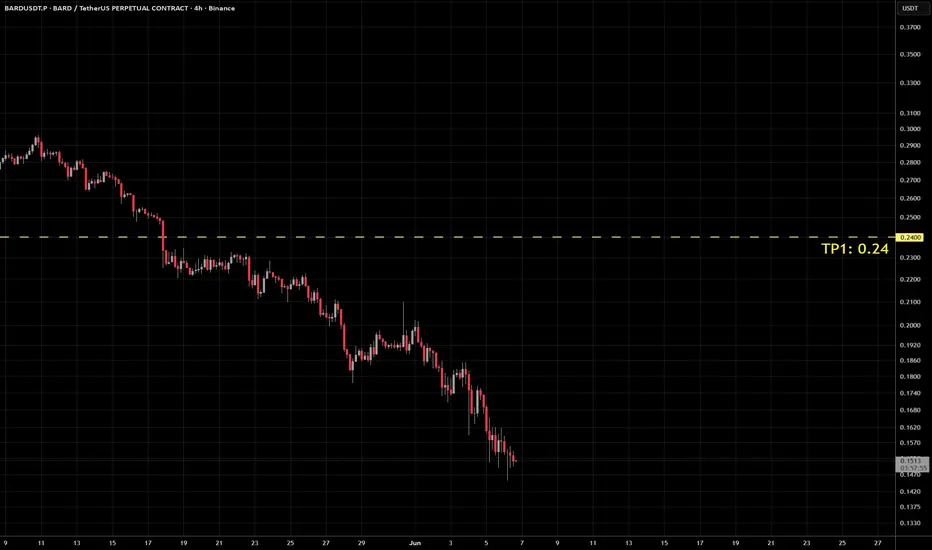
Now it singeth again. Upward. To 0.24.
Shout with a great shout, for the mercy of the Chart endureth forever.
BIG buy opportunity in BARDusdtHello Traders!
First of all congrats on Big short in BTC from 81K to 70k. Now we are ready to catch this massive Bullish move in Bardusdt.
We can see that BARD broke the trendline and it started to consolidate or we can say formed a structure above the trendline and than after moving up it is now retesting it. It is now ready to go bullish from here and the Target is Huge. Its nearly 2500% profit from this zone. Bears are already tired and Bulls will start to pump the market.
There are multip
Its time for a Pump in BARDusdtHello Traders!
First of all congrats on 5 win streak since last week and we are looking for streak continuation.
Bard is now at the extreme bottom and bulls are tired in Bardusdt. Its now inside a expanding triangle and its at the border of the pattern. It can now fly High and i am expecting atleast 23% rise in this pair.
Also there are few more confirmation about the bulls in BARDusdt.
Stoploss 0.192 (-14.2%)
Target 0.2758 (+23%)
My aim is to achieve highest win rate in tradingview tradin
BARDUSDT Deep Bearish Break + OBV Flood Divergence... Oversold Conflict
BARDUSDT prints 0.32141 spot against 0.32080 futures with F/S ratio 3.36x↑ at 14.1% percentile — Floor territory, Normal tag. Volumes pair 8.25M spot / 2.65M USDT versus 27.79M futures / 8.93M USDT — premium -0.19% Bkwd at Z 0.4, yield Bull -208% APY at 0.4σ.
Signal board stacks 8 bull to 42 bear out of 112 — heavy bear dominance reading Deep BEAR 62.87% at 4.39x edge. Candle 0:14 is pure bear, C>T 3:10, Ichi TK 4:7, Engulf 0:3, EMA 1:4 all bear. Only DD/SS 2:1 barely bul
#BARD is currently testing the lower trendline #BARD is currently testing the lower trendline of a falling wedge pattern. This pattern is typically bullish and suggests a potential reversal. The projected target after a breakout is around 1.1320.
A breakout from a falling wedge is only confirmed after a candle close above the upper trendline, so be patient .
#BARD #crypto #trading #altcoin
BARDUSDT — Clean Leverage With Volume Doing Absolutely NothingPrice at 1.0845 with futures at 1.0829. Premium is -0.15% with a Z-score of -0.2. Essentially flat. No futures dislocation. No premium play. Just two markets sitting on top of each other agreeing on price which is actually what you want to see.
Signals are 74% bull vs 26% bear. 37 green against 13 red. EMAs are a clean 10 to 0 sweep. Candles 9 to 5 and Ichi TK 8 to 3 both lean green without being extreme. Spread is 48% which is strong but not stretched. This is a measured trend, not a euphoric
BARDUSDT Forming Falling WedgeBARDUSDT is forming a clear falling wedge pattern, a classic bullish reversal signal that often indicates an upcoming breakout. The price has been consolidating within a narrowing range, suggesting that selling pressure is weakening while buyers are beginning to regain control. With consistent volume confirming accumulation at lower levels, the setup hints at a potential bullish breakout soon. The projected move could lead to an impressive gain of around 50% to 60% once the price breaks above th
BARDUSDT Forming Bullish MomentumBARDUSDT is forming a clear bullish momentum pattern, a classic bullish reversal signal that often indicates an upcoming breakout. The price has been consolidating within a narrowing range, suggesting that selling pressure is weakening while buyers are beginning to regain control. With consistent volume confirming accumulation at lower levels, the setup hints at a potential bullish breakout soon. The projected move could lead to an impressive gain of around 90% to 100% once the price breaks abov
BARDUSDT magnetizing toward deep institutional liquidity.Higher Timeframe : confirmed bearish on the 2-Hour timeframe. Crucially, the BSL 2H {0.79423} has been swept and the market has broken structure lower, signaling that the supply has been satisfied above and the ultimate drop is anticipated
• Liquidity Draw (The Target): Price is expected to hunt the major liquidity pools. The ultimate target is the SSL 2H/1H (Sell-Side Liquidity) at {0.61432}
• Market Gaps Filled: Several higher-level Voids, including the {Void 2H} {0.87629 - 0.86956}, have be
BARDUSDT.P short setup from daily support at 0.8293BINANCE:BARDUSDT.P has cleanly tested the 0.8293 level.
This level is the All-Time Low, which was the stopping point of the drop from the All-Time High.
There is a high probability that we will next see a consolidation followed by a breakdown of this level.
I really like these kinds of setups.
Key factors for this scenario:
Global & local trend alignment
Price void / low liquidity zone beyond level
Volatility contraction on approach
Momentum stall at the level
Immediate retest
No
$BARD Performing Bullish Ascending TriangleA bullish ascending triangle is a continuation chart pattern in technical analysis that signals a likely breakout to the upside. The pattern forms when an asset's price consolidates between a flat upper resistance line and an upward-sloping lower trendline, indicating that buyers are steadily gaining strength.
How to trade the pattern
Spot the pattern:
Look for an existing uptrend, followed by a period of consolidation that forms a horizontal resistance and rising support line. The pattern is