BAT/USDT (1h) Approaching a Breakout From a Symmetrical TriangleBAT/USDT is consolidating inside a symmetrical triangle on the 1H chart, with price forming lower highs beneath the descending resistance while maintaining higher lows along the rising support. The structure is now becoming very tight near the apex around $0.0910–$0.0915.
A confirmed breakout and hold above the upper trendline around $0.0915–$0.0920 could trigger a bullish expansion toward the $0.099–$0.100 measured target area.
A rejection from resistance would keep the triangle active, while a
In-depth trading ideas
BAT/USDT 8H — SPOT Accumulation & Rebalance Idea
BAT/USDT 8H — SPOT Accumulation & Rebalance Idea (+188% Potential)
BAT has formed a key imbalance during the previous bearish expansion. Price is currently trading near the lower boundary of the range, where the first signs of stabilization and accumulation are appearing.
In the medium term, I expect this imbalance to be rebalanced. The main targets are:
• Target 1 — Fibonacci level 1, around $0.177
• Target 2 — Fibonacci level 1.414, around $0.226
My profit-taking plan:
• Take 75% at level
BAT / BATUSDT Long Setup | Breaker Block ReclaimMARKET ANALYSIS
BAT is currently reacting from a key technical area highlighted on the chart.
As long as the protected support zone remains intact, the bullish market structure remains valid and higher liquidity targets may continue to attract price action.
A breakdown below the invalidation level would weaken the current bullish scenario and require a reassessment of market conditions.
📍 Entry, Stop Loss and Take Profit levels are marked directly on the chart.
━━━━━━━━━━━━━━
⚠️ DISCLA
BAT token about to moon - February 2026Remember that whole business about a select number of alt tokens “ returning to base ” in the recently published OTHERS idea? Where is the liquidity going? Ring a bell?
No? Tough.
For those of you that do remember: These are the examples you’re looking for.
1. Price action has returned to base.
2. Price action has prints support confirmation or high bullish divergence.
3. And some other stuff, not mentioned here. Basically, look left.
4. Idea is void after the month of May.
Is it possible pri
BAT USDT SHORT SIGNALBAT /USDT – Trade Setup (SHORT)
📈 Position Type: SHORT
🕒 Timeframe: 15M
📊 Market: Futures
💰 Entry Zone:
0.0966
🛑 Stop-Loss:
0.0986
🎯 Take-Profit Targets:
• TP1: 0.0946
• TP2: 0.0925
• TP3: 0.0899
• TP4: 0.0874
TP5:
⚙️ Leverage:
5–10
⚠️ After reaching TP1, move Stop-Loss to Entry Price.
📌 Risk Management:
Risk only 1–2% of your capital per trade.
Always confirm the setup on your chart before entry
BAT Looks Super Bulish (8H)The price appears to be at the end of wave i within a symmetrical structure. Once this symmetrical pattern is fully completed, the market is likely to transition into either a bullish X wave or the beginning of a new bullish cycle.
At the same time, price is currently trading around a key level, which makes this area particularly important for determining the next directional move. A strong reaction from this zone could act as a catalyst for further upside momentum.
As long as BAT holds and re
BAT/USDT – Update : THE KNOWN WHALE BUILDING TOKEN📊 BAT/USDT – Update
BAT continues trading inside a stable accumulation structure while maintaining support and gradually building momentum. The current setup suggests buyers are holding control, increasing the probability of a continuation move if momentum continues strengthening.
🎯 TP 1: 0.1167
🎯 TP 2: 0.1292
🚀 TP 3: Runner target open — allowing the trend to capture maximum upside potential.
👉 As long as price remains above the support zone, the bullish scenario stays active.
This is our t
Basic Attention Token (BAT) Completes Bottom Recovery—BullishBasic Attention Token (BAT) is producing the biggest week and the biggest candle since the February crash. With this candle, the bottom recovery process is about to be completed. We've seen over and over what this means, a massive bullish wave will show up next.
This is a project that we've been tracking for a while and not one has failed to recover. Sure, some are taking more than others to move but notice the pattern, they are all moving forward at some point in time.
Some started to move ri
BAT/USDT 1H: Macro Headwinds, Liquidity ShiftsHello traders. Today we are breaking down the 1-hour chart for Basic Attention Token (BAT/USDT). We will look at the current macroeconomic environment of May 2026, the latest fundamental data affecting BAT, and lay out a strict, rule-based trading plan. Our goal is to keep this analysis simple, educational, and actionable.
1. Fundamental & Macro Environment (May 2026)
To trade altcoins effectively, we must understand the broader economic landscape and the asset-specific news driving the volu
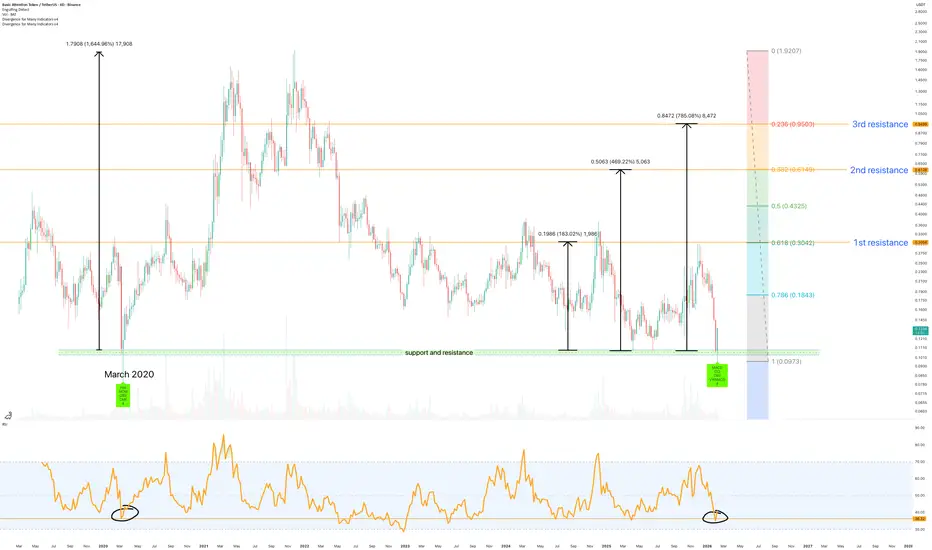
Basic Attention Token (BAT) Can Grow 6,000% (Several years)Look at this very great and appealing situation. Basic Attention Token (BAT) hit bottom March 2020, then again March 2026. These two bottoms are six years apart...
After the March 2020 bottom BATUSDT grew 2,300%. How much can this project grow after the March 2026 bottom?
It is a difficult question to answer but, it leaves no room for doubt, we are going up. That's the most beautiful part.
It is hard to know if the bullish cycle will last 3 years or 3 months. But, it is 100% certain we are go
$BAT Major Demand Zone Activated on Daily ChartBINANCE:BATUSDT
BITMEX:BAT Buyers Fair Value Gap #15 Captured: Major Demand Zone Activated on Daily Chart 🔥
🧐 Strong Bearish Impulse Reaching Exhaustion
Basic Attention Token has been in a prolonged downtrend since early 2026, printing lower highs and lower lows. However, the price has now entered a critical Buyers Fair Value Gap #15 (0.0984 – 0.1060), with current levels trading right inside this high-probability demand zone around 0.1095.
📉*Current Market Structure:
- Extended bearish
Basic Attention Token: bounce potential? key levels to monitorBasic Attention Token – ready for a bounce or about to fall through the floor? While majors are chopping after the latest crypto headline storm about regulation and ETF flows, BAT quietly slid back into a big historical demand zone. According to industry sources, interest around privacy and ad‑tech tokens is picking up again, so this pullback happens right where longer‑term players tend to reload.
On the 4H chart, price is sitting in that thick orange support block with visible volume memory an
Basic Attention Token 8X Long with 1,248% profits potentialWe have many signals to support this chart setup. The MACD has a bullish cross, marketwide action, Bitcoin closing seven consecutive days green while trading above $70,000, several altcoins moving ahead...
Basic Attention Token, BATUSDT, is now moving to complete the classic Adam & Eve bottom reversal pattern. This formation supports higher prices.
See the full trade-numbers for a wonderful trade:
_____
LONG BATUSDT
Leverage: 8X
Potential: 1248%
Allocation: 5%
Entry zone: $0.0945 - $0.10
Basic Attention Token: ready for a bounce? key levels to watchBasic Attention Token. Waiting for this thing to finally stop dripping and give a bounce? Recently the whole altcoin pack has been moving in the shadow of the major coins, and according to market sources ad-related tokens are still under quiet accumulation while the browser project keeps shipping updates in the background.
On the 4H chart BAT is sitting right on local support around 0.12 with a clear volume node just above price that acts like a magnet. RSI bounced from oversold and is curling
BAT/USDT — Descending Channel: Reversal or Bearish Continuation?On the 12-hour timeframe, BAT/USDT remains in a medium-term downtrend after failing to hold the supply area above 0.28. Price continues to move consistently within a descending channel, indicating that selling pressure is still dominant, although bearish momentum has started to slow down.
The current price structure shows lower highs and lower lows, confirming that the primary trend remains bearish until a valid breakout is confirmed.
---
Pattern Explanation
Price is forming a Descending Ch
$bat 1 week 📌 BITMEX:BAT has been in a massive downtrend since 2022, with continuous lower highs ❌
📌Price has been rejected 4 times from the descending trendline, and every rejection caused a strong drop ✅
📌After each drop, price pulled back into the green strong support zone — this has happened 4 times already 🔁
📌Right now:
👉 Price is near the support zone again (not fully tapped yet)
👉 Trendline still not broken ⚠️
📌For bullish confirmation:
✔️ Price must hold the green support zone
✔️ Then break the
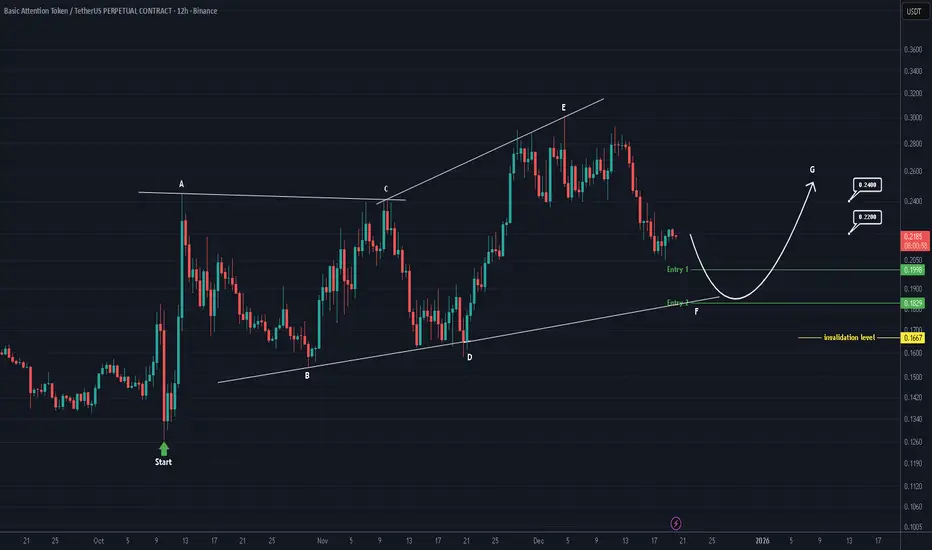
BAT Analysis (4H)From the point we marked as the start, BAT appears to have entered a bullish diametric pattern.
It now seems to be in wave F, which is a bearish wave.
We have identified two entry points for BAT, where positions can be opened using a DCA approach.
The targets have been marked on the chart.
A daily candle close below the invalidation level will invalidate this analysis.
For risk management, please don't forget stop loss and capital management
When we reach the first target, save some profit a
BAT Analysis (1D)The structure of BAT is bullish, but we should not forget that it is approaching a key level.
BAT is getting close to a strong liquidity pool.
If price reaches the LP zone, we will look for sell / short positions toward the marked targets.
A daily candle close above the invalidation level will invalidate this analysis.
Do not enter the position without capital management and stop setting
Comment if you have any questions
thank you
$BAT 1WThe BITMEX:BAT in the weekly timeframe is in a downtrend and is trading within a descending channel.
The price is forming lower highs and lower lows.
The channel's midline is a critical and important level, which could create a bullish bounce.
However, if it breaks below this level, a price drop to the channel's bottom is anticipated.
See if it can rally after holding support at 0.2558-0.2672
Hello, fellow traders!
Follow us to get the latest updates quickly.
Have a great day!
-------------------------------------
(BATUSDT 1M Chart)
After a significant decline, the price is forming a close above the M-Signal indicator on the 1M chart.
Accordingly, if the price remains above the M-Signal indicator on the 1M chart, the long-term uptrend is expected to continue.
Since the StochRSI 80 indicator is forming at 0.2448, we should examine whether it finds support near this level and ca
$BAT finally pushed through the descending channel 🚨🚨🚨✅ BITMEX:BAT finally pushed through the descending channel and is holding above 0.25. As long as it holds above 0.25, the breakout stays valid and the upside targets stay in play. That level is the line that keeps the momentum alive. If buyers defend it on the next retest, the move can stretch quickly because there isn’t much real resistance until higher levels. This is where patience pays off.
BAT - Is This the Start of a Bigger Continuation?📈BAT has been steadily shifting from accumulation into a clear bullish structure , forming higher lows and pressing back into the major resistance from earlier this quarter.
⚔️Price is now retesting the red breakout level, which previously acted as resistance during the correction phase.
As long as BAT holds above this level, we will be looking for continuation setups, expecting buyers to maintain control and push toward the major resistance around 0.3550.
🏹A clean retest followed by bullish
BAT is getting close to the buyers' zone (3D)After multiple drops, it seems that BAT is getting close to a strong support level. In this zone, it is possible to buy gradually in spot.
The targets are indicated on the chart.
The closure of a daily candle below the invalidation level will invalidate this analysis.
Do not enter the position without capital management and stop setting
Comment if you have any questions
thank you