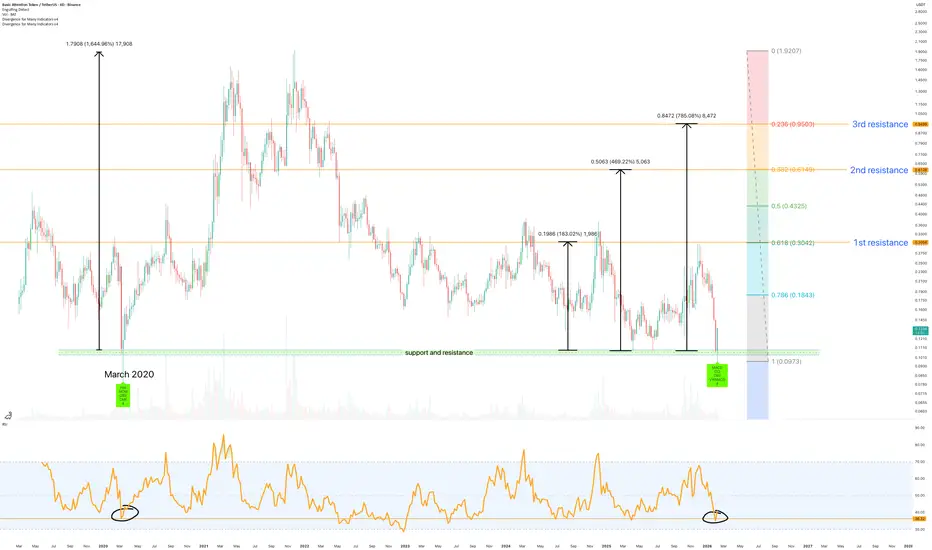
BAT token about to moon - February 2026Remember that whole business about a select number of alt tokens “ returning to base ” in the recently published OTHERS idea? Where is the liquidity going? Ring a bell?
No? Tough.
For those of you that do remember: These are the examples you’re looking for.
1. Price action has returned to base.
2. Price action has prints support confirmation or high bullish divergence.
3. And some other stuff, not mentioned here. Basically, look left.
4. Idea is void after the month of May.
Is it possible price action keeps on correcting below legacy support? Sure.
Is it probable? 10% to be technical.
Ww
=====================================
Disclaimer
This is not financial advice. It’s an observation, the kind you’re free to ignore while holding a token with no users, no revenue, and a supply schedule that looks like it was designed by a printer on fire.
If you buy it and it goes up, you’re a genius.
If you buy it and it goes down, it was “market manipulation.”
Do your own research. Or don’t. Just don’t confuse hope with a business model.
In-depth trading ideas
BAT USDT SHORT SIGNALBAT /USDT – Trade Setup (SHORT)
📈 Position Type: SHORT
🕒 Timeframe: 15M
📊 Market: Futures
💰 Entry Zone:
0.0966
🛑 Stop-Loss:
0.0986
🎯 Take-Profit Targets:
• TP1: 0.0946
• TP2: 0.0925
• TP3: 0.0899
• TP4: 0.0874
TP5:
⚙️ Leverage:
5–10
⚠️ After reaching TP1, move Stop-Loss to Entry Price.
📌 Risk Management:
Risk only 1–2% of your capital per trade.
Always confirm the setup on your chart before entry
BAT Looks Super Bulish (8H)The price appears to be at the end of wave i within a symmetrical structure. Once this symmetrical pattern is fully completed, the market is likely to transition into either a bullish X wave or the beginning of a new bullish cycle.
At the same time, price is currently trading around a key level, which makes this area particularly important for determining the next directional move. A strong reaction from this zone could act as a catalyst for further upside momentum.
As long as BAT holds and respects the green support zone, it has the potential to continue moving toward the defined targets. Maintaining this support is crucial for preserving the bullish outlook.
The targets are clearly marked on the chart. From a risk management perspective, it is recommended to move your stop loss to breakeven once the first target is reached, in order to protect capital while allowing the position to run further.
However, if a daily candle closes below the invalidation level, this bullish scenario will no longer be valid and the overall outlook should be reconsidered.
If you have a coin or altcoin you want analyzed, first hit the like button and then comment its name so I can review it for you.
Do you also think BAT is bullish?
BAT/USDT – Update : THE KNOWN WHALE BUILDING TOKEN📊 BAT/USDT – Update
BAT continues trading inside a stable accumulation structure while maintaining support and gradually building momentum. The current setup suggests buyers are holding control, increasing the probability of a continuation move if momentum continues strengthening.
🎯 TP 1: 0.1167
🎯 TP 2: 0.1292
🚀 TP 3: Runner target open — allowing the trend to capture maximum upside potential.
👉 As long as price remains above the support zone, the bullish scenario stays active.
This is our trading expectation and not financial advice : everything depends on confirmed trend continuation.
Basic Attention Token (BAT) Completes Bottom Recovery—BullishBasic Attention Token (BAT) is producing the biggest week and the biggest candle since the February crash. With this candle, the bottom recovery process is about to be completed. We've seen over and over what this means, a massive bullish wave will show up next.
This is a project that we've been tracking for a while and not one has failed to recover. Sure, some are taking more than others to move but notice the pattern, they are all moving forward at some point in time.
Some started to move right after the crash in February, that's good. Others started to grow only in March, that's great. There was strong bullish action in April, awesome, and now comes May. And the pattern continues to unfold with more projects moving up.
After the first move, the initial bullish breakout, we get a pause. Guess what happens after this pause? Additional growth, that's for sure, it is already old.
This is the chart for BATUSDT on the weekly timeframe, showing the full long-term cycle.
A low March 2020 followed by a strong bull market. A low March 2026 followed by years of growth. I was thinking, maybe I should show you the daily chart for short-term targets since it can take years to hit the whole range and a new all-time high. But the alarm still works.
The consolidation period is over; the bottom recovery process is done. Just like XLM, HBAR & ALGO, we are going up. This going up will only intensify... And I am happy to count with your continued support.
You know where to look when you want to find charts on all the altcoins. Master Ananda.
Thank you for reading.
Namaste.
batusdt shortInstructions:
Entry point: yellow
Stop loss: red
Take profit: green
👉Leverage x 5-10-20 for crypto
👉Leverage x 20-50-100 for commodities, stocks, indices, and forex
👉Margin 1-5% max.
Always practice risk and money management.
Invest a maximum of 5% on any trade or across all your trades.
Invest only what you can afford to lose, as no one is in control of the market.
👉Our analyses are primarily based on:
breakouts: two trend lines (ascending and descending) and a line indicating a horizontal breakout.
chart patterns: shoulders and head, triangle parttern, elliott impulse, etc etc.
We don't always have the time to track them at all times or to represent them visibly, given the numerous signals, the number of channels to manage, and especially because of the often rapid pace of market movements.
indicators: We associate at least two indicators with this technique.
👉Depending on the circumstances, we use specific indicators, often setting 3 or more take profit levels.
👉Indeed, there are good days in trading and also bad days. No one can promise to win every trade, and like all traders worldwide, we also experience stop-loss orders. However, we win more than we lose and remain positive.
👉You can close the position before or after the take profit orders indicated by the green lines if you are personally satisfied; the same applies to stop loss orders.
👉We must stay positive, clear-headed, and humble.
we cannot provide all instructions or all trades here on this channel.
Good luck to us all, and may God guide us. Amen.
BAT/USDT 1H: Macro Headwinds, Liquidity ShiftsHello traders. Today we are breaking down the 1-hour chart for Basic Attention Token (BAT/USDT). We will look at the current macroeconomic environment of May 2026, the latest fundamental data affecting BAT, and lay out a strict, rule-based trading plan. Our goal is to keep this analysis simple, educational, and actionable.
1. Fundamental & Macro Environment (May 2026)
To trade altcoins effectively, we must understand the broader economic landscape and the asset-specific news driving the volume.
• The Macro Headwind (Sticky Inflation):
As we navigate through May 2026, the broader crypto market is dealing with macroeconomic friction. Inflation has remained stickier than anticipated, forcing central banks to maintain higher interest rates for longer than the market initially priced in. This tight liquidity environment generally pressures risk-on assets like altcoins, making massive, uninterrupted rallies difficult.
• BAT Fundamentals & Liquidity Shift:
While the Brave browser continues to see steady user adoption in the Web3 space, BAT recently faced a notable short-term headwind. On May 1st, 2026, Binance officially delisted the BAT/BTC spot trading pair. While the USDT pair remains active, removing the BTC pair fragments liquidity and makes it harder for large institutional capital to rotate directly from Bitcoin into BAT. This lack of direct liquidity is a key reason why BAT is currently struggling at major resistance levels despite the short-term uptrend.
2. Technical Breakdown: The 1-Hour Chart
Looking at the volume profile and market structure, BAT is currently trading within a local ascending channel but is approaching critical decision points.
• First Resistance (Grey Box, ~0.1115 - 0.1125):
The price is currently testing this supply zone. The volume profile shows historical selling pressure sitting exactly in this area.
• First Support of Momentum (Blue Box 1, ~0.1090 - 0.1105):
This zone perfectly aligns with the lower boundary of our ascending channel and a solid high-volume node. It is the first logical area for a bounce if the price pulls back.
• Strong Demand Zone (Blue Box 2, ~0.1040 - 0.1065):
If the macro environment worsens and the channel breaks, this is our heavy support. The thickest bars on the volume profile indicate the Point of Control (POC)—the area where the most historical trading occurred.
3. The Execution Plan: Strict 'Blue Box' Rules
We do not gamble with blind limit orders. We execute based on confirmation and order flow. Here is our exact playbook for these zones:
• Trading Resistance (Grey Box):
Since we are at resistance, we must look for seller absorption. If we see buyers aggressively trying to push the price up, but the price refuses to break out, and "sellers with result" step in to reject the high, we can look for a short trade.
• Break & Retest Rule:
If the price violently breaks through this grey resistance box with strong volume, we do NOT chase the green candles. We wait for the price to pull back, retest the top of the box as new support, and show buyer absorption before entering a long position.
• Trading the Supports (Blue Boxes):
If the price drops into our Blue Boxes, we wait. We dive into the volume footprint chart. We want to see buyer absorption—aggressive sellers hitting the market, but the price stops falling. We must see "buyers with result" step in to defend the level and successfully push the price up. This is our trigger to go long.
• Candlestick Alternative (Wicks):
If you do not use volume footprint charts, watch the 1-hour candles closely. A valid entry looks like a deep plunge into the blue (or grey) box that gets aggressively rejected, leaving a long wick (shadow) and closing strongly in the direction of our trade.
• Invalidation:
If the price enters any of these boxes and slices straight through with full-bodied candles and zero wicks or footprint absorption, there is no setup. We simply step aside and protect our capital.
Summary
The macro environment is tense, and BAT is dealing with recent liquidity shifts. We will respect the ascending channel but rely strictly on absorption and confirmation inside our marked zones before executing a trade.
Disclaimer
This analysis is for educational purposes only. Always perform your own due diligence and use strict risk management.
Basic Attention Token (BAT) Can Grow 6,000% (Several years)Look at this very great and appealing situation. Basic Attention Token (BAT) hit bottom March 2020, then again March 2026. These two bottoms are six years apart...
After the March 2020 bottom BATUSDT grew 2,300%. How much can this project grow after the March 2026 bottom?
It is a difficult question to answer but, it leaves no room for doubt, we are going up. That's the most beautiful part.
It is hard to know if the bullish cycle will last 3 years or 3 months. But, it is 100% certain we are going up. Simply because the market already hit bottom and from this bottom we grow. The same 2020 market conditions but in 2026. Nice, isn't it?
I sure know it is. The Cryptocurrency market is very easy to predict.
If you enjoy the content, follow me.
Namaste.
$BAT Major Demand Zone Activated on Daily ChartBINANCE:BATUSDT
BITMEX:BAT Buyers Fair Value Gap #15 Captured: Major Demand Zone Activated on Daily Chart 🔥
🧐 Strong Bearish Impulse Reaching Exhaustion
Basic Attention Token has been in a prolonged downtrend since early 2026, printing lower highs and lower lows. However, the price has now entered a critical Buyers Fair Value Gap #15 (0.0984 – 0.1060), with current levels trading right inside this high-probability demand zone around 0.1095.
📉*Current Market Structure:
- Extended bearish move with multiple strong red candles
- Clear impulsive decline visible across the daily timeframe
- Price has reached a significant imbalance area where buyers historically step in
💡 High-Probability Scenarios:
1.*Bullish Reversal Setup → The filled Buyers FVG often acts as strong support. If price stabilizes here and forms a higher low with bullish candles, we could see a relief rally targeting 0.1350 – 0.1500 first, then potentially retesting higher resistances.
2. Bearish Continuation → If the gap fails to hold and we get a decisive daily close below 0.0984, the downtrend may extend toward 0.0770 – 0.0630 zone (next major demand levels).
⚠️*Key Levels to Watch:
- Support: 0.0984 – 0.1060 (Buyers FVG – critical zone)
- Resistance: 0.1350 then 0.1500 – 0.1700
- Invalidation of bullish scenario: sustained close below 0.0984
This is a classic “money is made by sitting” moment — waiting for clear confirmation inside this demand zone before taking action. Patience and discipline will be rewarded here.
#BAT #BATUSDT #BasicAttentionToken #Crypto #Altcoins #FairValueGap #DemandZone #SmartWedgeTrader #TradingView #CryptoTrading #ReversalSetup
Basic Attention Token: bounce potential? key levels to monitorBasic Attention Token – ready for a bounce or about to fall through the floor? While majors are chopping after the latest crypto headline storm about regulation and ETF flows, BAT quietly slid back into a big historical demand zone. According to industry sources, interest around privacy and ad‑tech tokens is picking up again, so this pullback happens right where longer‑term players tend to reload.
On the 4H chart, price is sitting in that thick orange support block with visible volume memory and RSI hanging near the low 30s after a sharp dump. I’m leaning bullish from here – classic “liquidity grab into demand” vibe – looking for a mean‑reversion push back toward the recent local highs. If buyers step in, this could turn into a short‑squeeze setup as late shorts get trapped.
My plan: ✅ look for a higher low or a strong green 4H candle from this zone and target the mid‑range levels above, then potentially the upper red resistance area if momentum really kicks in. If we lose this orange block with clear selling volume, I switch bias – below here it can quickly slide to fresh lows and the bounce idea is dead. I might be wrong, but for now I’m stalking longs and letting price action prove me right or stop me out fast.
Basic Attention Token 8X Long with 1,248% profits potentialWe have many signals to support this chart setup. The MACD has a bullish cross, marketwide action, Bitcoin closing seven consecutive days green while trading above $70,000, several altcoins moving ahead...
Basic Attention Token, BATUSDT, is now moving to complete the classic Adam & Eve bottom reversal pattern. This formation supports higher prices.
See the full trade-numbers for a wonderful trade:
_____
LONG BATUSDT
Leverage: 8X
Potential: 1248%
Allocation: 5%
Entry zone: $0.0945 - $0.1050
Targets:
1) $0.1250
2) $0.1433
3) $0.1735
4) $0.1982
5) $0.2222
6) $0.2578
Stop: Close weekly below $0.0940
_____
Thank you for reading, your continued support is highly appreciated.
This is a time sensitive chart setup. The entry zone can be gone within hours. A few days at the most.
My strategy is simple, buy and hold while prices are low. No pyramiding, no rebuying on the way up. Buy and hold.
Sell when the action goes above 100%.
I am wishing for you tons of health, wealth and success.
Namaste.
Basic Attention Token: ready for a bounce? key levels to watchBasic Attention Token. Waiting for this thing to finally stop dripping and give a bounce? Recently the whole altcoin pack has been moving in the shadow of the major coins, and according to market sources ad-related tokens are still under quiet accumulation while the browser project keeps shipping updates in the background.
On the 4H chart BAT is sitting right on local support around 0.12 with a clear volume node just above price that acts like a magnet. RSI bounced from oversold and is curling up, so I lean to a corrective move higher rather than a fresh dump. I might be wrong, but for now I treat the prior fall as overextended and expect a retest of the 0.126-0.13 resistance cluster.
My plan: look for longs on dips closer to 0.12 with a tight invalidation under 0.118. ✅ Base case - push into 0.126 then 0.13 where I would start locking in profit. ⚠️ If 0.118 gives way and we close below it on 4H, I flip the script and expect continuation down toward 0.112-0.11, staying flat until a new base forms.
BAT/USDT — Descending Channel: Reversal or Bearish Continuation?On the 12-hour timeframe, BAT/USDT remains in a medium-term downtrend after failing to hold the supply area above 0.28. Price continues to move consistently within a descending channel, indicating that selling pressure is still dominant, although bearish momentum has started to slow down.
The current price structure shows lower highs and lower lows, confirming that the primary trend remains bearish until a valid breakout is confirmed.
---
Pattern Explanation
Price is forming a Descending Channel (Bearish Channel):
Upper line (red): dynamic resistance
Lower line (yellow): dynamic support
Channel midline: temporary reaction zone
This pattern reflects stable seller control, where buyers are only able to generate short-lived relief bounces without changing the overall trend structure.
The descending channel is technically considered a bearish continuation pattern, unless a strong breakout to the upside occurs.
---
Key Levels
Resistance:
0.2325 – 0.2430 → supply zone / horizontal resistance
0.2800 → major resistance & previous breakdown area
Support:
0.2000 → psychological support & current reaction area
0.1750 → lower channel support
0.1547 → previous low (major support)
---
Bullish Scenario
The bullish scenario is only valid if a confirmed breakout occurs:
1. Price breaks and closes above the upper channel
2. Break above 0.2325 – 0.2430 accompanied by increasing volume
3. Structure shifts into higher highs and higher lows
Bullish targets (step-by-step):
0.2600
0.2800
0.3040 (previous high)
Without a channel breakout, any upward move should be considered a pullback within a downtrend.
---
Bearish Scenario
The bearish scenario remains the primary scenario:
1. Price fails to break the upper channel
2. Rejection occurs around the 0.2200 – 0.2300 area
3. Breakdown below 0.2000 support
Bearish continuation targets:
0.1750
0.1547 (major support / potential capitulation zone)
As long as price stays inside the channel, the probability of forming a new lower low remains high.
---
Conclusion
BAT/USDT is still trading within a valid descending channel, indicating that the bearish trend is not yet over. Buyers need a clear structural breakout to reverse the trend. As long as price is capped below channel resistance, downside risk remains dominant.
Recommended approach:
Wait for a breakout + retest for safer long entries
Or look for rejection at resistance to trade in line with the trend
#BATUSDT #BAT #CryptoAnalysis #TechnicalAnalysis #DescendingChannel #BearishTrend #Altcoin #PriceAction #Downtrend
$bat 1 week 📌 BITMEX:BAT has been in a massive downtrend since 2022, with continuous lower highs ❌
📌Price has been rejected 4 times from the descending trendline, and every rejection caused a strong drop ✅
📌After each drop, price pulled back into the green strong support zone — this has happened 4 times already 🔁
📌Right now:
👉 Price is near the support zone again (not fully tapped yet)
👉 Trendline still not broken ⚠️
📌For bullish confirmation:
✔️ Price must hold the green support zone
✔️ Then break the descending trendline with strength
📌Final conclusion:
BITMEX:BAT is still BEARISH in higher timeframe until trendline breaks.
Support + patience = opportunity 🔥
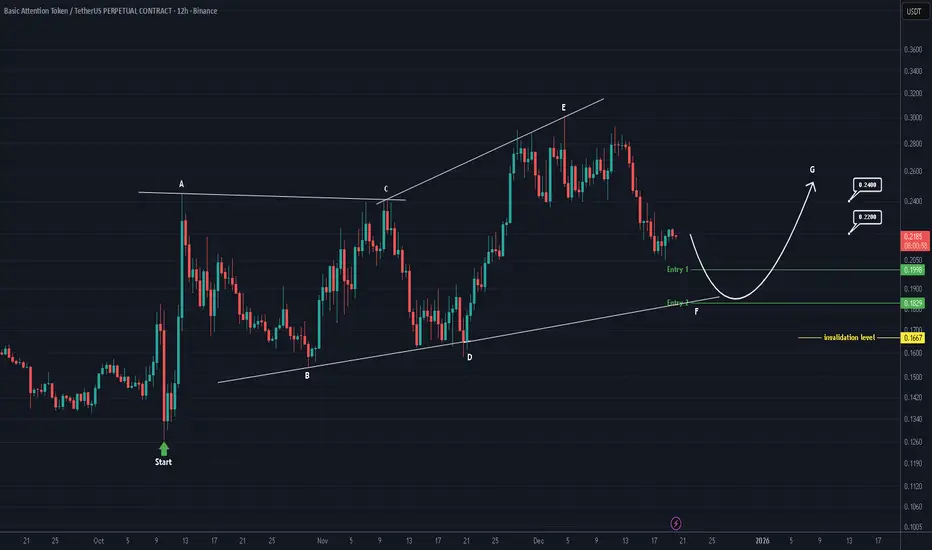
BAT Analysis (4H)From the point we marked as the start, BAT appears to have entered a bullish diametric pattern.
It now seems to be in wave F, which is a bearish wave.
We have identified two entry points for BAT, where positions can be opened using a DCA approach.
The targets have been marked on the chart.
A daily candle close below the invalidation level will invalidate this analysis.
For risk management, please don't forget stop loss and capital management
When we reach the first target, save some profit and then change the stop to entry
Comment if you have any questions
Thank You
BAT Analysis (1D)The structure of BAT is bullish, but we should not forget that it is approaching a key level.
BAT is getting close to a strong liquidity pool.
If price reaches the LP zone, we will look for sell / short positions toward the marked targets.
A daily candle close above the invalidation level will invalidate this analysis.
Do not enter the position without capital management and stop setting
Comment if you have any questions
thank you
$BAT 1WThe BITMEX:BAT in the weekly timeframe is in a downtrend and is trading within a descending channel.
The price is forming lower highs and lower lows.
The channel's midline is a critical and important level, which could create a bullish bounce.
However, if it breaks below this level, a price drop to the channel's bottom is anticipated.
See if it can rally after holding support at 0.2558-0.2672
Hello, fellow traders!
Follow us to get the latest updates quickly.
Have a great day!
-------------------------------------
(BATUSDT 1M Chart)
After a significant decline, the price is forming a close above the M-Signal indicator on the 1M chart.
Accordingly, if the price remains above the M-Signal indicator on the 1M chart, the long-term uptrend is expected to continue.
Since the StochRSI 80 indicator is forming at 0.2448, we should examine whether it finds support near this level and can rise.
A full-scale uptrend is likely to begin when it rises above the Fibonacci level of 0.236 (0.4232).
If a full-scale uptrend begins, the target point is around 0.8357.
-
(1D chart)
Therefore, the key question is whether it can find support near the 0.2479-0.2672 range and rise above 0.3457-0.3560.
If it declines, we should examine whether support is found near the M-Signal indicator on the 1M chart.
Therefore, support around 0.2026 is crucial.
-
Thank you for reading to the end.
I wish you successful trading.
--------------------------------------------------
$BAT finally pushed through the descending channel 🚨🚨🚨✅ BITMEX:BAT finally pushed through the descending channel and is holding above 0.25. As long as it holds above 0.25, the breakout stays valid and the upside targets stay in play. That level is the line that keeps the momentum alive. If buyers defend it on the next retest, the move can stretch quickly because there isn’t much real resistance until higher levels. This is where patience pays off.
BAT - Is This the Start of a Bigger Continuation?📈BAT has been steadily shifting from accumulation into a clear bullish structure , forming higher lows and pressing back into the major resistance from earlier this quarter.
⚔️Price is now retesting the red breakout level, which previously acted as resistance during the correction phase.
As long as BAT holds above this level, we will be looking for continuation setups, expecting buyers to maintain control and push toward the major resistance around 0.3550.
🏹A clean retest followed by bullish rejection would provide the ideal continuation entry.
However, if price breaks below the level again, this scenario becomes invalid in the short term.
Are you tracking BAT’s breakout structure too? Let me know 👇🔥
⚠️ Disclaimer: This is not financial advice. Always do your own research and manage risk properly.
📚 Stick to your trading plan regarding entries, risk, and management.
Good luck! 🍀
All Strategies Are Good; If Managed Properly!
~Richard Nasr
BAT is getting close to the buyers' zone (3D)After multiple drops, it seems that BAT is getting close to a strong support level. In this zone, it is possible to buy gradually in spot.
The targets are indicated on the chart.
The closure of a daily candle below the invalidation level will invalidate this analysis.
Do not enter the position without capital management and stop setting
Comment if you have any questions
thank you
BAT – Decision Point Ahead as Structure TightensBAT is approaching a critical decision zone as price moves within a tightening structure. After a strong impulsive leg upward, the market is now forming a potential topping pattern while sitting directly on the trendline support.
The current behaviour shows two possible scenarios depending on how price reacts around this region. The market has respected this ascending support multiple times, making it an important level to watch closely.
Key Observations:
• The recent high has created a potential double-top structure, signalling exhaustion.
• Price is currently testing the trendline, which defines the short-term bias.
• A clean reclaim above the nearest resistance can re-ignite bullish momentum.
• A breakdown from the trendline would confirm deeper corrective movement.
Bullish Scenario:
If price holds the ascending trendline and pushes back above the recent breakdown zone, the next wave upward may begin. Momentum would favour a move into the next high-liquidity region.
Bearish Scenario:
A confirmed break below the trendline would open the path toward lower support levels. This scenario implies that the current rally was an overextension and needs deeper correction before any continuation.
In simple terms:
BAT is at a major support level.
Hold the trendline and it can send another bullish wave.
Lose the trendline and a deeper pullback becomes likely.
BATUSDT Forming Bullish MomentumBATUSDT is forming a clear bullish momentum pattern, a classic bullish reversal signal that often indicates an upcoming breakout. The price has been consolidating within a narrowing range, suggesting that selling pressure is weakening while buyers are beginning to regain control. With consistent volume confirming accumulation at lower levels, the setup hints at a potential bullish breakout soon. The projected move could lead to an impressive gain of around 90% to 100% once the price breaks above the wedge resistance.
This falling wedge pattern is typically seen at the end of downtrends or corrective phases, and it represents a potential shift in market sentiment from bearish to bullish. Traders closely watching BATUSDT are noting the strengthening momentum as it nears a breakout zone. The good trading volume adds confidence to this pattern, showing that market participants are positioning early in anticipation of a reversal.
Investors’ growing interest in BATUSDT reflects rising confidence in the project’s long-term fundamentals and current technical strength. If the breakout confirms with sustained volume, this could mark the start of a fresh bullish leg. Traders might find this a valuable setup for medium-term gains, especially as the wedge pattern completes and buying momentum accelerates.
✅ Show your support by hitting the like button and
✅ Leaving a comment below! (What is your opinion about this Coin?)
Your feedback and engagement keep me inspired to share more insightful market analysis with you!